

Introduction
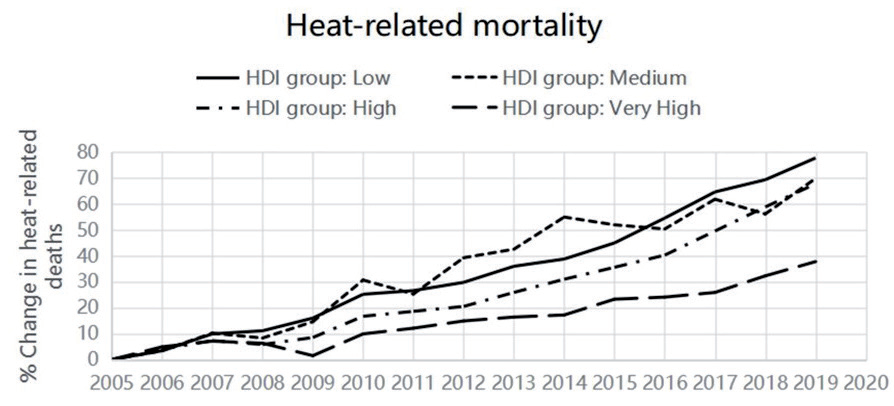
Natural disasters caused by climate change, such as increased frequency and severity of storms, flooding, droughts, and sea level rise, are becoming more and more of a global concern. The continuous deterioration of environmental quality has now emerged as an urgent global issue threatening human survival. Greenhouse gas emissions, particularly carbon dioxide emissions, are the primary drivers of these adverse climate changes [1]. Atmospheric carbon dioxide concentrations have exceeded 416 ppm by the end of 2021 [2]. At the same time, there has been a gradual increase in mortality due to the heat effect caused by carbon emissions (as shown in Fig. 1).
With economic development and rising living standards, the demand for convenient and multifunctional products and services continues to grow, driving the advancement of more innovative and complex products [3]. This results in an augmentation of economic complexity, which leads to an escalation in energy consumption and the expansion of industrial scale [4]. In other words, the world is becoming increasingly complex. However, as noted by Lee et al. [5], the economic growth rates in most countries typically fail to ensure the sustainable use of resources. Studies indicate that countries are attempting to transition from simple traditional production to complex economic systems that rely on knowledge and technology [6]. However, this structural transformation significantly impacts greenhouse gas emissions [7, 8].
Economic Complexity (EC) is defined as a way to measure a country’s economic structure. It is regarded as one of the comprehensive indicators of national economic advancement based on knowledge, skills, and products [9], reflecting the structure of an economy’s economy and the level of technology [10] as well as the country’s ability to build a diversification of goods and services [11]. Furthermore, the degree of product diversification and the popularity of manufactured goods are indicated by the economic complexity [12]. In this case, economic complexity intertwines with production activities and can influence energy use and environmental quality in various ways. Countries with high economic complexity typically possess advanced technology and innovation capabilities, which help improve production efficiency and reduce reliance on fossil fuels, contributing to environmental sustainability [13, 14]. The transfer and diffusion of technology enable other countries to adopt more environmentally friendly production techniques, significantly enhancing corporate efficiency and innovation, optimizing economic structures, and encouraging the use of clean energy while lowering the costs of producing and consuming clean energy [10]. Additionally, countries with high economic complexity often have a more diversified and high-value-added industrial structure, reducing dependence on resource-intensive and pollution-intensive industries [15]. However, the impact of increasing economic complexity on carbon emissions is not consistent across studies. As economic complexity rises, the density of the product space expands, potentially leading to environmental degradation [16]. Moreover, the increase in economic complexity often requires substantial resource input to support its intricate production systems, which may result in resource overexploitation and environmental damage [17]. Furthermore, certain high-tech industries may produce difficult-to-manage special pollutants, increasing the challenges of environmental governance and potentially exacerbating environmental deterioration [18]. Therefore, countries are faced with the dilemma of whether to enhance their economic complexity.
At the same time, institutional quality (IQ) is an important factor in environmental management. IQ is typically defined as a set of formal and informal constraints that collectively motivate the regularity of individual and societal behavior [19]. Well-established institutions are the fundamental drivers of relative prosperity worldwide [20]. High-quality institutions promote technological innovation and enhance corporate governance and regulatory capacity, which is essential for limiting polluting emissions [21]. Solarin et al. [22] and Hussain et al. [23] emphasize that institutional quality can reduce the environmental costs of rapid economic development by promoting technological spillovers and enhancing production efficiency, thereby improving environmental quality. However, Muhammad & Long [24] point out that some countries have weak systems that do not effectively promote the energy industry’s transition to clean energy, which negatively affects the environment.
Furthermore, the literature on institutional quality highlights its impact on production structures and economic complexity [25]. Particularly, better institutions are associated with higher economic sophistication obtained through innovative activities and the promotion of human capital accumulation [26, 27]. Countries with well-functioning institutions can reduce the environmental burden associated with economic pioneering [23]. Therefore, we infer that studying the relationship between EC and environmental degradation is not rigorous without considering institutional quality. In the context of the increasingly severe global climate change issue, understanding the impact of EC and IQ on carbon emissions has become particularly important. This study investigates the effects of economic complexity and institutional quality on carbon emissions across different quantiles, which is crucial for formulating effective environmental policies and promoting sustainable development.
This study empirically analyzes data from 116 countries to explore the connection between economic complexity (EC), institutional quality (IQ), and carbon emissions, highlighting the critical moderating role of IQ. It is one of the few studies to simultaneously consider IQ, EC, and CO2 emissions. The innovations of this study include providing novel empirical evidence on the relationship between EC and CO2 emissions, showing how IQ influences this relationship, and highlighting IQ’s potential as a tool for sustainable economies. Additionally, the extensive coverage of 116 countries enhances the reliability and generalizability of the findings, offering robust policy guidance. Another key innovation is the quartile-based regression analysis of carbon emission levels, which captures specific relationships between economic activities and environmental policies at different emission levels, leading to more targeted and effective policymaking. Unlike prior research that categorized countries by income level, this study focuses on carbon emission levels, avoiding the pitfalls of income-based classification, especially for resource-rich countries that may have high incomes but lag in environmental policies and energy efficiency. By analyzing carbon emission quartiles, the study directly addresses the linkages between CO2 emissions, economic activities, policymaking, and environmental impacts, resulting in more precise and effective policies.
Furthermore, this study also considers the impact of GDP, foreign direct investment, urbanization, population density, industrial development, and natural resource rents on CO2, which is particularly notable in the environmental literature [1, 18, 28]. Section 2 reviews previous literature; Section 3 is the methodology and data of this research; Section 4 discusses the empirical results; and 5 gives conclusions and recommendations.
Literature Review
EC is a metric that evaluates a nation’s ability to produce goods and services and its economic framework. It serves as a crucial indicator of a country’s potential for economic growth and sustained prosperity [7]. The higher the EC, the more competitive the economy’s production is in international markets [29]. However, the increase in EC may be accompanied by intensified environmental degradation. The enhancement of EC increases the density of the product space, bringing more opportunities and challenges, including increased energy consumption and elevated environmental pressure [16]. Some studies suggest that increased EC leads to greater energy use and product output through scale effects, exacerbating environmental degradation [30]. Marco et al. [31] view EC as a key factor for environmental degradation in the G7 economies. International research also supports this perspective. Boleti et al. [17] found that EC significantly impacted air quality. Similarly, Wang et al. [32] showed that the EC of the top ten most complex economies heavily relies on fossil fuel consumption. As economic structures shift towards high technology and industrial diversity, rising income levels increase the demand for complex products and convenient lifestyles, which may raise the risk of pollution generation and emissions. Abbasi et al. [33] further indicate that increases in EC and income levels contribute to higher carbon dioxide emissions.
Although research exists on the possible positive impacts of EC on the environment, this perspective is mainly centered on high-income economies. For example, studies by Boleti et al. [17], Chu & Le [34] and Doğan et al. [29] show that as economies shift towards knowledge-intensive production, the increase in EC favorably promotes innovation and efficiency of energy use, which helps to reduce environmental degradation. Research also indicates that economic complexity reduces the ecological footprint and mitigates the adverse environmental impacts of economic development [35]. In conclusion, the connection between EC and the environment is complicated and has bidirectional features. Thus, we propose the following hypotheses:
H1: EC has a significant effect on environmental degradation.
Institutional quality (IQ) governs interactions in a country’s economic, social, and political environment [23]. Few studies showed the impact of IQ on the environment. Better governance can improve environmental quality by reducing opportunism, promoting inter-subjective cooperation, and internalizing externalities [36]. In weak political systems, environmental policies may not be strictly enforced, while solid political institutions are essential for minimizing the environmental costs of development [24]. A comprehensive political system is considered an important tool to curb market failures [37] and to force firms to comply with pollution emission control procedures [38]. Moreover, improved government efficiency contributes to the timely and effective implementation of environmental policies, which can effectively control the increase in carbon emissions. For instance, government effectiveness can significantly reduce environmental pollution [39]. Gani and Scrimgeour [40] also showed that government effectiveness reduced water pollution in OECD countries.
However, in countries and regions with low IQ, such institutions can be the main reason for ineffective environmental policies [19, 41]. However, government stability is crucial for maintaining consistent and sustainable policies regarding investment in green product production [42]. This positively impacts productive investments in green product production, thereby contributing to the economy’s transition towards sustainable development.
Furthermore, economic activity tends to depend more on energy-intensive and highly polluting industries in regions with higher carbon emissions [43]. In these regions, the moderating effect of improved institutional quality is likely more pronounced, as it can directly affect many emission sources through stricter enforcement of environmental regulations and policies. Ahmad et. al [44] investigated the relationship between economic complexity, institutional quality, renewable energy, and ecological footprint in emerging countries. The results indicate that institutional quality contributes to reducing the ecological footprint and promoting sustainable development. In regions with higher carbon emissions, the marginal effect of environmental improvement may be more significant with improved institutional quality [20]. Existing studies indicate that economic complexity (EC) and environmental regulations contribute to promoting sustainable development. [45]. Therefore, this study proposes the following hypothesis:
H2: IQ has a significant moderating effect on EC and environmental degradation.
Upon reviewing the existing literature, we found that despite numerous studies exploring the relationship between economic complexity (EC), institutional quality (IQ), and environmental degradation, several gaps remain. Current research generally acknowledges the significant impact of EC and IQ on carbon emissions. However, most studies focus on their independent effects, lacking an in-depth analysis of their interaction. Additionally, many studies are region-specific or country-specific, missing a comprehensive global data analysis. Furthermore, categorizing countries by income level, as done in most studies, may lead to inadequate classification standards. This study systematically analyzes the interaction between EC and IQ and their impact on carbon emissions across different quantiles, addressing gaps in existing research on environmental degradation and providing new perspectives and methods for environmental policy formulation.
Regarding other environmental factors, scholars have extensively explored the drivers of environmental degradation over the past decades by applying various econometric models to global, national, and industry-level datasets. The Environmental Kuznets Curve posits an inverted U-shaped relationship between income and environmental degradation, meaning that economic development will eventually help alleviate environmental pressure [46, 47]. However, this theory needs to adequately consider the potential inhibitory effects of environmental degradation on economic development. The predicted economic turning points are also being determined, which may lead to a persistent dilemma between environmental sustainability and economic growth [48]. In contrast, the IPAT model proposed by Ehrlich & Holdren [49] takes a more comprehensive view of the impact of social, economic, and technological factors on environmental quality, considering environmental impacts as a function of population, technological innovation, and economic activity. To overcome the limitation of the linearity assumption in the IPAT model, York et al. [50] further proposed the STIRPAT model, which evaluates the elasticity of demographic, economic, and technological factors on pollution and extends to other influences. As Dinda [51] mentioned, considering only one factor in studying the relationship between economic growth and environmental factors may lead to omitted variable bias. In subsequent research on environmental degradation, the STIRPAT model has more comprehensively accounted for other important variables, such as population density [52, 53], urbanization [54], and industrialization [55]. Some cross-national studies have also revealed the roles of natural resource rents [56] and foreign direct investment [57] in environmental degradation.
Methodology and Data
Model Constructing
The establishment of the empirical model is theoretically supported by the Environmental Kuznets Curve (EKC) hypothesis, the Stochastic Impacts by Regression on Population, Affluence, and Technology (STIRPAT) model, and the Pollution Haven hypothesis. The EKC hypothesis posits a relationship between economic development and environmental degradation [46]. The STIRPAT model recognizes population, affluence, and technology as the driving forces of environmental issues. The resource curse hypothesis links natural resources to economic growth, suggesting that resource-rich countries often rely on natural resources to drive economic growth, which may lead to significant environmental problems [58]. The pollution haven hypothesis suggests that as national borders become more open to global markets, developing countries will become potential destinations for pollution-intensive firms [59].
Moreover, EC is theorized to be a key factor affecting environmental quality. The increase in EC, which is the explicit result of changes in the product mix based on the complexity of skills and knowledge [60], significantly impacts energy demand and the scale of production, which can seriously degrade the environment. However, the development of EC can also contribute to the upgrading of green products and environmentally friendly technologies, favoring the advancement of economies in developing green products and environmentally friendly technologies [6]. In contrast, simple economies cannot handle knowledge and resources efficiently, and therefore, commodity production under traditional technologies can lead to environmental degradation [61]. IQ is a non-negligible factor for economies to influence the quality of the environment through policy measures; strong institutions provide the basis for the development and implementation of rigorous environmental policies [62]. Weak institutions lead to the prevalence of corruption, slow advancement of policies, and failure of policy interventions [63]. The role of institutions is crucial for a country’s development and can significantly increase or decrease environmental degradation [23]. Based on the above, we specify the empirical model as:
ED represents the indicator of environmental degradation. Since carbon emissions are the main factor contributing to climate change, this research uses total CO2 to measure environmental degradation. STIRPAT is the environmental impact model, NRH stands for the “natural resource curse” theory, and PHH represents the pollution haven hypothesis. From the brief explanation of these theories, it is evident that income, population, technology, resource development, and openness are core factors of ED. Therefore, while examining the impact of EC on environmental degradation, we control for their effects. Considering the primary variables of this study, the function of EC and IQ can be expanded as follows:
Referring to previous studies, affluence is considered to be measured by GDP per capital; demographic factors take into account population density (POP) [53] and urbanization (URB) [54]; For technology, this study uses the percentage of industrial activity as a share of total output (IND) as a proxy [28]. The exploitation of resources is measured in terms of natural resource rents (NRR) [64]. FDI stands for foreign direct investment [37]. Additionally, considering the objectives of this study, the core explanatory variable, the Economic Complexity Index (ECI), has been included; ∂ represents the intercept term, β denotes the parameters, i indicates the cross-sectional units, which in this case are 116 countries, t stands for the time series, and ε represents the error term.
Regarding the prediction of the variables, it is important to consider that GDP can lead to a rise in energy and resource consumption [1]. Especially in the early phases of economic development, the ongoing expansion of production presents a substantial risk to the environment. Thus, considering the arguments mentioned above, it is anticipated that economic growth will result in an improving impact on CO2 (
In order to analyze the moderating effect of IQ, we add an interaction term (IQ×ECI). Thus, the equation can be extended as:
Since IQ is expected to ensure environmental sustainability, therefore, we predict a negative effect of the interaction term on CO2 (
Data
We estimate our model using a sample of 116 countries from the 2008 to 2021 World Development Indicators (WDI) database. Considering the significant global economic turning point in 2008, many countries began implementing a series of economic and environmental policies to address the impacts and challenges of the financial crisis. These policy changes have had substantial effects on economic and environmental variables. The carbon emissions data is sourced from the Global Carbon Project (GCP), widely regarded as the most comprehensive reporting platform of its kind, aimed at tracking global trends in carbon emissions and carbon sinks. The latest available carbon emissions data is for the year 2021. Therefore, we selected data from 2008 to 2021 for this study. The ECI comes from the Atlas Media database (AMD). The higher the value of the index, the more complex the country’s economy. Moreover, we use the six governance indicators as an indicator of the IQ in a country [41]. The definitions of all variables and data sources are given in Table 1.
The indicators of IQ are highly correlated, and it is impossible to include them all in one equation [67]. Therefore, we constructed an index of institutional quality using Principal Component Analysis (PCA). This technique is to combine the six indicators of institutional quality into a single variable, replicating the original data with minimal loss of information.
Estimation Methodology
Benchmark Regression
Considering the nature of the panel data; we employed a pooled model and a fixed effects model for the baseline regression analysis. Note that initially, all observations are pooled in the regression model, assuming all countries are homogeneous. To relax this assumption, the fixed effects model is used. In the fixed effects model, the intercept may vary by subject and may or may not change over time [68]. Traditional regression analysis primarily focuses on the mean, i.e., the impact of the conditional mean of the independent variable on the conditional mean of the dependent variable. Under ideal conditions, it can provide a complete description of the distributional relationship between the independent and dependent variables. However, the basic assumptions of the conditional mean framework, particularly the homoscedasticity assumption, are often not met, leading to certain limitations. In contrast, the quantile regression model can comprehensively depict the impact of the independent variable on the location, scale, and shape of the distribution of the dependent variable [69].
Moment Quantile Regression (MMQR)
The quantile regression method was introduced by Koenker and Bassett in 1978, but early research was limited to cross-sectional data. In 2004, Koenker proposed the fixed effects panel quantile regression model, which combines the advantages of panel data and quantile regression. This model can analyze spatial differences in data and possesses distinct hierarchical characteristics [70]. This is particularly useful for understanding complex nonlinear relationships in the data based on varying conditions:
Table 1.
Definition of variables.
Referring to [71], MMQR takes into account the heterogeneity of slopes and estimates the effect of ECI and IQ on carbon emissions at different distribution points. We specify the quantile of the conditional distribution of the dependent variable, τ th(0<τ<1) as a set of explanatory factors Xit. Xit includes all independent variables:
Where εit captures unobserved effects orthogonal to the dependent variable. Again, the sign of Equation (6) is used to estimate the coefficients while minimizing the residuals:
Where i represents the number of samples, t denotes the time periods, and k indicates the number of quantiles. Xit, Ptk, and Wk represents the matrix of explanatory variables, the quantile loss function, and the weight of the k-th quantile, respectively. Additionally, γ represents the adjustment parameter used to improve the estimation of β and to minimize individual effects to zero.
Results and Discussion
This section presents and discusses the findings. This research aims to find the link between EC and ED and how IQ mitigates this effect. The discussion begins by reporting the results of the baseline regression. Table 2 provides the summary statistics of the data, while Table 3 shows their correlations.
To avoid misleading conclusions due to multicollinearity in the future, we employ the VIF test to check the presence of multicollinearity. The general guideline for the VIF test is that the value of VIF should be less than 10 [72]. The results in Table 4 indicate that all VIF values are below 10 and tolerance values are greater than 0.1. This suggests that the independent variables in the regression model do not result in significant multicollinearity.
To avoid the potential issue of spurious regression caused by non-stationary data, this study employed various methods for unit root testing. The results of the unit root tests indicate that the variables in this study are generally stationary (as shown in Table 5), allowing for fixed effects testing. At the 0.01 significance level, the variables passed the robust Hausman test.
Table 2.
Descriptive statistic.
Panel Regression Result
Table 6 supported the result of the fixed effects model. The results are as follows: First, GDP, URB, and IND are positively significant (at 1%). The coefficient of GDP is 0.853, which indicates that for every 1% rise in GDP, CO2 increases by an average of 0.813% (at 1%). The positive impact of GDP on carbon emissions is justified by the fact that per capita GDP (constant 2015 dollars) has increased significantly over the past two decades from $6,606 in 1988 to $11,066 in 2021 [73]. Therefore, as countries achieve rapid economic growth, their environmental quality deteriorates. These findings are similar to Balsalobre et al. [58]. The progress in economic development has driven industrial growth and increased energy consumption, causing significant environmental damage. Additionally, this study found that the relationship between urbanization (URB), population (POP), and carbon emissions is positive but not significant.
Table 3.
Correlation matrix.
Table 4.
VIF test.
| Variable | VIF | √𝑉𝑉𝑉𝑉𝑉𝑉𝑉𝑉𝑉𝑉𝑉𝑉 | Tolerance | R2 |
|---|---|---|---|---|
| IQ | 5.17 | 2.27 | 0.19 | 0.81 |
| GDP | 3.79 | 1.95 | 0.26 | 0.74 |
| NRR | 3.31 | 1.82 | 0.30 | 0.70 |
| ECI | 3.03 | 1.74 | 0.33 | 0.67 |
| IND | 2.42 | 1.56 | 0.41 | 0.59 |
| URB | 1.87 | 1.37 | 0.53 | 0.47 |
| POP | 1.13 | 1.06 | 0.89 | 0.11 |
| FDI | 1.06 | 1.03 | 0.94 | 0.06 |
| Mean | 2.72 |
Table 5.
Results of Unit Root Tests for Relevant Variables.
Furthermore, FDI are significant suppressors of CO2. FDI involves the transfer of advanced technologies and management skills [67]. Additionally, foreign enterprises may adhere to stricter environmental standards than local companies, particularly those from countries with stringent environmental regulations [74]. These companies might implement more advanced pollution control technologies and environmental management practices, reducing carbon emissions. At the same time, FDI may promote a shift in the economic structure from heavy industry and manufacturing to less energy-intensive service and high-tech industries, which could reduce CO2. This finding aligns with the views of [74]. Interestingly, natural resource rents also suppress carbon emissions. Generally, it is believed that many resource-rich countries experience higher levels of CO2 due to their reliance on resource extraction and export, which is related to the concept of the “resource curse.” However, natural resource rents primarily come from low-carbon resources such as hydropower, wind, or solar energy. In that case, the country’s energy structure may be cleaner, leading to lower carbon emission levels. This discovery is the same with Kwakwa et al. [56].
Regarding the main variables, ECI has a notable impact on ED. This implies that as ECI grows, there is a corresponding increase in CO2. For example, the coefficient of ECI is 0.851 (at 1%) which indicates that for every 1% increase in ECI, CO2 rises by an average of 0.85%. The positive impact of ECI on CO2 suggests that an increase in ECI facilitates the expansion of production scales and export volumes. Specifically, the study results indicate that diversification of export products exacerbates environmental degradation. These findings corroborate the conclusions of Neagu [8] and Boleti [17]. IQ has a significant negative effect on carbon emissions. The estimated value of institutional quality implies that for every 1 percent improvement in institutional quality, total carbon emissions are reduced by 1.027%. This result is the same as the findings of Ahmad et al. [21]. Therefore, it also highlights that better institutional quality has a great potential to curb CO2 and that IQ helps promote environmental sustainability. Furthermore, the effect of IQ on reducing carbon emissions is significantly greater than the effect of economic complexity (EC) on increasing carbon emissions. Bowen et al. [75] emphasize that political leadership and strong institutions are crucial for a low-carbon and climate-resilient economy. Therefore, countries can strategically build institutions to effectively reduce CO2.
In order to test the intrinsic role of IQ in the relationship between EC and CO2, table 6 introduces an interaction term in the model. Table 6 shows that the coefficient of ECI×IQ is negative and significant, which implies that the combined effect of IQ and ECI reduces CO2. The recent empirical findings on IQ and ECI can be regarded as a valuable addition to the academic literature. This study offers fresh perspectives on the role of IQ in driving sustainable structural transformations in economies. Solarin et al. [22] demonstrated that stronger institutional frameworks can foster technological spillovers. Countries can improve their socio-economic conditions, control corruption, maintain democratic accountability, and, most importantly, upgrade investment structures to move towards knowledge-based and sophisticated production without compromising environmental quality.
Table 6.
Regression analysis – full sample [DV = CO2].
Results of MMQR
In Table 7, we report results based on MMQR. The results show that, all else being equal, rising ECI is associated with ED, and this relationship is significant in all quartiles. This implies that higher ECI is associated with higher CO2, which may be because countries with higher ECI have more industrialized and high-technology industries, which typically have higher carbon emissions. IQ is significantly negatively correlated with CO2 in all quartiles, and this negative correlation is more robust in the higher quartile. This implies that countries or regions with higher IQ are more effective in controlling CO2, especially for countries with higher levels of CO2, and that improving IQ has the most significant effect on reducing CO2.
Table 8 shows the results of the coefficients of the interaction term, which are negative in most quartiles (q1, q25, q50, and q90). Specifically, countries with high IQ are likely to use their complex economic structures more effectively to implement environmental technologies and management measures to reduce carbon emissions when economic complexity increases. Higher economic complexity in quartiles with higher carbon emissions may imply industrial upgrading and a transition to more efficient, cleaner technologies. At the same time, higher institutional quality provides a framework for enforcing environmental regulations and fostering the innovation and application of green technologies. Thus, the positive interaction of the two contributes to lower CO2. The interaction term has a significant negative impact on carbon emissions, indicating that high institutional quality can mitigate the negative impact of economic complexity on carbon emissions. However, in the 75p, the interaction term is not significant, which may be due to the fact that in high-carbon-emission countries or regions, the moderating effect of institutional quality is less pronounced than in other percentiles. In high-emission countries, while the combination remains effective, the magnitude of the effect is reduced. For countries with low CO2, attention needs to be paid to the risk of an initial increase in emissions that may be brought about by economic development and increased complexity and to promote the adoption of cleaner energy sources and efficient technologies through institutional strengthening and policy orientation. For countries with higher CO2, the mutually reinforcing effects of increased economic complexity and institutional quality can be part of an emissions reduction strategy to achieve sustainable development by supporting technological innovation and green transformation.
Table 7.
Quantile regression.
Table 8.
Quantile regression with interaction term [DV = CO2].
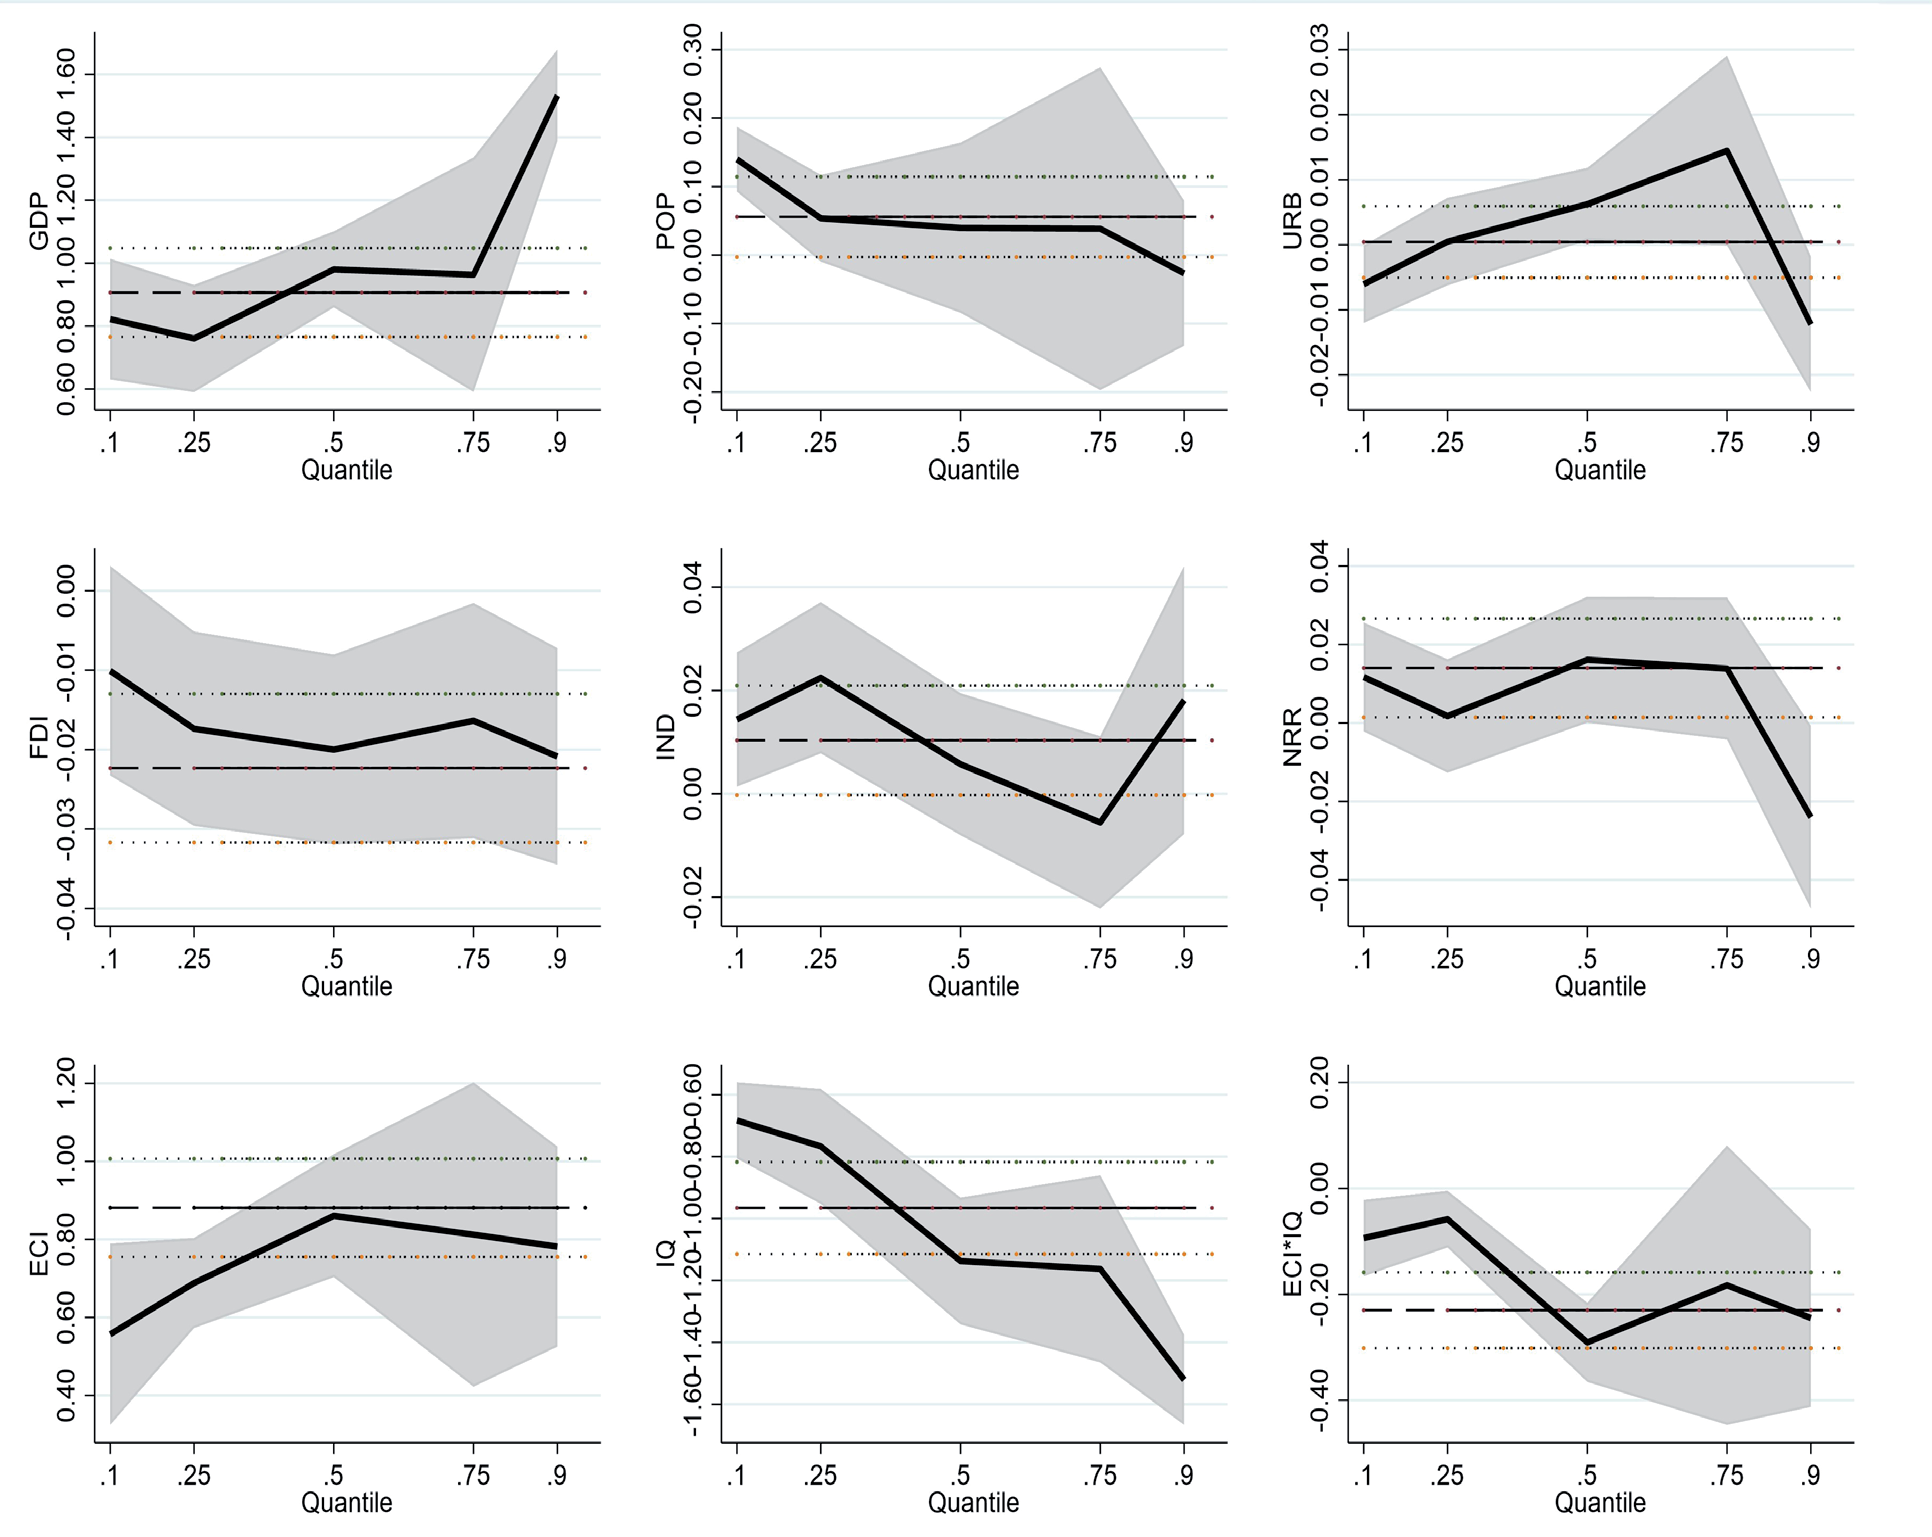
To further explore the characteristics of each variable in depicting the distribution of CO2 emissions disparity, this study presents the regression model estimation results across all quantiles. Fig. 2 displays the estimated coefficients and confidence intervals for eight explanatory variables and the interaction term ECI×IQ across all quantiles. For comparison, the solid black lines represent the OLS model’s estimated parameters, while the dashed black lines indicate the confidence intervals. As illustrated in the figure, GDP is a global variable that increases carbon emissions. Although the impact of ECI on carbon emissions varies across different emission quantiles, it consistently shows a positive influence. In contrast, IQ significantly reduces carbon emissions, and this mitigation effect increases progressively with higher carbon emissions. The influence of ECI×IQ on carbon emissions is quite stable, with its estimated coefficients closely aligning with those from the OLS estimates, consistently demonstrating a diminishing effect on carbon emissions.
The results on the control variables, GDP, POP, URB, FDI, and IND, are similar to those reported in Table 6. The difference is that the coefficient on NRR is significantly positive in the lower quartiles (q10 and q50). Natural resource rents have a significant positive impact on carbon emissions, indicating that resource-rich countries are more inclined towards high-carbon emission economic activities. The extensive exploitation of natural resources has exacerbated the dependence of their economies on high-carbon industries [69], which is difficult to change quickly. Thus, the positive correlation between natural resource rents and carbon emissions under these quartiles reflects the inertia in the economy’s structure and the transition challenges. Fortunately, FDI has a significant reducing effect on carbon emissions across all quantiles, which may indicate that foreign direct investment brings in technology and management expertise, thereby reducing carbon emissions.
Conclusions and Recommendations
Conclusions
Climate change has presented irreversible dangers to the advancement of economies and human well-being. The fundamental origins of these problems can be attributed to shifts in lifestyles, economic frameworks, and the increasing need for natural resources. This research utilizes fixed effects models and MMQR models to analyze the impact of economic complexity, institutional quality, GDP, population density, urbanization, FDI, industrial development, and natural resource rents on CO2, considering carbon dioxide as the main driver of climate change. Furthermore, the model incorporates the interaction term between ECI and IQ as a new variable in order to provide a clearer understanding of the impact of institutional quality on environmental governance.
The findings show that economic complexity significantly increases CO2, while improvements in IQ have a significant effect on reducing CO2. The moderating effect of institutional quality on carbon emissions is particularly significant in regions with severe carbon emissions. The effects of institutional quality remain significant for emitting countries. Furthermore, FDI has a positive impact on environmental quality, fully validating the pollution halo hypothesis. The relationship between NRR and CO2 varies with the level of carbon emissions; in high-emission countries, natural resource rents have a more substantial reducing effect on carbon emissions. Notably, this study considers the differences in the interaction between ECI and IQ across different levels of carbon emissions. The novel findings of this research enable us to propose strategic policies for countries with varying levels of carbon emissions.
Recommendations
Given the outcomes, the subsequent suggestions for policy are desirable:
(1) Establish stringent environmental regulations to ensure compliance across all industries, especially in the early stages of industrialization. Develop an efficient environmental monitoring system by increasing the number of enforcement personnel and utilizing modern monitoring technologies to ensure timely and effective oversight of polluting companies. Additionally, ensure transparency in the formulation and implementation of environmental policies, create mechanisms for public participation, and enhance the accountability of both government and businesses regarding environmental issues.
(2) Create a favorable investment environment by simplifying the approval process for foreign enterprises, providing tax incentives, and implementing investment protection policies to attract foreign companies to the domestic market. Encourage foreign enterprises to introduce advanced green technologies and management practices, fostering collaboration between domestic and foreign companies to improve production efficiency and environmental sustainability. Establish special funds and financial instruments to support and promote foreign investment in green energy, environmental technology, and sustainable development projects.
(3) Encourage foreign direct investment, especially those that improve environmental technology and energy efficiency. At the same time, technology transfer should be enhanced through international cooperation to help developing countries upgrade their environmental management capacity. It should also strengthen the effective management of natural resource rents to avoid over-reliance on natural resource industries with high carbon emissions. Regulate resource exploitation through the imposition of carbon and resource taxes to encourage the sustainable use of natural resources. Support the development of high-tech and service industries by providing research and development subsidies and tax reductions to facilitate industrial transformation and upgrading. Utilize economic incentives and administrative measures to expedite the elimination of high-energy consumption and high-emission outdated capacities, promoting the transition of traditional manufacturing industries towards greener and smarter operations. Promote clean production technologies and encourage enterprises to adopt energy-saving and emission-reducing techniques to reduce carbon emissions during the production process.
(4) Enhance the management of natural resources to avoid over-reliance on resource extraction-based economies and promote sustainable and efficient resource utilization. Implement stringent resource extraction permit systems to control the total amount of resource extraction and minimize environmental damage. Encourage enterprises to adopt advanced resource utilization technologies to improve efficiency and reduce waste. Support the resource recycling industry and promote resource circulation to reduce dependence on primary resources and lower carbon emissions.
(5) Develop differentiated environmental policies based on the specific conditions of various regions, with a focus on strengthening environmental protection efforts in high-carbon-emission areas to promote regional coordinated development. Provide more policy support and financial security to local governments to ensure the effective implementation of environmental policies at the local level. Establish a comprehensive environmental monitoring and evaluation system to regularly assess the effectiveness of environmental policies and promptly adjust and improve policy measures.
Research Limitations and Future Prospects
The scope of this study considers only a few variables in assessing the impact of institutional quality and economic complexity on carbon emissions. Future research could extend the model by including human capital or the digital economy. In addition, regional-level and product-level analyses would help to obtain more precise policy implications.
Authors’ Contributions
This work was done collaboratively by all authors. Author Ruixi Yuan designed the study, performed the data collection, statistical analysis, wrote the protocol, and wrote the first draft of the manuscript. Author Tajul Ariffin Masron was responsible for the literature search and literature management, author Pengzhen Liu edited the references and formatting changes, Author Congqi Wang suggested changes to the paper and contributed as corresponding author. All authors read and approved the final manuscript.

