

Introduction
Rapid urban development in China has led to the fast expansion of urban land, soaring population density, and excessive consumption of natural resources, exerting immense pressure on city ecosystems. The sustainable provision of high-level welfare within a restricted ecological scope is a core factor in sustainable development and ecological civilization construction. Currently, there is abundant research on ecological welfare performance; however, there is a lack of evaluation and spatial evolution research on ecological welfare performance in Guangdong Province. As one of China’s most developed economies and most urbanized areas, this province plays a leading role in national economic growth. The Guangdong– Hong Kong-Macao Greater Bay Area has a robust economy, ample innovation resources, and a developed market economy, making it one of China’s most open and dynamic areas. However, with the rapid economic growth, the acceleration of spatial expansion has brought about resource shortages, ecological imbalances, environmental degradation, and many other problems. Economic development and ecological welfare enhancement have created an irreconcilable contradiction. In January 2023, the Guangdong Provincial Government’s Work Report proposed to highlight the leading role of the “Green and Beautiful Guangdong”, improve the level of ecological civilization construction, and build a showcase of Guangdong for a beautiful China, so that more and more people can enjoy ecological welfare by opening their windows. In recent years, Guangdong has been steadily promoting ecological environmental governance, and the quality of the ecological environment has changed dramatically. However, the pressure on protecting ecological civilization in Guangdong Province has not yet been fundamentally alleviated, and there is still a certain distance from people’s growing need for a beautiful ecological environment. Therefore, this study focuses on the following four research questions: 1. How did Guangdong Province perform regarding ecological welfare level? 2. Did the rough development in the past put development pressure on the local resources and environment? 3. How to coordinate the rapid development of industrialization and urbanization with the ecological environment? And 4. How to achieve high-quality development of the ecological environment along with high-quality economic development? Existing literature could not answer this question. Based on this, this paper combines domestic and international research results to construct a comprehensive, scientific, and rational evaluation system for the ecological welfare performance of Guangdong Province from economic, social, and environmental dimensions. This paper utilizes GIS technology to spatially analyze the ecological welfare performance of cities in Guangdong Province and reveals their spatial distribution characteristics and evolutionary trends. By comparing and analyzing the differences in ecological welfare performance across different cities, this study explores the main factors affecting the differences in ecological welfare performance across Guangdong Province and offers grounds for policy formulation. Finally, a series of targeted policy recommendations are proposed to facilitate the enhancement of ecological welfare performance and sustainable economic development in Guangdong Province, given the actual situation of the province.
In this study, we validated Guangdong’s two-stage dynamic ecological welfare performance using the Dynamic Network Data Envelopment Analysis Method proposed by Tone and Tsutsui in 2014. The rest of the paper is structured as follows: Section 2 reviewed the existing literature on the connotation of eco-welfare performance and the measurement of eco-welfare performance. Section 3 introduced the dynamic network slacks-based measure model and the Dagum Gini coefficient. In Section 4, we introduced the research area and constructed the indicator system of eco-welfare performance. In Sections 5 and 6, we presented the empirical results and discussion. Section 7 presents conclusions and policy implications.
Literature Review
Essence of Ecological Welfare Performance
The process of transforming natural ecological elements into human welfare reflects the interaction between the natural ecosystem and social and economic systems. As a tool for measuring the efficiency of transformation, ecological welfare performance has gradually gained prominence in research. Schaltegger and Sturm [1] introduced the notion of ecological efficiency, linking the rate of economic value addition during a certain period to increased ecological environmental load.
Ecological efficiency emphasizes the connection between economic growth, resource utilization, and environmental pollution control. As the economy and society prosper, people’s focus is no longer limited to economic growth and instead extends to the efficiency of the transformation of natural consumption into welfare [2]. Daly [3] proposed the notion of ecological welfare performance, which was regarded as a crucial means for measuring sustainable social and economic development. Subsequently, Zhu and Zhang [4] deepened the meaning of ecological welfare performance as the minimization of natural consumption while maximizing social welfare. As further research has been conducted, ecological welfare performance has expanded to include the economy, society, and environment.
Ecological welfare performance, which refers to the efficiency of natural resources and the transformation of ecological inputs into human welfare, allows the assessment of sustainable development capacity as well as the relationship between human welfare and ecosystem services [5]. Ecological welfare evaluation can be utilized to determine the health of economic growth. The main difference between ecological welfare performance and ecological efficiency is that the former refers to the ecological efficiency that enhances human happiness, while the latter generally corresponds to economic output.
Measurement of Ecological Welfare Performance
Regarding the measurement of ecological welfare performance, there are currently three main methods in the academic community. The first measurement approach is the comparative value method. For instance, through the happy planet index [6], the rate of per capita life satisfaction to ecological footprint per capita [7], the rate of per capita life expectancy to ecological footprint [8, 9], and the application of the ratio of the human development index to ecological footprint [10-13] are utilized to estimate ecological health. The comparative value method is not widely used to gauge ecological welfare performance because ecological footprint data are difficult to obtain. Therefore, the comparative value method is only applicable at the national scale in the measurement of the performance of ecological welfare but is not suitable for measurement at the regional, provincial, and urban levels. Moreover, the comparative value method consists of a single indicator algorithm; however, a city is a complicated ecosystem comprising multiple outputs and inputs; consequently, the comparative value method does not conform to scientific objectivity [14].
The second method is the Stochastic Frontier Approach (SFA) measurement technique [15-19]. SFA is a parameter and a deterministic method that is based on sound economic theory. The specific form of the production function should be determined ahead of time, making the model’s basic assumptions complex and difficult to extend [20-22]. Moreover, the requirements for input and output data are high. For multiple-output situations, the SFA model needs to be processed through distance functions or by combining multiple outputs into a comprehensive output, which does not correspond to scientific objectivity [23, 24].
The third method is Data Envelopment Analysis (DEA) measurement [5, 25-29]. As a non-parametric and uncertain method, DEA only requires known input– output data, and there is no need to consider the specific form of the production frontier [30-32]. DEA not only avoids the subjective operation of setting functions and weights but also makes a model easy to extend and provides accurate and objective estimation results. DEA can also directly deal with multi-output systems, making the evaluation results objective and accurate; thus, DEA has become the preferred method for measuring innovation efficiency [33-35].
Scholars have conducted measurements of ecological welfare performance at various levels, including between countries, regions, provinces, and cities. For instance, Long [36] utilized cross-sectional data from multiple countries to perform international comparative studies. Moreover, Bian et al. [37] compared the ecological welfare performance of 278 Chinese cities. Further, He et al. [38] analyzed the year-by-year eco-welfare development performance of cities in Jiangsu Province, while Bian et al. [39] measured the same performance for major cities located along the Belt and Road Initiative. Furthermore, based on the level of measurement, scholars have explored the temporal evolution in ecological welfare [40-42] and spatial distribution features [43, 44]. Researchers have also studied various elements affecting ecological welfare, including green credit [45], foreign investment [46], and city size [47].
The Flaws of Existing Literature
We found several gaps in the literature. First, scholars have not studied eco-welfare performance in particular stages in detail and have not performed a sufficiently in-depth examination of the impact of each stage of ecological welfare performance. Additionally, most studies on ecological welfare performance are static analyses that overlook the continuity of the periods under study, even though the sub-stages of ecological welfare performance are interrelated and are composed of stages of ecological resource utilization and economic welfare transformation. Moreover, the realization of ecological welfare performance is a dynamic process that lasts several years, with government policies, urban development, and industrial pollution control being continuously implemented. Finally, previous explorations of ecological welfare performance investigated the national and provincial levels, with scant explorations of cities’ ecological welfare performance being performed for Guangdong Province, which is one of the earliest developed regions in China as well as a gateway to the Asia-Pacific region [48]. In the past 45 years of growth and rapid urban expansion, Guangdong Province has achieved a high level of urbanization, and the Guangdong–Hong Kong– Macao Greater Bay Area is likely to serve as a global hub of technology and science innovation as well as an important nursery for infant industries [49]. There are significant differences in the levels of economic development, industrial development, industrial green transformation, urbanization development, and social welfare development among cities in Guangdong Province [50]. This study applies the dynamic network slacks-based measure approach, examining both the network structure and dynamic features of ecological welfare performance. Conducting research on ecological welfare performance in Guangdong Province can help in the identification of deficiencies in ecological welfare development in various cities, which can be used to enhance development performance.
Research Methods
Dynamic Network SBM Model
Traditional DEA models only focus on output and input variables located at the two ends of production activities, but ignore the connectivity factors that are usually in the form of intermediate products between organizational departments. The network DEA model opens the “black box” of internal production activities in DMUs by successfully measuring departmental efficiency. This study applies the dynamic network SBM, examining both the network structure and dynamic features of ecological welfare performance [51]. Färe et al. [51] put forward a model of network DEA analysis that views the production as being composed of multiple sub-decision units of production technology and solves the optimal value using the traditional models BCC and CCR. Unlike the traditional DEA model, which looks at production technology as a black box that cannot be assessed, the DEA explores the effect of intermediate variables and input allocation on the procedure of production. Tone and Tsutsui [52] integrate the weighted SBM with the Network to construct the Network SBM. Regarding the measurement of cross-period efficiency changes, Färe and Grosskopf [53] put forward a dynamic DEA model that was the first to incorporate cross-period activity factors in the measurement of dynamic efficiency. Further, Tone and Tsutsui [54] applied the SBM to the dynamic DEA, classifying fast-moving activity variables into 4 scales: good, bad, freely disposable, and non-freely disposable. The researchers established a non-radial, non-angular dynamic SBM model. To enhance the evaluation of dynamic shifts in departmental efficiency, Tone and Tsutsui [55] connected DSBM with NSBM, examining both connectivity variables and cross-period activity factors and establishing a dynamic network SBM.
We assume there are n DMUs(o = 1, ..., n), k stages (k = 1, ..., K), and T time (t = 1, ..., T), and that every DMU has its own output and input items at each time t and is connected to the next time t+1 by the carry-over. We use mk and rk to represent the input and the output at each k stage, respectively, with (k,h)i representing the division set from k to h, and Lhk serving as the division set of k and h. The definitions of output items, input items, links, and carry-over are as follows:
Inputs and Outputs
In the expression
Links
Carry-Overs
Other Variables
where Wt(t = 1, ..., T) represents the weight for period t and Wk(t = 1, ..., k) represents the weight for Division k.
As every DMU in the group frontier singles out the most proper ultimate weighted output, the efficiencies of D MU in the frontier are calculated by the equations below:
(1) The objective function
General efficiency:
(1)
with
Subject to the following resource production stage:
where
In the social welfare stage:
where
where
(2) Period and division efficiencies
The efficiencies are calculated as follows:
(1) Period efficiency:
(12)
(2) Division efficiency:
(13)
(3) Division period efficiency:
(14)
The aforementioned results show the general, division, period, and division–period efficiencies.
Dagum Gini Coefficient
Unlike the case for the traditional Gini coefficient and the Theil index, between measurement results and practical values of the Dagum Gini coefficient, the variance becomes smaller as the sample size increases. Additionally, the Dagum Gini coefficient can identify non-linear relationships between indicators and is robust against computing errors. The general Gini coefficient is the sum of the inter-regional, regional, and super-variety density Gini coefficients. The measurement process involved is as follows:
where G denotes the overall Gini coefficient; k represents the number of regions that are divided; n is the total number of cities; nj and nh represent the number of provinces in region j and region h, respectively; θji denotes the ecological welfare performance of the ith city in area j; θhr denotes the performance of ecological welfare of the rth city in area h; μ represents the value of all cities’ ecological welfare performance on average; Gji represents the Gini coefficient of area j; Gjh denotes the Gini coefficient between areas j and h; Djh denotes the relative impact of ecological welfare performance between areas j and h; djh denotes the difference in ecological welfare performance between areas, viz., the expected total value of the sample values of all θji – θhr>0 in areas j and h; pjh denotes the hypervariable first-order moments, representing the expected value of the total value of the sample values of all θhr – θji>0 in areas j and h; and F represents the cumulative probability density function of the regions’ ecological welfare performance.
Research and Data Methodology
Overview of the Research Area
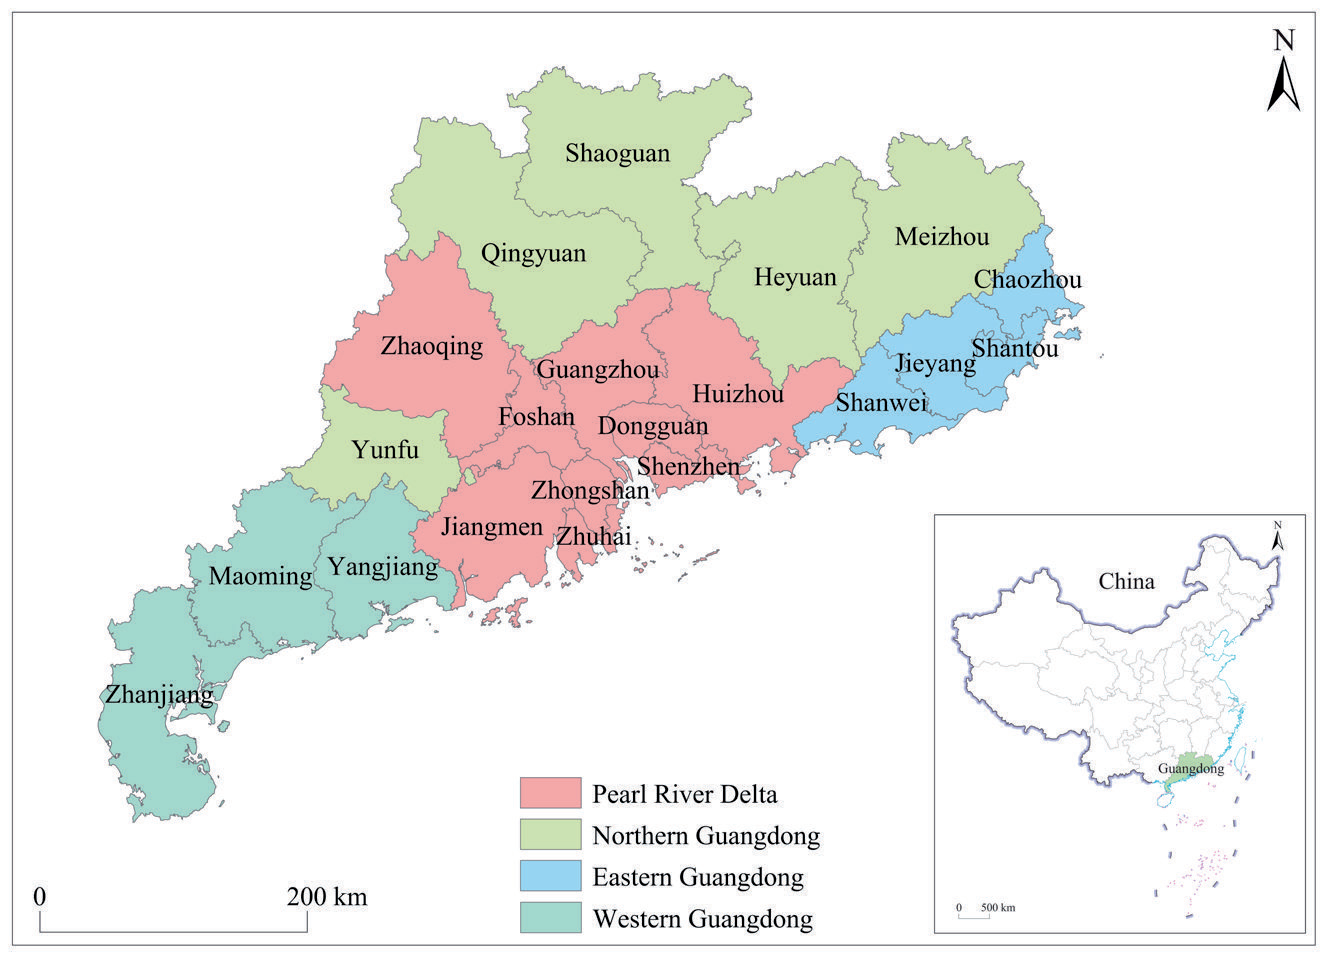
Situated in China’s southernmost region, Guangdong Province, which borders Macao and Hong Kong, has an area of approximately 179,800 square kilometers that was occupied by about 127 million people in 2021. The province has 21 prefectural cities that are categorized based on their differences in economic development and natural situations into four areas: the Pearl River Delta, Eastern Guangdong, Western Guangdong, and Northern Guangdong (Fig. 1). The Pearl River Delta has nine cities at the prefecture level (Shenzhen, Guangzhou, Dongguan, Foshan, Jiangmen, Zhuhai, Zhongshan, Huizhou, and Zhaoqing), Eastern Guangdong has four prefectural cities (Shanwei, Jieyang, Shantou, and Chaozhou), Western Guangdong has three prefectural cities (Maoming, Yangjiang, and Zhanjiang), and Northern Guangdong contains five prefectural cities (Meizhou, Shaoguan, Yunfu, Heyuan, and Qingyuan). Since the initiation of reforms and the economic opening-up of China, Guangdong Province has vigorously developed its manufacturing industry, with industrialization and urbanization being promoted intensively. As a result, the regional GDP growth rate has become among the top in the nation. However, high energy and resource consumption have increased pollution, unbalancing systems in the ecological environment. Secondly, there are significant differences in the rate of growth of various cities and regions in the province. The GDP of Guangzhou, Shenzhen, Foshan, and Dongguan, which have a relatively diversified industrial structure, exceeded one trillion yuan in 2022. However, the per capita regional GDP of cities in Northern, Western, and Eastern Guangdong, which have a relatively undiversified industrial structure, is still lower than the national average. Different areas in the province primarily specialize in one major economic activity. Western and Northern Guangdong are important agricultural production areas, while the Delta region serves as the main urban and industrial center. Therefore, there are substantial differences in both the magnitude of development and the primary economic activities of different areas in Guangdong Province, which correspond to regional variances in ecological welfare performance.
Construction of an Ecological Welfare Performance Indicator System
This study divides urban ecological welfare performance into two stages (see Fig. 2). The first stage, referred to as the resource production stage, represents the conversion of ecological input efficiency into economic output. The second stage, referred to as the social welfare stage, represents the transformation of economic input efficiency into welfare output while incorporating quasi-fixed input variables to connect different periods. This research makes use of the study results from Feng et al. [56], Li [57], Bai et al. [58], and Teng et al. [46], utilizing resource input as an input indicator in the resource production stage and employing both pollution output and economic growth as output indicators for the resource production stage. In addition, economic growth and government input are used as input indicators for the social welfare stage, while resident income, health care, and education development are used as output indicators in the social welfare stage.
In the resource production stage, water resources, land resources, and energy consumption are selected as input variables [59–61]. In this study, energy consumption per capita [46], total water use per capita [62], and built-up region per capita [63] are used to represent energy consumption, water resources, and land resources, respectively. The choice of output variables was influenced by the high likelihood of emissions of specific pollutants in areas that experience urban socioeconomic growth, particularly with an increase in the urban population. In such areas, life pollution emissions such as automobile exhaust and household waste are likely to exert specific pressures on the urban ecosystem. Taking into consideration data availability, this study utilizes per capita sewage discharge [64], per capita industrial sulfur dioxide emission [65], and per capita urban domestic waste collection [66] to represent the output of solid waste, exhaust gas, and wastewater, respectively. In addition, economic output is taken as an intermediate variable indicator that is represented by GDP per capita [67, 68].
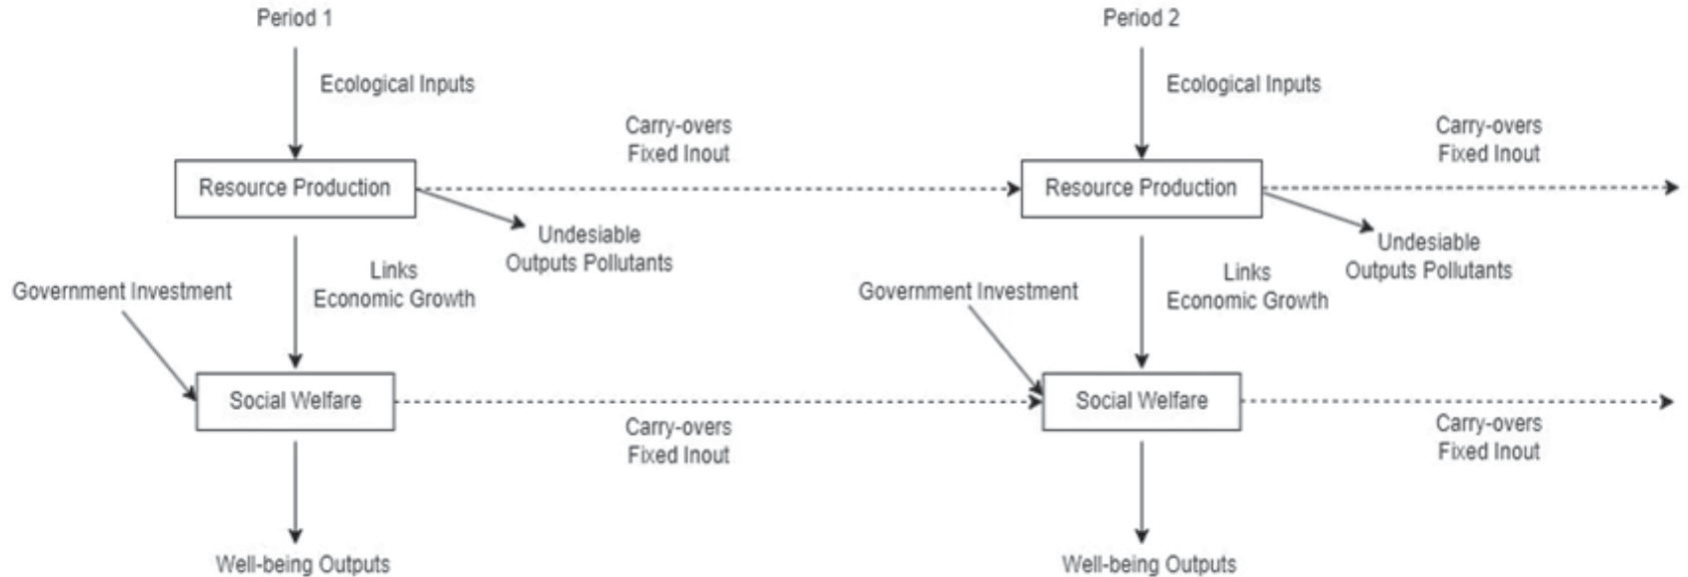
In the social welfare stage, in addition to GDP per capita, this article employs the local public budget expenditure per capita to represent government input as an input variable [69]. The output indicators are mainly selected based on a consideration of the ultimate purpose of urban sustainable growth, which is defined as giving a high degree of comprehensive welfare to an urban population within an ecological threshold. The provision of comprehensive welfare is examined through three major aspects: education development, health care, and resident income [70, 71]. This study utilizes years of education per capita, disposable income per capita, and capital stock per capita to represent education development, resident income, and health care, respectively [72]. Capital stock per capita is taken as a quasi-fixed input variable representing government fixed investment [73]. Table 1 shows the indicator system employed in the evaluation of ecological welfare performance.
Table 1.
Indicator system of ecological welfare performance.
Table 2.
Indicators of input and output descriptive statistics.
Data Processing and Description
This study investigated 21 cities in Guangdong Province as research units, categorizing them into 4 regions based on existing administrative divisions. The regions are Delta, Western, Eastern, and Northern. The research duration spanning 2017-2021 was selected after considering the suitability of regional economic outcomes and data availability. The data for the evaluation indicator system was primarily obtained from the statistical yearbooks of various cities, including the China Urban Statistical Yearbook, Guangdong Statistical Yearbook, and China Urban Construction Statistical Yearbook, as well as statistical bulletins on national, social, and economic growth and statistical bulletins on the water resources of various cities. Because most cities did not include data on average life expectancy in their statistical yearbooks, data on this factor was obtained from relevant health statistics bulletins from each city. This study applied a calculation method for average years of education from the 2013 China Human Development Report. To reduce the impact of extreme values on research results, all indicators were processed using per capita values, and economic data were adjusted based on 2015 values. In addition, interpolation was used to supplement missing data on individual indicators for some years. Table 2 presents descriptive statistical data for output and input variables, as well as linkage and carryover variables.
Empirical Analysis
Overall Spatial Features of the Performance of Ecological Welfare
In this study, Max DEA software was used to assess the ecological welfare performance of 21 cities in Guangdong Province from 2017 to 2021, with the analysis employing the dynamic network SBM model. DEA efficiency values are categorized as less than 1 and equal to 1. DMUs with an efficiency value of less than 1 are “Non-DEA Effective,” and DMUs with an efficiency value equal to 1 are “DEA Effective.” Table 3 presents the overall as well as the periodical ecological welfare performance levels of these 21 cities, showing that the scores of individual efficiencies associated with general ecological welfare performance ranged from 0.3773 to 1. The overall performance of the 21 cities was relatively low, with an average comprehensive efficiency of 0.614, which is less than one, indicating that it had not reached a suitable ecological welfare performance level. The ranking of overall efficiency revealed that the cities of Jieyang, Foshan, and Shanwei are in the top three, while Qingyuan, Zhuhai, and Shaoguan are in the bottom three.
To enhance the explanatory power of this study’s results, we used ArcGIS 10.5 software and the natural break point classification approach, creating a distribution map of the overall ecological welfare performance of Guangdong’s cities at the prefecture level from 2017 to 2021 (Fig. 3). First, we found that the spatial distribution of Guangdong Province’s current ecological welfare performance was uneven, with a spatial mismatch between ecological welfare performance and economic growth. The ecological welfare performance rankings for underdeveloped areas such as Jieyang, Shanwei, Maoming, and Yunfu were higher, while those of relatively developed areas like Zhuhai, Huizhou, and Shenzhen were lower. The mean ecological welfare performance of the Pearl River Delta area, which has a relatively developed economy, was 0.5982, making it third in rank among the four regions. This may be attributable to economic growth that has led to rising housing prices, scarce social resources, and a higher cost of living, which have reduced the city’s ecological welfare and created a “high economic development, high resource consumption, low growth in happiness” pattern. However, there are also exceptions such as Foshan and Zhongshan in the Pearl River Delta area, which have higher ecological welfare performance rankings. This result highlights the necessity for ameliorating resource utilization and pollution control efficiency, upgrading the quality of living environments, and reinforcing citizens’ sense of happiness. Second, there was substantial variance in ecological welfare performance among cities in the Northern, Western, and Eastern Guangdong regions, with the highest–ranked cities being mixed in with those ranked lowest in performance.
Fig. 3.
Spatial features of ecological welfare performance of 21 Guangdong cities (overall efficiency).
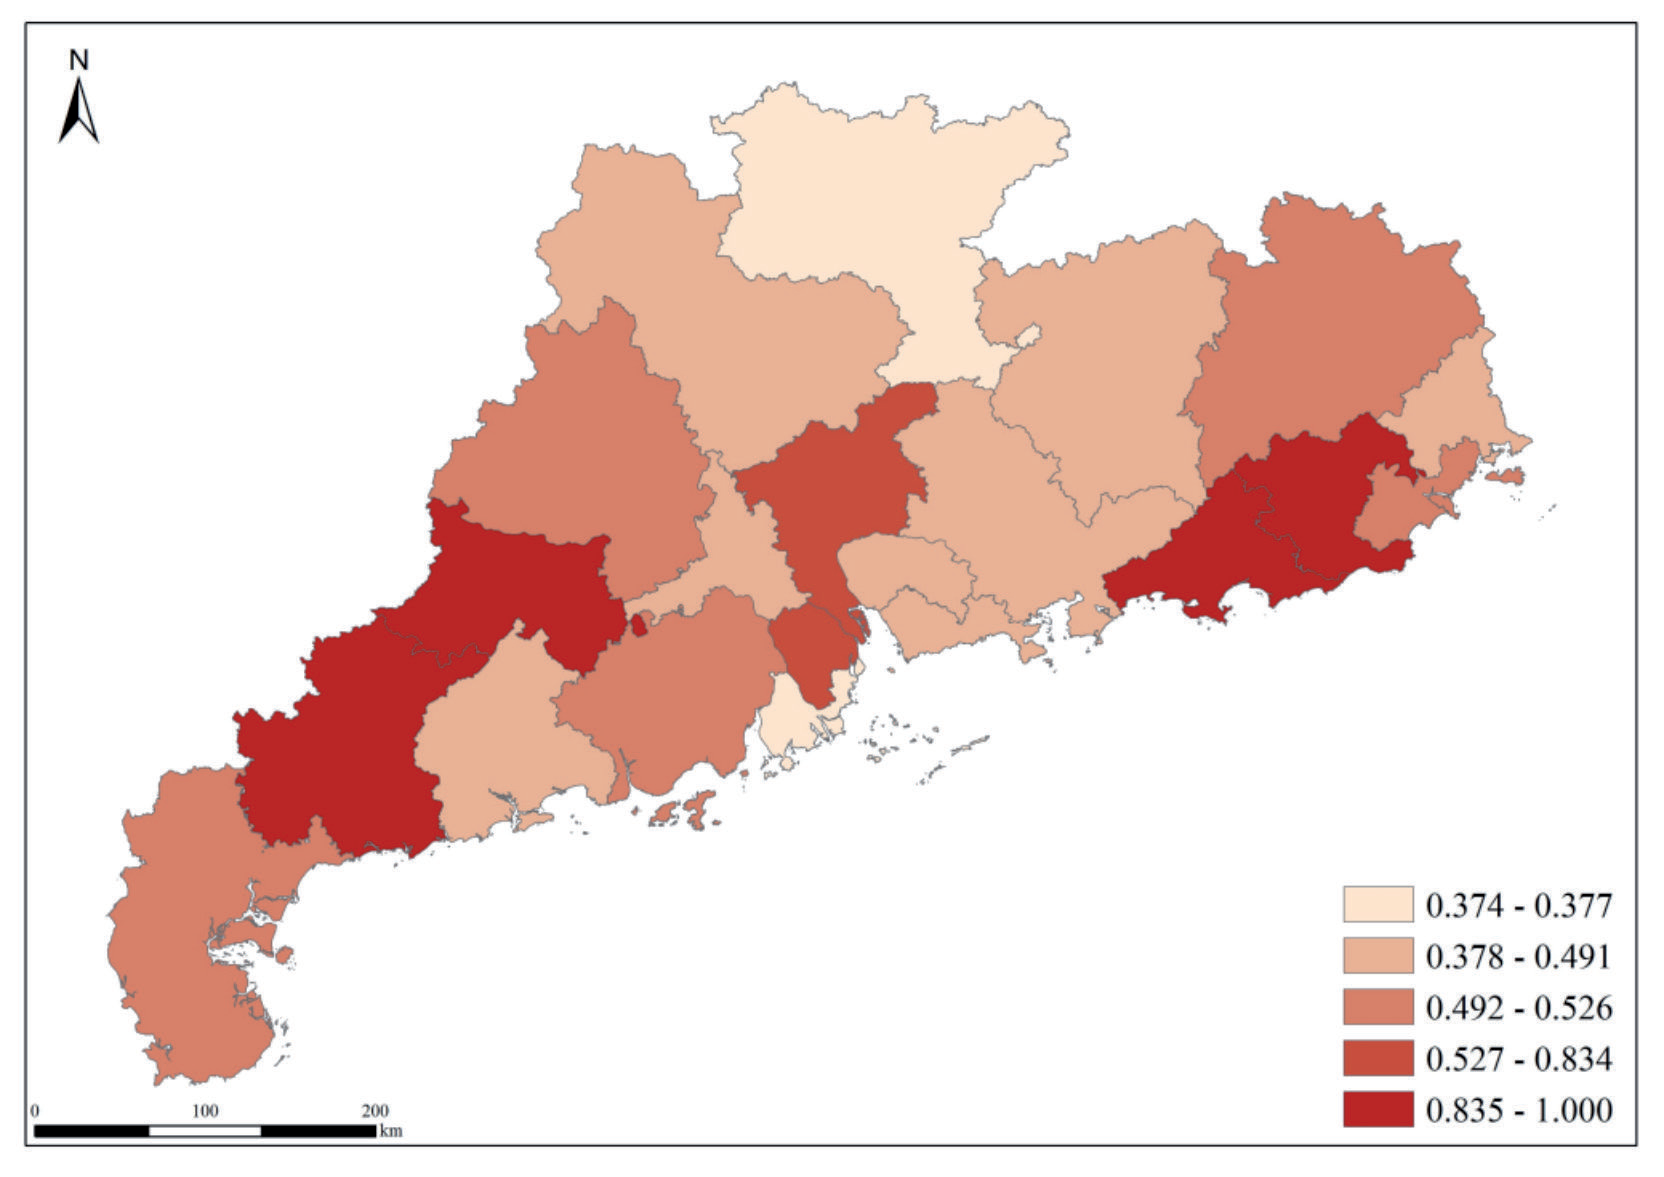
The performance rankings of Foshan, Zhongshan, and Guangzhou in the Delta region were high, but their overall ecological welfare performance was not high, providing evidence for ongoing urbanization and industrialization in the Delta.
Temporal Evolution of Overall Ecological Welfare Performance
This section discusses the ecological welfare scores for various regions across time. First, Table 3 shows that the overall outcome of each region was not the arithmetic average of the areas for the period 2017 to 2021, with the overall value generally lower than the average value for these five years. Second, except for Jieyang, Foshan, Shanwei, Maoming, Yunfu, and Guangzhou, other cities’ efficiency values in each period equaled or exceeded their overall efficiency value. For example, Jieyang had an overall efficiency score of one, and it had the same score for each period from 2017 to 2021. In comparison, Foshan’s ecological welfare efficiency exceeded the overall efficiency value in the early period but was lower in the later stage. Third, except for 2017, the overall efficiency rankings of cities in Guangdong Province are consistent with the cycle of efficiency rankings. The top five and bottom five cities in rankings of overall efficiency were the same as those in 2017. However, the ranks of cities in the middle ranks of overall efficiency changed substantially in 2017; for instance, Shenzhen ranked 16th in overall efficiency, but ranked 10th in 2017.
Fig. 4 shows there was considerable variance in ecological welfare performance within Guangdong Province from 2017 to 2021, with the best ecological welfare performance being observed in the eastern region, followed by the western and Delta regions, while the northern region had the worst performance. Although the Delta, northern, eastern, and western regions had relatively consistent overall ecological welfare performance, there were slight fluctuations. In addition, the mean ecological welfare performance of Guangdong Province fluctuated, with an initial rise being followed by a subsequent fall in performance. Thus, the region’s ecological welfare performance can be roughly categorized into two stages. The first stage spans from 2017 to 2019, during which ecological welfare performance increased consistently from 0.6722 to 0.6975. Since 2017, the People’s Government of Guangdong Province has made it a key priority for the government by enhancing the integration level of the Pearl River Delta region, advancing the integrated development of the Pearl River Delta region with eastern, northern, and western parts of Guangdong, and facilitating the construction of the Pearl River Delta National Green Development Demonstration Zone. In this context, the regional collaboration and development levels of Guangdong Province have increased, and economic development has become more efficient. Driven by a series of policies, such as Focusing on Energy Saving, Emission Reduction, and Carbon Reduction to Strengthen Ecological Construction, Guangdong Province has stepped up its efforts in ecological environmental protection. The fruit of green and low-carbon development was shown, and people’s well-being continued to improve. At the same time, the economy almost stagnated due to the outbreak of the Covid-19 pandemic. Guangdong Province has reduced emissions from industrial, mobile, and dust sources. The significant reductions in these sources have contributed to a substantial improvement in air quality [74]. Carbon emissions rebounded with economic recovery after the pandemic. The economic recovery period after the pandemic caused air pollution indicators to rebound in many parts of Guangdong Province [75, 76]. At the same time, with economic development and the improvement of the urbanization level, the urban population has increased, resulting in a tension in resources such as health care, education, and housing, which impacts the residents’ sense of happiness. Consequently, the ecological welfare performance of Guangdong Province declined from 2019 to 2021.
Table 3.
Ecological welfare performance of 21 cities in Guangdong.
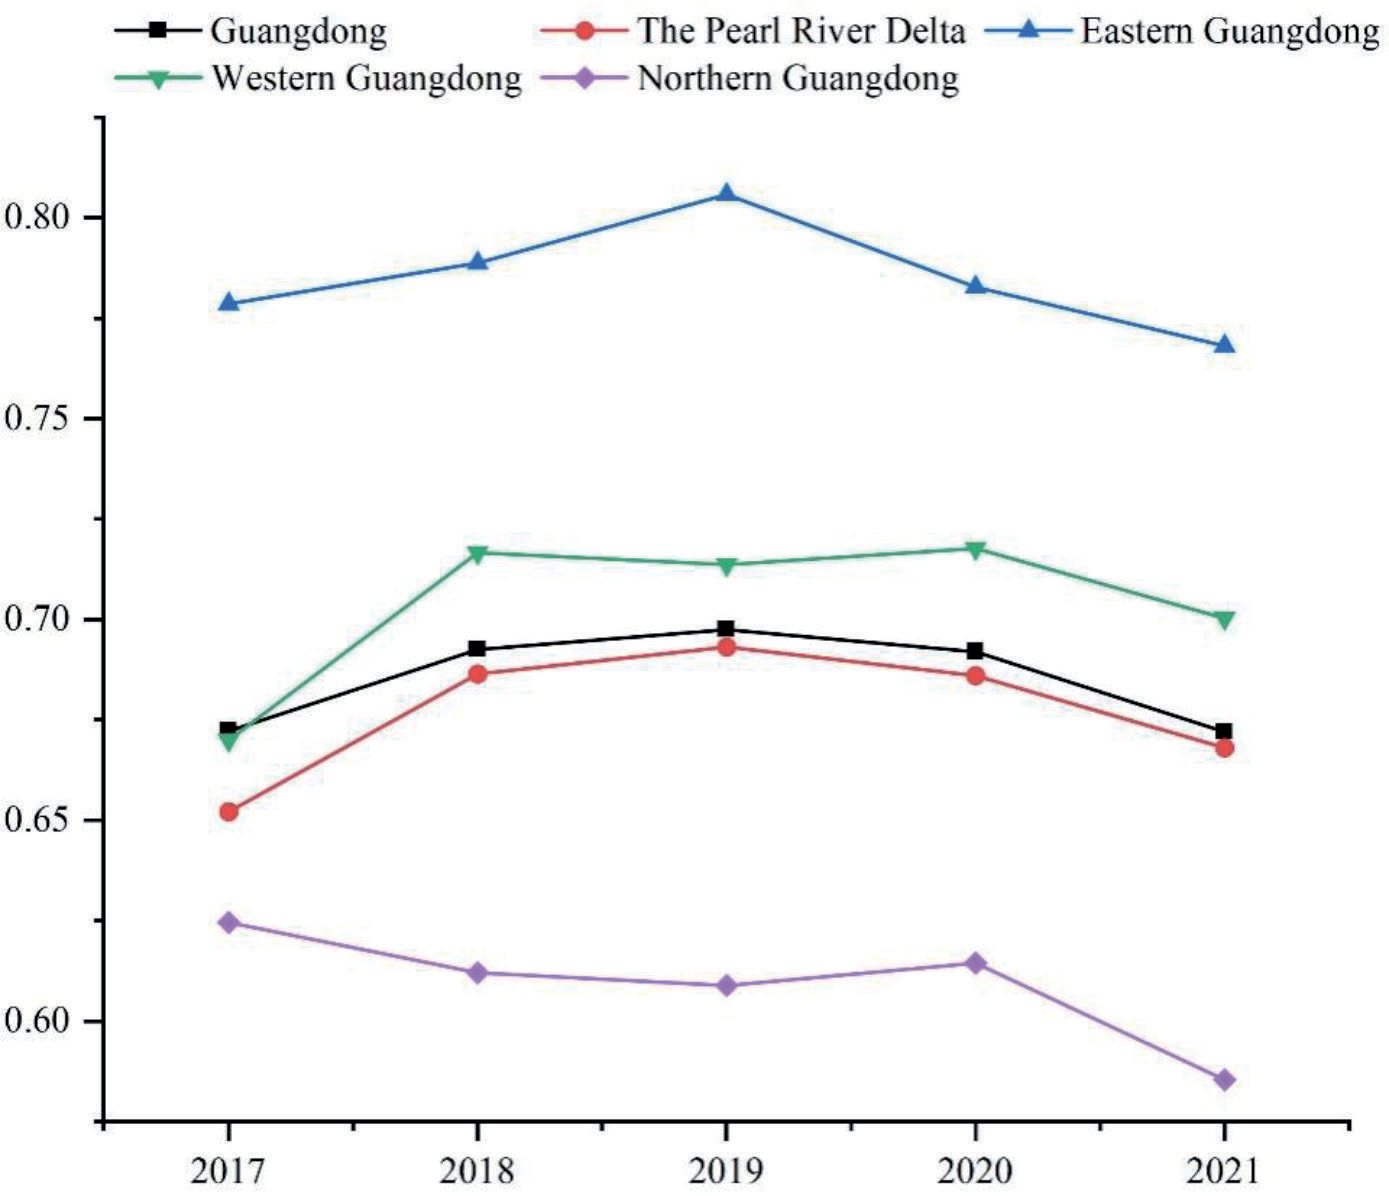
Table 4.
The resource production efficiency of 21 cities in the province (2017-2021).
Spatiotemporal Distribution of Substructure Scores of Ecological Welfare Performance
Table 4 and Table 5 show the distribution of overall as well as cross-period resource production efficiency and economic welfare efficiency scores of 21 cities in Guangdong Province from 2017 to 2021. First, the results on overall resource production efficiency and economic welfare efficiency indicate there was a large difference in individual scores of overall resource production efficiency and economic welfare efficiency, with the lowest overall values of resource production and economic welfare efficiencies being 0.2215 and 0.3205, respectively. Overall resource production and economic welfare efficiency in the region needed to be improved by at least 77.85% and 67.95%, respectively, to match the efficiencies of effective provinces. Second, the overall economic welfare efficiency of Guangdong Province was 0.7956, which was higher than the overall mean resource production efficiency score of 0.5750. Overall, the economic welfare efficiency performance of cities in Guangdong Province was relatively good. Third, economically developed regions exhibited variances in resource production efficiency and economic welfare efficiency scores. The Pearl River Delta area, which has a developed economy, had an overall mean resource ecological efficiency score of 0.6299, exceeding those of the western (0.6409) and northern (0.6299) regions. However, the Delta region had an overall mean economic welfare efficiency score of 0.7132, which was less than those of the eastern (0.9091), northern (0.8355), and western (0.8231) regions. Due to the high level of technological innovation in the Delta area, the ecological efficiency of cities in the area has improved, and the quality of the ecological environment has been continuously improved. However, problems such as soaring housing prices, traffic congestion, and scarce public resources, which are associated with rapid urban development, are likely to have reduced the sense of happiness of urban residents.
During the entire research period, only Jieyang City exhibited high efficiencies in DEA effectiveness in both stages. Other cities did not have balanced economic, ecological, and welfare developments during the research period. Most of the examined cities, including Guangzhou, Shenzhen, Foshan, Shanwei, Maoming, and Yunfu, exhibited high efficiencies in resource production but low economic welfare efficiencies, which resulted in reduced overall ecological welfare performance. This result indicates that although pollution prevention and waste management in these cities were ideal during the production stage and green economic growth had been achieved, more needed to be done to enhance the conversion of economic growth into social welfare. Thirteen cities, including Shantou, Heyuan, Shaoguan, Huizhou, Meizhou, Dongguan, Zhongshan, Jiangmen, Yangjiang, Zhaoqing, Qingyuan, Zhanjiang, and Chaozhou, had higher economic welfare efficiencies than resource ecological efficiencies. With low industrial levels, high resource consumption levels, and high pollution emissions, these cities had low resource ecological efficiencies and relatively low ecological welfare performance. Thus, it is crucial that their industrial pollution control levels are improved and industrial green transformation is promoted.
We compared the cross-period scores of resource production and economic welfare efficiencies for the 21 Guangdong cities. During the study period, seven cities exhibited high resource production efficiencies throughout all periods, registering values that were comparatively higher than those of four cities that had high economic welfare efficiencies throughout all periods, indicating that more cities had achieved high resource production efficiencies. Furthermore, we found that the range of economic welfare efficiency was relatively small (it did not exceed 0.3045) in the western, eastern, and northern regions. However, the economic welfare performance of cities in the Delta, which was as high as 0.7328, was notably different. In comparison, the ranges of resource production efficiencies in the four regions of the province, all of which exceeded 0.6475, were larger.
Using the natural breakpoint classification method, we divided the resource production efficiencies and economic welfare efficiencies of the 21 cities into 4 types and analyzed their spatial distribution from 2017 to 2021. As shown in Fig. 5, from 2017 to 2019, various cities in the northern and eastern regions exhibited low and relatively low resource production efficiencies, while cities in the Delta and western areas had relatively higher resource production efficiencies. In the same period, the resource production efficiencies of most regions fell before increasing, and cities with high resource production efficiencies remained dispersed. Overall, cities with low resource production efficiencies were primarily situated in the northern area, a finding that is likely to be attributable to the low specialization levels and technological efficiencies of the region’s industries, which had an impact on the region’s overall ecological efficiency. The number of cities with high resource production efficiencies was relatively stable, and they were relatively spatially dispersed. The green and low-carbon collaborative development effects between cities were insufficient, and the driving influence of cities with high resource production efficiencies on surrounding cities was observed to be weak.
Fig. 5.
The spatial pattern evolution of resource production efficiency in 21 cities in the province (2017-2021).
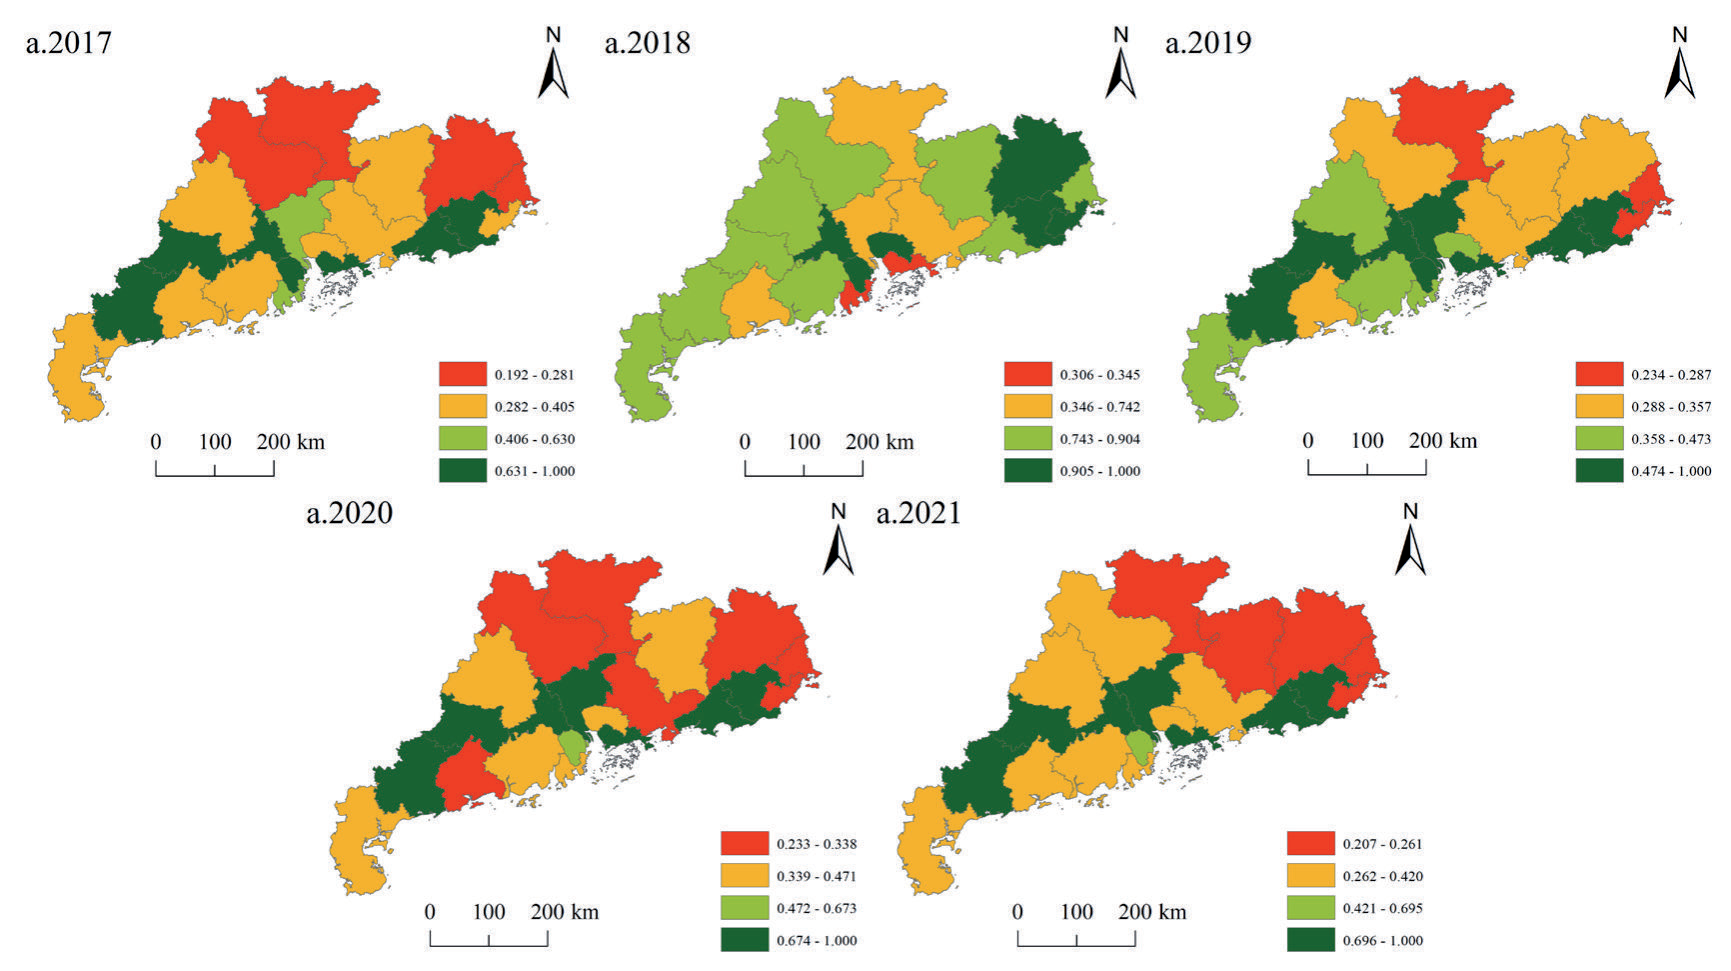
Fig. 6.
The spatial pattern evolution of economic welfare efficiency in 21 cities in the province (2017-2021).
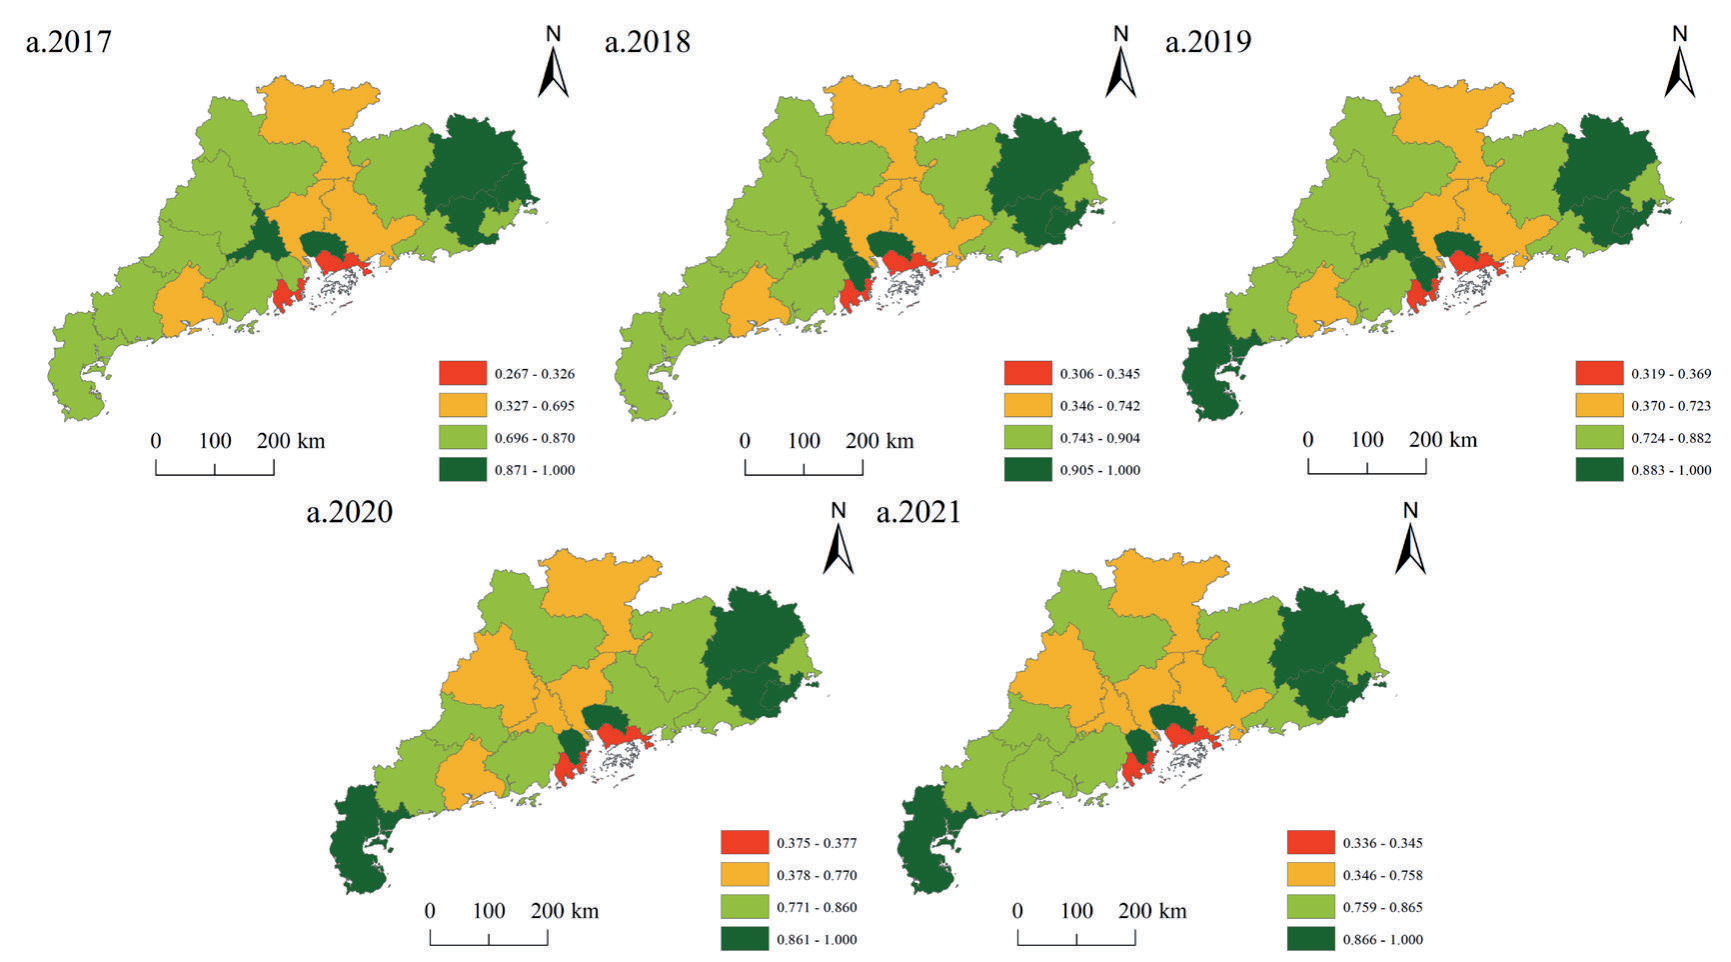
The spatial variation in economic welfare efficiencies in Guangdong Province is relatively apparent, exhibiting a “central low, east-west high” spatial pattern that changed minimally from 2017 to 2021 (Fig. 6). Most cities situated in the Delta region exhibited low levels of economic welfare efficiency, with cities that exhibited high efficiencies being encircled by those that exhibited low efficiencies. The economic welfare efficiency for the western region of Guangdong Province increased year by year, eventually reaching a high level of economic welfare efficiency for all examined cities by 2021. The pattern of the spatial distribution of economic welfare performance in the northern and eastern areas remained stable during the research period. With its developed economy, the Pearl River Delta region attracted large numbers of migrant workers, resulting in a dense population in the urban space that exerted significant pressure on social and public resources, which is likely to have affected the sense of happiness of the residents.
Analysis of Regional Differences in Ecological Welfare Performance
The above analysis revealed that the ecological welfare performance for Guangdong Province exhibited spatial non-uniformity, with the spatial non-uniform characteristics changing dynamically over time, whereby the performance in the northern areas and the Delta was generally lower than that in the eastern and western areas. This research applied the Dagum Gini coefficient method to investigate the different causes and factors contributing to variances in ecological welfare performance in specific areas in Guangdong Province.
Overall Regional Differences
Table 6 shows that the overall change in ecological welfare outcomes in Guangdong Province during the observation period involved a reverse M-shaped fluctuation. Specifically, the general Gini coefficient of ecological welfare performance in Guangdong exhibited a downward trend from 2017 to 2018, with the annual average value falling from 0.1439 to 0.1372. The annual average value increased from 2018 to 2019, reaching a peak of 0.1442 in 2019. Data obtained from various sources revealed that differences within the region decreased year by year from 2017, but rebounded slightly in 2020. The difference in ecological welfare performance scores between regions generally increased. From 2017 to 2018, the contribution of the ultra-density ratio fell significantly and then fluctuated downward. Regarding the magnitude of various factors’ contributions, the general change in ecological welfare performance was mainly influenced by the ultra-density ratio. The ultra-density ratio revealed the impact of the overlap between the differences between regions and those within the region on the overall Gini coefficient, indicating that the regional overlap effect had a greater impact on the ecological welfare performance of Guangdong Province. However, the interaction between the two factors had a substantially reduced impact on ecological welfare performance after 2017.
Table 5.
The economic welfare efficiency of the same cities.
Table 6.
Contribution rates of regional differences in performance of ecological welfare in Guangdong.
Regional Differences and Intra-Regional Differences
Table 6 shows that the overall trend of regional differences between the Delta and western regions, the Delta and eastern regions, and the eastern and western regions is similar, with changes in all the differences exhibiting an inverted M shape. The highest regional difference among the three regions was observed in 2017. Between the eastern and northern regions, the Delta and northern regions, and the western and northern regions, a pattern of “decline-rise-decline” was observed. The largest difference observed between the eastern and northern regions and the Delta and northern regions occurred in 2019, and the largest difference in the western and northern regions occurred in 2021. Throughout the research period, the highest average regional difference occurred between the eastern and northern regions (0.1730), followed by that between the Delta and eastern regions (0.1445), the western and northern regions (0.1437), the Delta and northern regions (0.1432), the eastern and western regions (0.1329), and the Delta and western regions (0.1247). The result indicates that regional differences in ecological welfare performance in Guangdong Province are mainly influenced by differences among the northern, eastern, Delta, and western regions. The inherent geographic disadvantage that is characterized by the statement “eight mountains, one water, one field” that applies to the northern region explains the difficulty involved in creating a high-density road network in the region as well as the slow speed and high cost of commodity circulation that limit the development of industry in northern Guangdong. The main industries in the northern Guangdong region are heavy industries, such as the production of non-ferrous metals and steel, which have significant economic benefits but are also associated with heavy pollution. The use of green processes and environmental contamination control in northern Guangdong’s industrial sector is relatively underdeveloped, resulting in a much lower degree of ecological welfare performance compared to other regions.
Table 7, which contains values on intra-regional differences, shows that variances in the ecological welfare performance in the western Guangdong and Pearl River Delta regions exhibited a narrowing pattern, while those in the northern and eastern regions exhibited a widening trend. During the research period, the largest intra-regional difference, which consisted of a mean value of 0.1393, was observed in the northern Guangdong region. The intra-regional differences between the Delta and eastern regions ranked second and third, respectively, while the western Guangdong region (which had a mean value of 0.1115) exhibited the smallest intra-regional difference. The five cities in the northern Guangdong region have significantly different characteristics, particularly regarding their economic foundation, functional positioning, and geographic location. For example, Shaoguan has abundant natural resources like metal and coal mines. Compared to the other four cities in northern Guangdong, Shaoguan has a more substantial industrial foundation and economic base. Qingyuan, which has the second-highest mileage of expressways in Guangdong Province, is adjacent to the three major cities of Guangzhou, Foshan, and Zhaoqing; consequently, its economic radiation effect in the Greater Bay Area is significant. In comparison, Yunfu, Heyuan, and Meizhou are mainly mountainous, and they have relatively underdeveloped transportation infrastructure and industrial levels that are far below the provincial average.
Table 7.
Regional differences and within-region performance of ecological welfare in Guangdong Province.
Conclusion and Policy Suggestions
Conclusion
Using data spanning 2017 to 2021 that was obtained from 21 prefectural cities in Guangdong Province, this study applied the dynamic network SBM model to investigate their ecological welfare performance, utilizing the Dagum Gini coefficient to identify the causes of differences in ecological welfare performance in the region and their respective impacts. The following major conclusions were drawn:
(1) The ecological welfare performance of the 21 cities was relatively low, with the cities exhibiting a pattern of unbalanced spatial distribution whereby economic growth and ecological welfare performance were spatially mismatched. Through time, the average ecological welfare performance in the province mainly fluctuated in a pattern where it first increased and then fell. This study identified significant variations in ecological welfare performance between regions and within regions in Guangdong Province.
(2) First, the scores of economic welfare efficiency and resource production efficiency for individual cities were significantly different, with the cities in Guangdong Province exhibiting higher economic welfare efficiencies. Second, economically developed regions exhibited variances in both their resource production and economic welfare efficiencies. The number of cities with high resource production efficiencies during all periods was greater than those with high economic welfare efficiencies during all periods. Cities with low resource production efficiencies were distributed in patches and were mainly located in the northern parts. The number of cities with high resource production efficiencies was relatively stable, with the spatial pattern of economic welfare efficiency exhibiting a “collapse in the middle and higher in the east and west” pattern that did not feature a significant overall trend.
(3) The overall variances in the ecological welfare performance in Guangdong Province are mainly attributable to the impact of ultra-high density, while the variations between regions are mostly attributable to the differences between the Delta and the northern, eastern, and western regions. Intra-regional variations in the ecological welfare performance of the Delta and western regions narrowed, while those in the northern and eastern areas widened.
Policy Suggestions
Based on this study’s findings, to enhance the ecological welfare performance of Guangdong Province, the following recommendations are offered:
(1) Improve ecological efficiency, raise welfare, and achieve sustainable development
Currently, the overall ecological welfare performance in Guangdong Province is not high, and the overall ecological welfare level of the examined 21 cities is relatively low. First, ecological efficiency in the region should be improved. Guangdong Province needs to improve its eco-efficiency. The Pearl River Delta (PRD) region and northern Guangdong are areas with low values. The Pearl River Delta region has a high proportion of chemical industries, which shows excessive water consumption and high pollution emissions. Industrial and energy restructuring should be accelerated. Second, welfare efficiency should be improved by improving education resources, elevating medical and health levels, and increasing per capita disposable income. Additionally, welfare efficiency should be improved by promoting industrial transfer and acceptance among cities as well as the circulation of resource factors (energy, talent, technology, funds, etc.).
(2) Strengthen weakly performing areas and enhance the integrated development of all regions
Currently, there are significant variations in ecological welfare performance among different areas in Guangdong Province. For example, the northern area was observed to have relatively low ecological welfare performance, indicating there is room for substantial improvements. The overall regional balanced growth should be strengthened, and development should be improved, aiming to develop the area “in a shared manner” between the northern, eastern, and western regions. The ecological welfare performance of the Delta was found to be worse than that of the eastern, western, and northern areas, a finding that may be attributable to the ecological investment factors in the region, particularly those that relate to resource consumption and environmental contamination, which have exerted substantial pressure on the ecological environment. The region should accelerate the creation of production and lifestyle approaches that are resource–saving and environmentally friendly. The Pearl River Delta needs to improve its governance strategies regarding reducing material consumption and maximizing welfare output by gradually optimizing processes to improve the conversion efficiency of natural consumption. To achieve the ultimate goal of improving welfare levels, the region should avoid excessive resource consumption in processes that improve the population’s welfare and gradually optimize a system that considers natural consumption as an input and welfare level as an output.
(3) Eliminate administrative barriers and pursue green development with regional integration as the main objective
Regional differences in development are attributable to variations among the Delta, eastern, northern, and western areas. By taking “the Delta region,” “western region,” “northern region,” and other regions as major targets for development, the province should eliminate administrative barriers and build high-quality green development joint regions.
Inspirations for Administrations
(1) Regional eco-efficiency does not improve correspondingly with economic development.
The current development model should be changed, factor utilization efficiency should be improved, and the main driving force of economic growth should be changed from the input of labor and resources to the input of innovation and capital. Furthermore, to achieve the desired effects, it would be prudent to restrict the development of heavy-polluting and high-consumption industries, increase the threshold for the admission of new high-consumption and heavy-polluting projects, reinforce the elimination of underdeveloped production capacity, accelerate the ecological transformation of high-consumption and heavy-polluting industries, and promote clean production and a circular economy. The region should also build a modern industrial platform that primarily features high-end manufacturing and advanced services, as well as apply cutting-edge technologies like artificial intelligence, 5G, and big data to urban governance.
(2) The government should strengthen overall regional coordination and development.
Regions that are highly developed should lead by providing resources and examples for driving development. Development can also be strengthened through integrated development among regions, particularly with regard to economic development, education, energy use, and medical care. Development can also be achieved by establishing regional cooperation docking mechanisms, forming a spatial feature on environmental protection and resource conservation, and promoting the overall ecological welfare and sustainable development performance of the province.
(3) Breaking down administrative boundaries and local trade barriers and improving government management efficiency can emphasize the spatial spillover effect from higher-ranking to lower-ranking cities in the same region.
The government should improve environmental regulations and laws, unify environmental supervision, improve law enforcement standards and efforts, develop effective economic incentive mechanisms, provide low-carbon lifestyle directives, and strictly protect and restore the ecology. The region should also strengthen the role of effective policies and enhance the effectiveness of regional social resource allocation.

