

Introduction
Vegetation plays a crucial role in the ecological environment, being influenced by atmospheric, hydrological, soil, and ecological conditions [1-3]. The Normal Difference Vegetation Index (NDVI) effectively characterizes vegetation coverage and exhibits changes corresponding to biomass and land use during the growing season [4, 5]. Since the 1980s, numerous studies have explored the relationship between NDVI and climate factors as well as human activities at both river basin and global scales [6-10].
From 1985 to 2015, the land vegetation in China showed an improvement trend of 0.5×10⁻³ per year, with a notable shift occurring around 1995. The negative correlation effect between NDVI and temperature was more pronounced in the alpine and arid regions in the west [11, 12]. NDVI and precipitation are positively correlated in the grassland ecosystem of the central Inner Mongolia Plateau [7, 13]. Furthermore, on a monthly scale, NDVI and climate factors exhibit cumulative effects along with hysteresis patterns [14]. From 2001 to 2021, the NDVI of the nine major river basins of China showed a significant upward trend annually. It showed a trend of low in the northwest and high in the southeast, in which the areas of stabilized vegetation growth are mainly concentrated in the inland river basins [12]. Precipitation and temperature are the main determinants controlling the spatial distribution of NDVI across the country [15, 16].
The HHR is located in the arid and semi-arid regions of Northwest China. It has the characteristics of a high elevation difference, sunlight exposure, high evaporation rates, and limited precipitation, among other factors that render its ecology relatively fragile [15, 17]. The dominant vegetation types consist of des and meadows, which are highly sensitive to climate variations [18], and environmental changes while also being susceptible to impacts from both climatic shifts and human activities [6]. Since the 20th century, under the influence of global warming [19], the meteorological factors of the HHR, such as temperature, precipitation, runoff, etc., have increased, showing the trend of improving vegetation cover [20]. Since the 20th century, due to global warming, meteorological factors such as temperature, precipitation, and runoff in the HHR have increased, showing a tendency to improve the vegetation cover. However, with the population explosion and rapid economic development [21], forest and grass degradation, land desertification, salinization, and other problems have occurred, resulting in the degradation of the vegetation cover [22, 23]. The study of vegetation change and stability in the HHRB holds significant importance for adapting to climate change, optimizing soil and water resource allocation, and evaluating ecological protection policies.
In the Qilian Mountain the upper reaches of the HHR, NDVI exhibited an upward trend (around 0.3% per year), with 42.82% moving towards good in the future. The areas prone to deterioration were primarily located in the alpine region, which overall remained stable [12]. In the middle reaches of the HHR, the NDVI of drylands, forests, and grasslands increased by 10-20%, and evaporation had a substantial impact on NDVI levels [24]. Significant improvement in NDVI was mainly observed along the HHR as well as in central and southern areas within this region’s middle reaches. Conversely, significant amounts are sparsely distributed around administrative centers. Multi-factor interactions generally exerted greater influence on NDVI than single factors did [25]. Most of the driving factors affecting NDVI changes in the HHRB are attributed to environmental factors and human activities [22]. However, existing methods for quantifying human activities primarily rely on residual analysis [26], which fails to directly assess the impact of land use changes or large-scale water conservancy projects [27]. Consequently, this approach often leads to an overestimation of the calculated influence of human activities. Therefore, this study primarily focuses on investigating the driving effect of environmental factors on NDVI in order to address these limitations. Previous studies have predominantly concentrated on the upper and middle of the HHR, with limited reports available for the lower reaches.
The main objective of this study is to make up for the lack of identification of NDVIs and drivers in the HHR. Previous studies have mainly focused on directly analyzing the correlation between NDVI and precipitation as well as temperature [28, 29], but rarely conducted comprehensive identification of key driving factors. By utilizing GeoDetector, we can effectively stratify heterogeneity among variables [30-32]. This study aims to achieve three specific goals. Firstly, analyze the spatiotemporal changes in NDVI within the HHRB from 2000 to 2022. Secondly, quantify how elevation, slope angle, directions, temperature, precipitation, evaporation, sunshine hours, and relative humidity act as primary factors affecting NDVI while also assessing their respective impacts. Finally, determine the potential causes behind vegetation changes in the HHR and predict future trends. These research findings will provide a scientific basis for protecting the ecological environment and promoting regional sustainable development within arid and semi-arid regions of northwest China.
Materials and Methods
Study Area
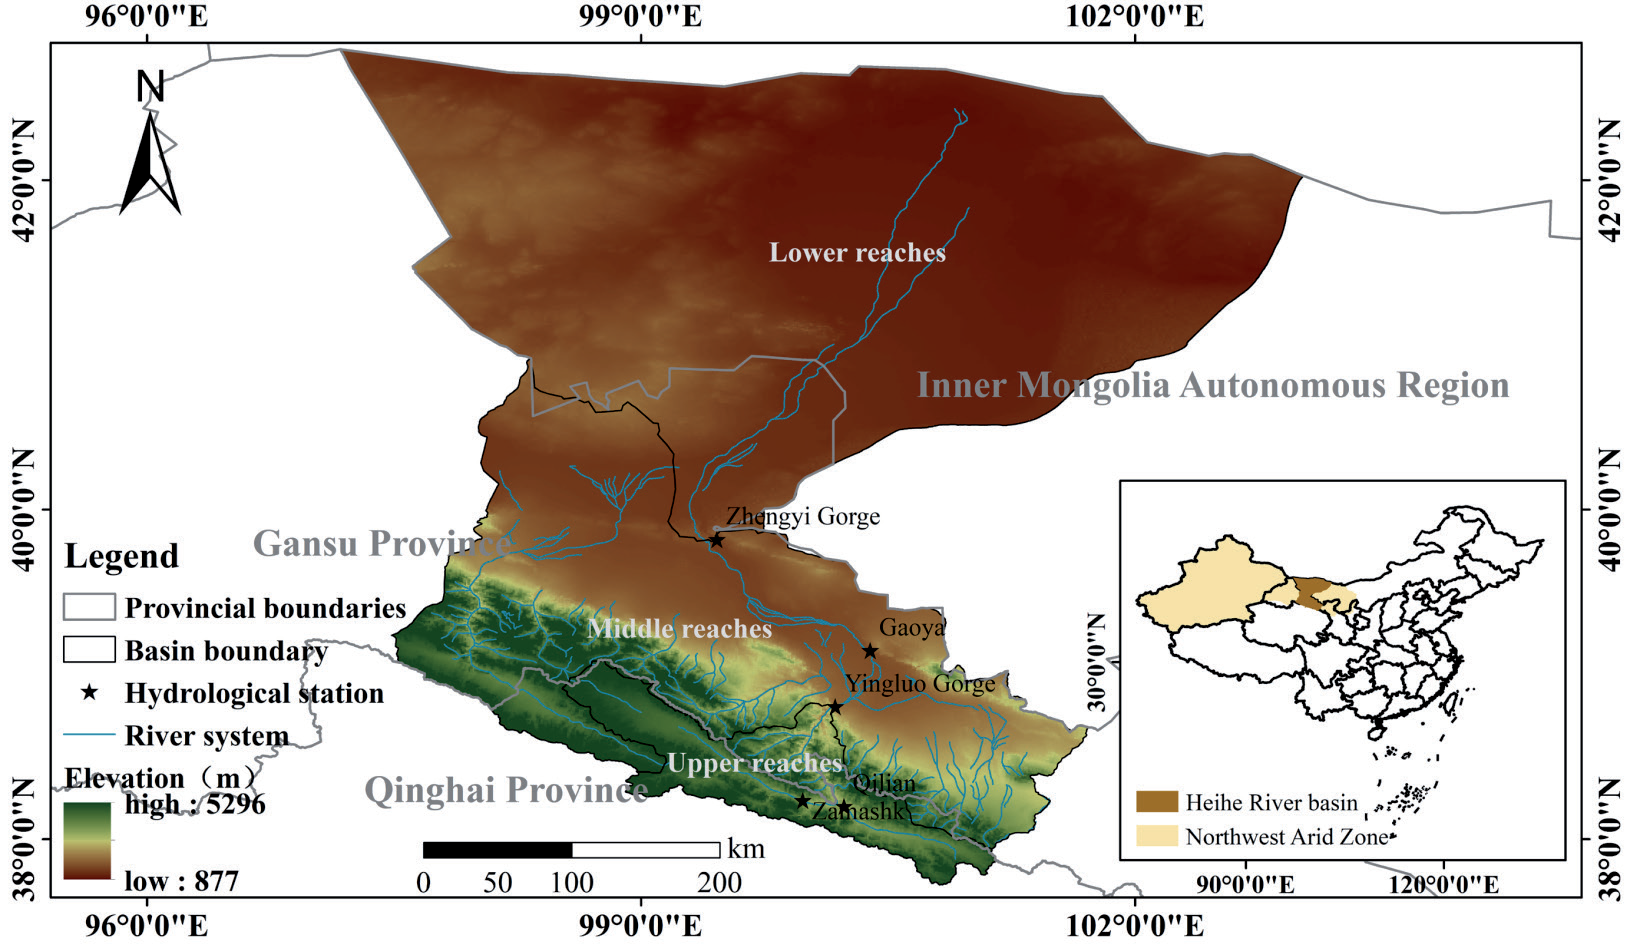
HHRB’s geographic location between 36.0°~45.0°N and 97.0°~103.0°E originated from Qilian County in Qinghai Province, China. The HHRB spans an area of 1.5×10⁵ km2 and has a river length of 821 km. It is the second-largest inland river basin in the NWARC, encompassing a total of 10 counties (cities, banners, and districts) across Qinghai, Gansu, and Inner Mongolia. The average elevation within the basin is 3600 m, with a relative elevation difference of 4419 m. The terrain is high in the south and low in the north, while the average annual precipitation measures at around 350 mm [33]. The upper reaches originate from the Qilian Mountains terrain, low temperature, and high human activity, making them the runoff-producing area for this entire basin [34]. Between Yingluo Gorge and Zhengyi Gorge lie its middle reaches, where the river channel’s length extends up to 206 km. This region serves as a major water consumption zone as well as an important irrigated agricultural area in Gansu Province, despite relatively dry climate conditions. This region’s average annual precipitation was only about 60-160 mm coupling, with potential transpiration rates ranging between 1000-2000 mm [35]. Meanwhile, the lower reaches, where an average altitude hovers around 1000 m alongside less than 100 mm annual precipitation levels, have experienced sharp declines in water resources due to coverage by desert wasteland or grassland areas. The location diagram of the research area is shown in Fig. 1.
Data Sources
The main information needed for the study includes 250 m of MODIS-NDVI monthly data from 2000 to 2022, which was obtained from the National Tibetan Plateau Science Data Center (https://data.tpdc.ac.cn). Digital Elevation Model (DEM) of the HHRB from the Geospatial Data Cloud (https://www.gscloud.cn/). Evaporation, precipitation, relative humidity, sunshine hours, and temperature data were obtained from the Environmental Science and Data Center of the Chinese Academy of Sciences (https://www.resdc.cn).
Methods
NDVI Calculation Methods
NDVI is the ratio between the difference between the surface reflectance in the near-infrared and visible red bands and their sum, with values ranging from [-1, 1].
where θnir is the near-infrared band and θred is the visible red band.
The monthly NDVI data are obtained by the internationally recognized Maximum Value Compositing (MVC) method [36]. The purpose is to eliminate any interference caused by cloud cover or atmospheric factors along with sun altitude angles so that surface vegetation coverage data may remain authentic [30].
where NDVIi is the NDVI value of month i, and NDVIij is the NDVI value of month i every 16 d.
Sen and Mann-Kendall Trend Analysis
Combining the Theil-Sen Median slope analysis estimation [37] with the Mann-Kendall parametric test [38] is a robust, noise-resistant method that avoids outliers [39]. The formula is shown in (3):
where the median is the median function. βNDVI is the trend of NDVI change; when βNDVI 0, NDVI shows an upward trend, and vice versa shows a downward trend.
In this paper, we take α = 0.1, 0.05, 0.01 as the significance level, that is, when |Z|>1.64, 1.96, 2.58, represents the significance test of 90%, 95%, and 99% confidence level. The type of NDVI change was categorized into six classes: highly significant improvement, significant improvement/degradation, insignificant improvement/degradation, and insignificant change in relation to the current situation of the HHR.
Coefficient of Variation
The coefficient of variation is the ratio of the standard deviation to the mean and characterizes the degree of variability of the observations [40]. The coefficient of variation is used to characterize the time series of NDVI values for each pixel. The larger the coefficient of variation, the more unstable the time series is; conversely, the more stable the time series is [41]. The formula for calculating the coefficient of variation is shown in (4):
where CV is the coefficient of variation, σ is the standard deviation of the NDVI time series data and (NDVI ) ̅ is the mean value of NDVI over the period 2000-2022.
Hurst Index
The Hurst exponential method defines the polar deviation R and the standard deviation S [12]. The ratio of which is
where H is the Hurst index, which can be found by linear regression analysis. The Hurst coefficient is used to make a judgment on the future trend [42]. H>0.5 means the future trend is the same as the past trend, and the larger H is, the stronger the positive persistence is. H = 0.5, that is to say, the future sequence is independent along with it. If H<0.5, it indicates that the future trend of change is opposite to the past trend.
GeoDetectors
The core idea of GeoDetectors is to measure the contribution rate of an independent variable to a dependent variable. It is based on the assumption that if an independent variable has an important influence on the dependent variable [43], then its distribution pattern is similar to that of the dependent variable [44]. The assumption has been widely used in many fields, such as the environmental sciences. In this paper, we focus on factor detection and interaction detection to reveal the driving mechanism of different detection factors on the spatial variability of NDVI in the HHR.
(1) Factor detection detects the spatial variability of the dependent variable Y and identifies the extent to which each of the detected factors X explains the spatial variability of Y. The formula is as follows:
where L is the stratification of the dependent variable Y, or the detection factor X. Nh and σh2 are the number of cells and Y-value variance of stratum h, and N and σ2 are the total number of cells and Y-value variance of the study area, respectively. q has the value range of [0, 1], and the larger the value, the stronger the explanation of the spatial variability of the NDVI by the detection factor X, and vice versa, the weaker the explanation.
(2) Interaction detection assesses whether the explanatory power of detectors X1 and X2 in explaining the spatial differentiation of the dependent variable Y is enhanced or weakened when they act together or independently of each other. The interaction results can be categorized into the following five types:
q(X1∩X2)<Min[q(X1), q(X2)] nonlinearly attenuated, Min[q(X1), q(X2)]<q(X1∩X2)<Max[q(X1), q(X2)] one-factor nonlinearly attenuated, q(X1∩X2)>Max[q(X1), q(X2)] two-factor augmented, q(X1∩X2) = q(X1)+q(X2) independent, q(X1∩X2)>q(X1)+q(X2) nonlinearly enhanced.
Results and Discussion
Spatiotemporal Changes of NDVI in the HHRB
Characteristics of Spatiotemporal Changes in NDVI
NDVI in the HHR showed a significant upward trend from 2000 to 2022 (Fig. 2 a), with a growth rate of 0.001 per year (P<0.05). It had a large fluctuation, in which NDVI decreased significantly in 2001, 2008, and 2015, respectively. NDVI was the highest in 2022 (0.119) and the lowest in 2001 (0.096), with a multi-year average of 0.109. NDVI in the upper part of the HHR was higher than that in the middle (0.160) and lower (0.066) parts of the river, which was 2.53 times higher than that in the basin. The results showed that the NDVI in the HHR showed a significant upward trend, with the highest growth rate in the middle reaches (0.0021 per year). The second highest is in the upper reaches (0.0018 per year), and the smallest is in the lower reaches, with a growth rate of only 0.0003 per year.
The Mann-Kendall mutation test (Fig. 2b) showed that the NDVI in the HHRB presented a significant upward trend in 2010 (P<0.05, |U| = 5.7307>U (0.05/2)). The upstream in 2013 and the downstream in 2011 of HHRB showed a significant mutation (P<0.05; and |U| = 4.3577>U (0.05/2), |U| = 4.78>U (0.05/2)), and the middle reaches in 2009 from the occurrence of an upward mutation but were not significant (P>0.05). From the mutation characteristics, the NDVI in the HHR showed a significant upward trend after 2010 (P<0.05). The two curves intersected in 2010, indicating that the NDVI in the HHR underwent an upward mutation in 2010, but it was not significant (P>0.05).
The spatial differentiation of NDVI in the HHR from 2000 to 2022 is significant, ranging from -0.22 to 0.69 (Fig. 3a). The upper reaches are mainly covered by medium-high vegetation, the middle reaches are characterized by low and medium vegetation cover in the low northwest and high southeast, and the lower reaches are mainly covered by low vegetation. The vegetation cover of the basin as a whole accounted for 10.59% of the high-value area (NDVI≥0.6), is mainly distributed in the mountainous areas of the upper reaches of the HHR and near the middle reaches of the river system. 16.42% of the medium-value area (0.2 <NDVI<0.6), mainly distributed in the south of the middle reaches and near the lower reaches of the river system. The low-value area (NDVI≤0.2) accounted for the largest proportion of 72.99%, which was distributed over a large area in the north of the middle reaches and most parts of the lower reaches of the basin.
The global spatial autocorrelation coefficient Moran’s I was calculated to be 0.93 using multi-year NDVI (Fig. 3b). The global spatial distribution of NDVI in the HHR showed significant positive spatial autocorrelation (P<0.01). That is, the vegetation cover was in an aggregated state. The positive spatial autocorrelation of NDVI with high-high agglomeration and low-low agglomeration was mainly concentrated in the upper and middle reaches. Most of the vegetation in the lower reaches showed non-significant changes (P>0.01), i.e., most of the pixels did not break away from their original lower spatial agglomeration. Some of them near the river system show a high–high autocorrelation of better vegetation cover.
Fig. 2.
Characteristics of interannual variation and mutation of NDVI of vegetation in the upper, middle, and lower HHR area and basin.
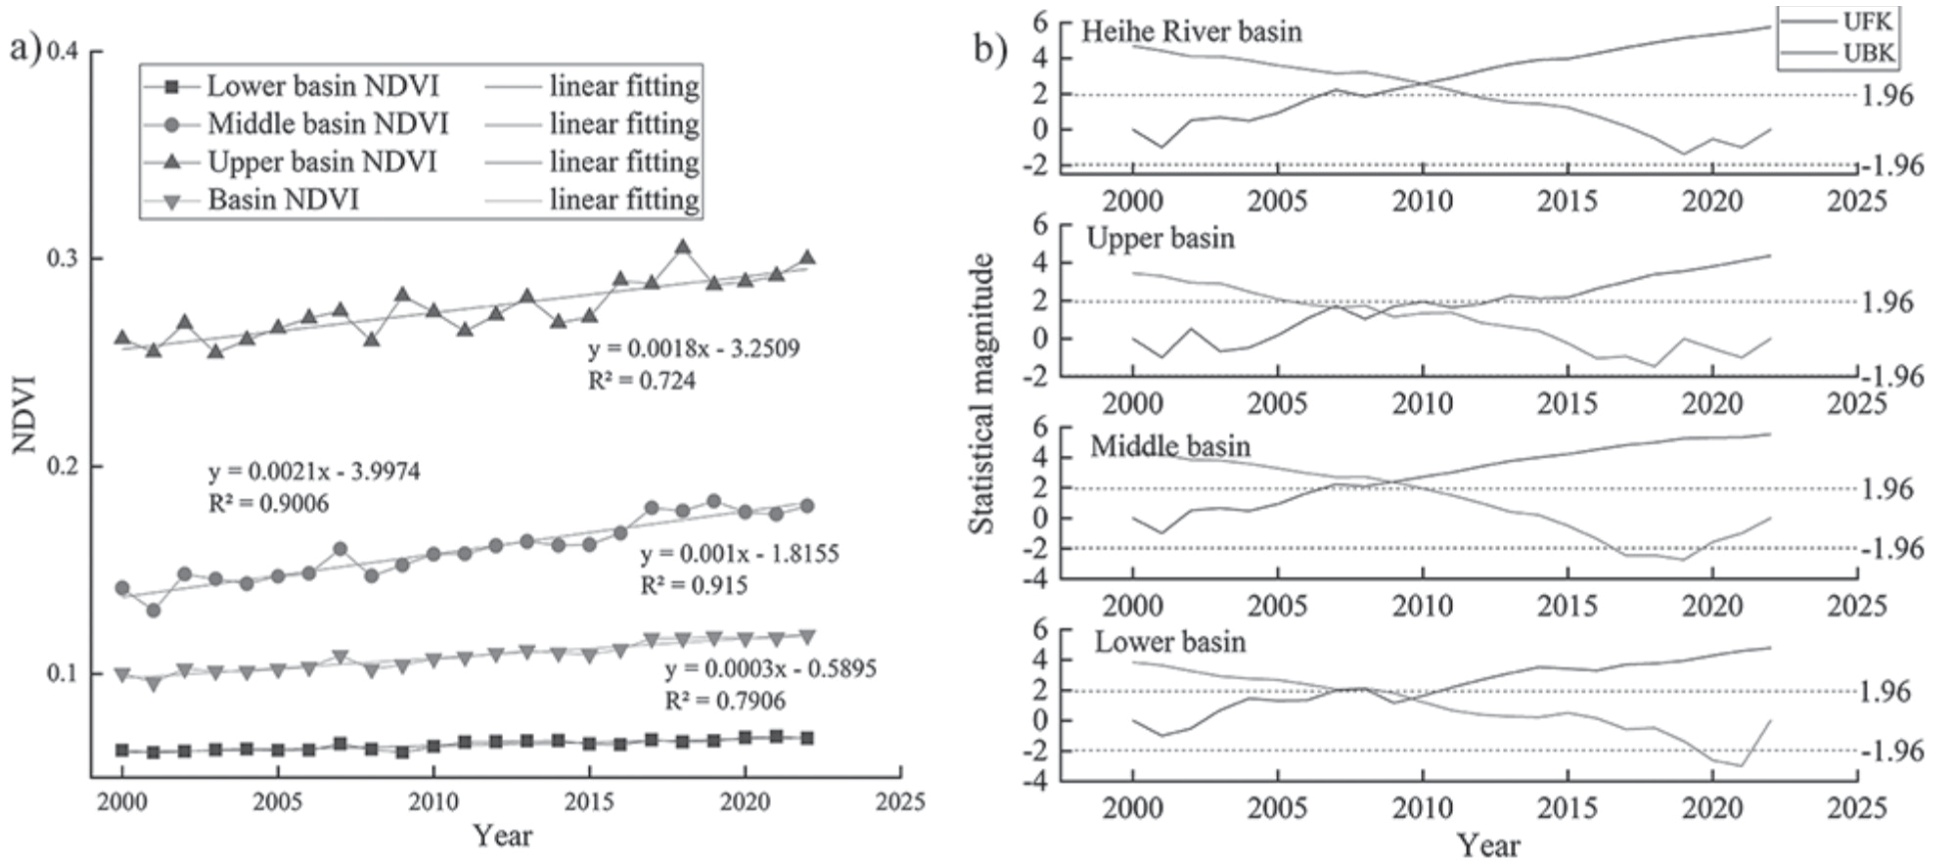
Fig. 3.
Spatial distribution of NDVI and its spatial autocorrelation from 2000 to 2022 in the HHRB. a) Spatial distribution of NDVI, b) Spatial autocorrelation clustering with scatterplots of NDVI.
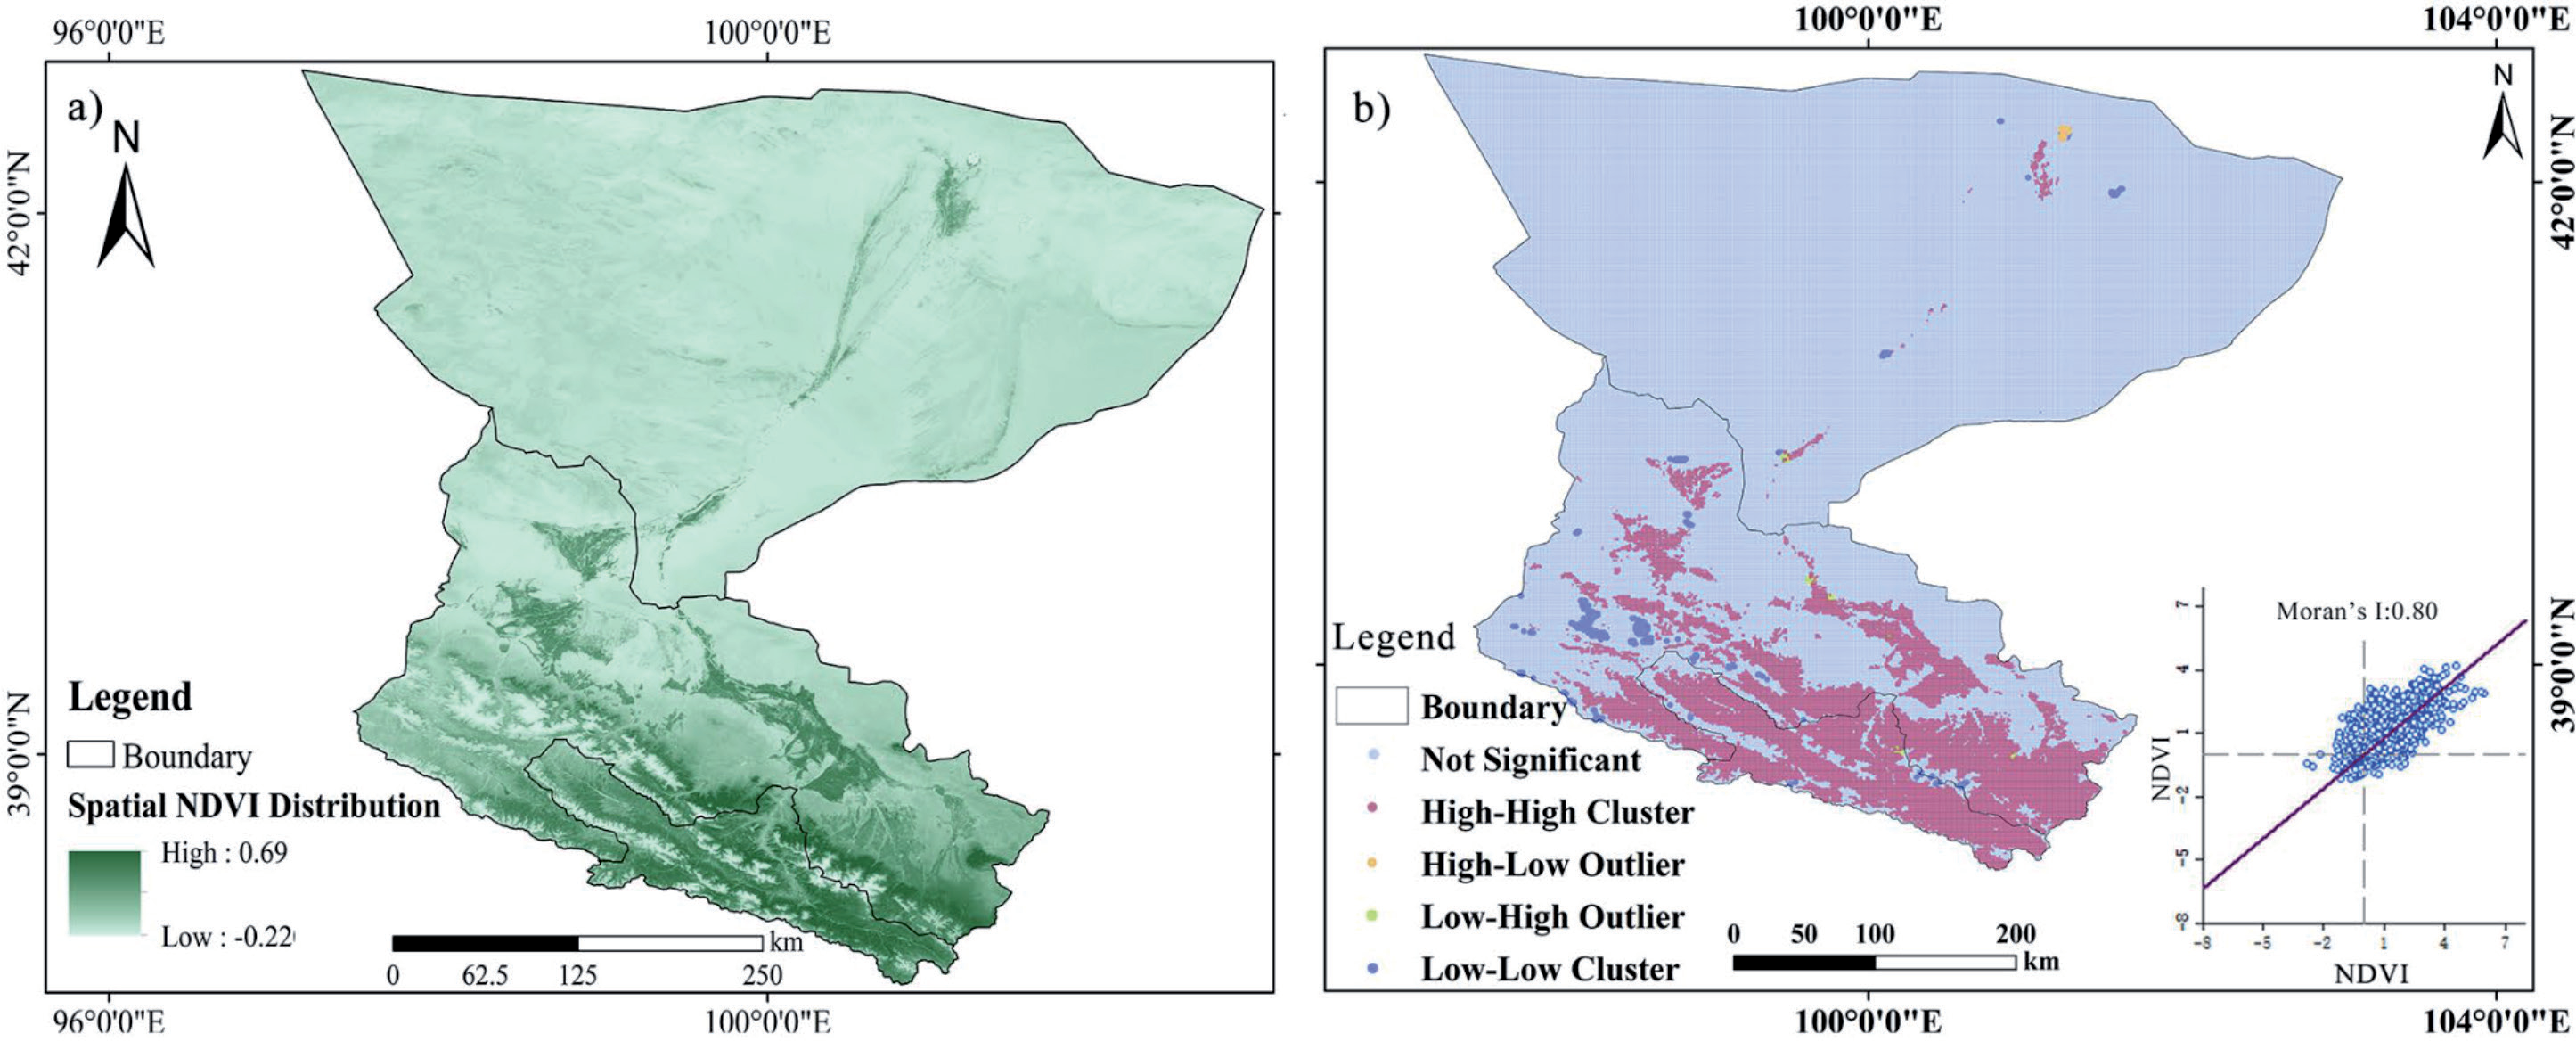
The local spatial autocorrelation coefficient of Moran’s I is 0.80. Most of the points are clustered in the upper-left (high-high) region of significant clustered positive autocorrelation, which also indicates that most of the points obeyed the trend of the basin as a whole to be in the direction of improvement. More points are located in the first and second quadrants, with the first quadrant (low-high) being negatively correlated. That is, the pixel itself is in low correlation, but the adjacent pixels are in high correlation, as is the overall direction of vegetation improvement.
Patterns of Spatial Variation and Trend in NDVI
Comparison of NDVI in 2000 and 2022 in the HHRB (Fig. 4 a, b) shows that the vegetation cover shows an overall increase. The downstream portion of the medium-low vegetation cover transformed into a medium vegetation cover. The midstream portion of the medium-high vegetation cover transformed into high vegetation cover, and the upper portion of the medium vegetation cover to the high vegetation cover all increased significantly.
The overall area of low and medium vegetation cover in the HHRB tends to decrease, and the overall area of medium-low, medium-high, and high vegetation cover tends to increase from 2000 to 2022. Combining Fig. 4c) with Table 1, it can be seen that the total area of NDVI transfer between vegetation cover classes is 22,697 km2, accounting for 15% of the HHRB. The flow of NDVI between vegetation classes is mostly to higher classes, with low vegetation cover transferred to medium-low vegetation cover as the main area (area of 5866.64 km2, accounting for 3.86%). Medium vegetation cover transferred to medium-high vegetation cover (area of 4719.95 km2, accounting for 3.11%). And medium-low vegetation cover transferred to medium vegetation cover (area of 4625.35 km2, accounting for 3.04%). Overall, only 1.94% of the regional NDVI was transformed to lower grades from 2000 to 2022, but 13.06% of the regional NDVI shifted to higher grades. Indicating that the transformation of vegetation cover in the HHR was dominated by a positive direction and that the ecological environment as a whole was improving.
From the evolution trend, the mean value of the NDVI Sen trend of vegetation was 9.36 per year from 2000 to 2022 in the HHR (Fig. 5a), and the improved area of vegetation cover totaled 145,260.2 km2, accounting for 77.46%. And dominated by significant and highly significant improvement, accounting for 83% of the total improved area, mainly distributed around the HHR system. Non-significant improvement was the second largest, accounting for 9% of the HHRB, mainly distributed in the junction area between significant improvement and no significant change (Fig. 5 b). Except for some degradation in the northwestern part of the lower reaches and sporadic degradation in the middle reaches near Yingluo Gorge (the degraded area accounted for only 9.71%), the overall improvement of vegetation cover was relatively high in the HHR.
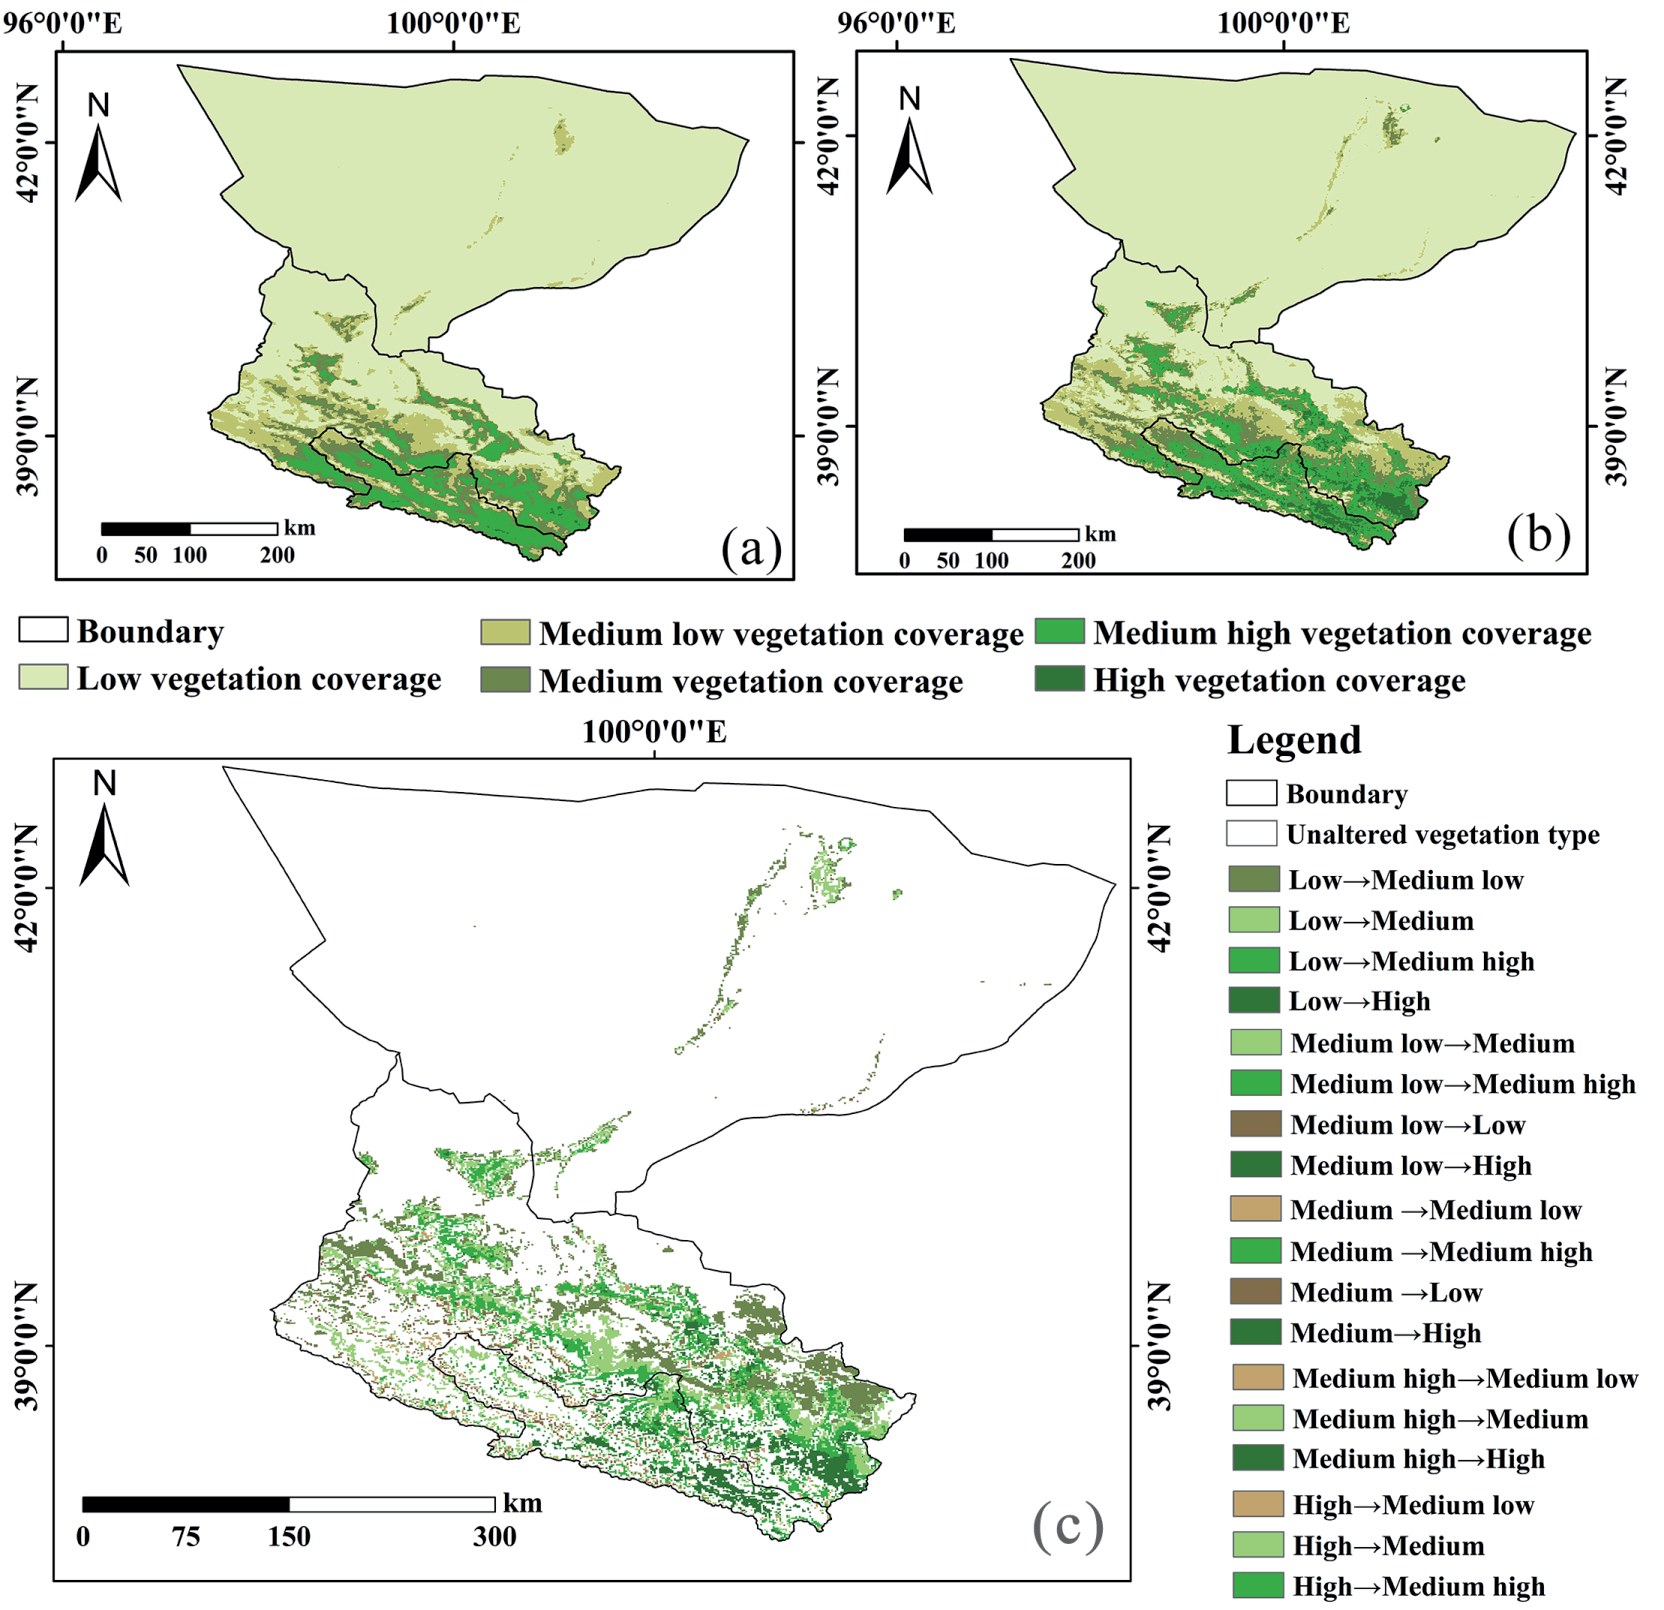
Table 1.
NDVI transfer matrix for the HHRB, 2000-2022.
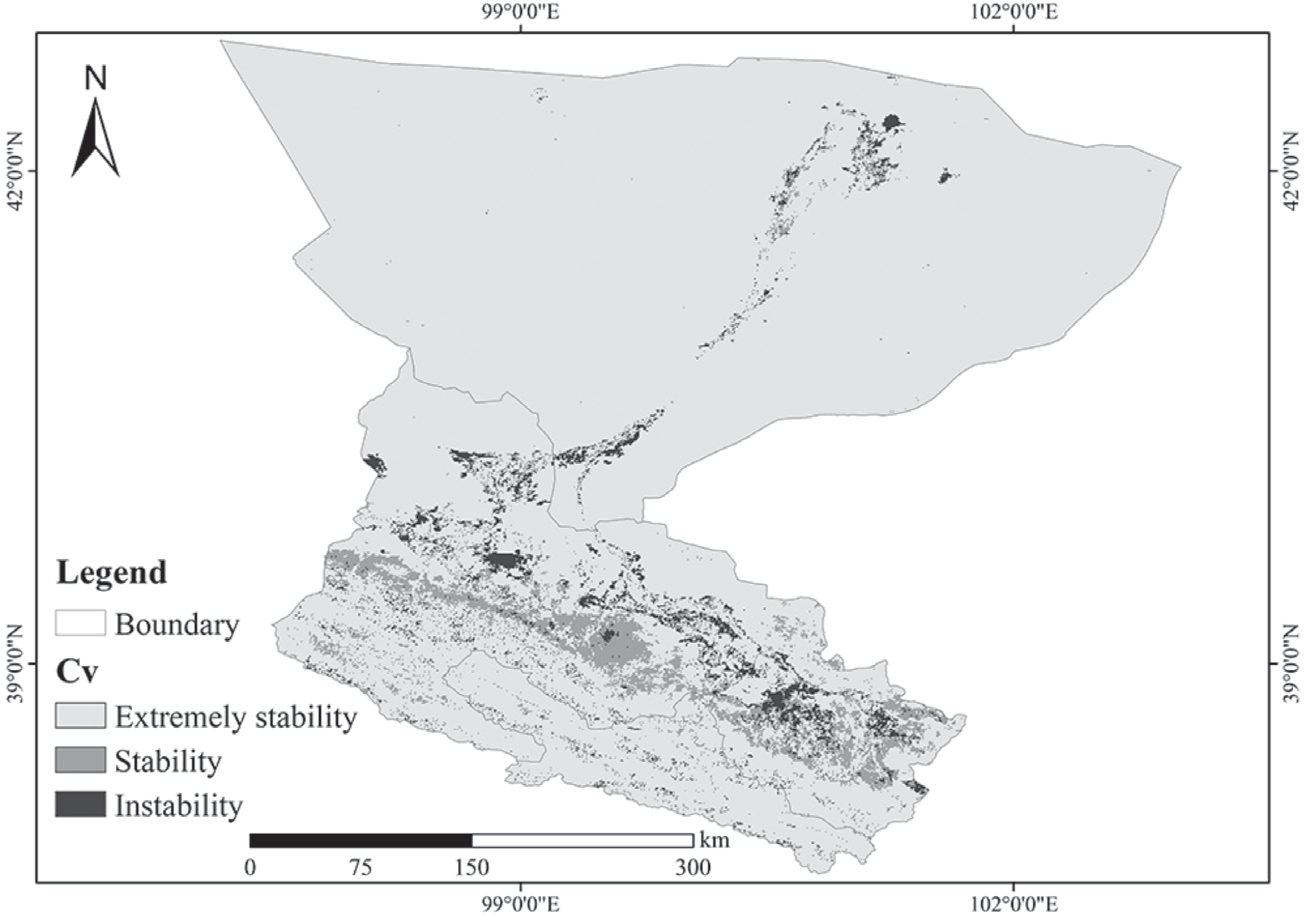
The coefficient of variation of NDVI in the HHR ranged from 0.009 to 0.555, with a multi-year average CV = 0.062. The basin as a whole is in an extremely stable state, and according to the 0.1/ 0.15/ 0.5 distribution of extremely stable, stable, and unstable, the vast majority of the NDVI of the HHR is in an extremely stable and stable state (Fig. 6). Wu et al. (2022) also reported that NDVI in the HHRB remained basically stable. However, most of the extremely stable areas in the lower reaches of the HHR are grasslands or deserts with low vegetation cover. The unstable areas are concentrated in the middle and lower reaches of the HHR system. The sporadic vegetation ecological changes in the middle reaches of the HHR in the agricultural and grassland ecological zones and in the Qilian Mountain forest and alpine grassland ecological zones are more drastic [45]. While the changes in vegetation and ecological environments in the other areas are relatively small. The unstable areas in the middle reaches of the HHR are mostly due to the fact that the surface is mostly planted with agricultural crops. Most of the changes in the vegetation cover in these areas are the result of agricultural farming [46]. The unstable areas in the lower reaches of the HHR are less stable due to the high vegetation cover next to the river system, which is prone to change [34].
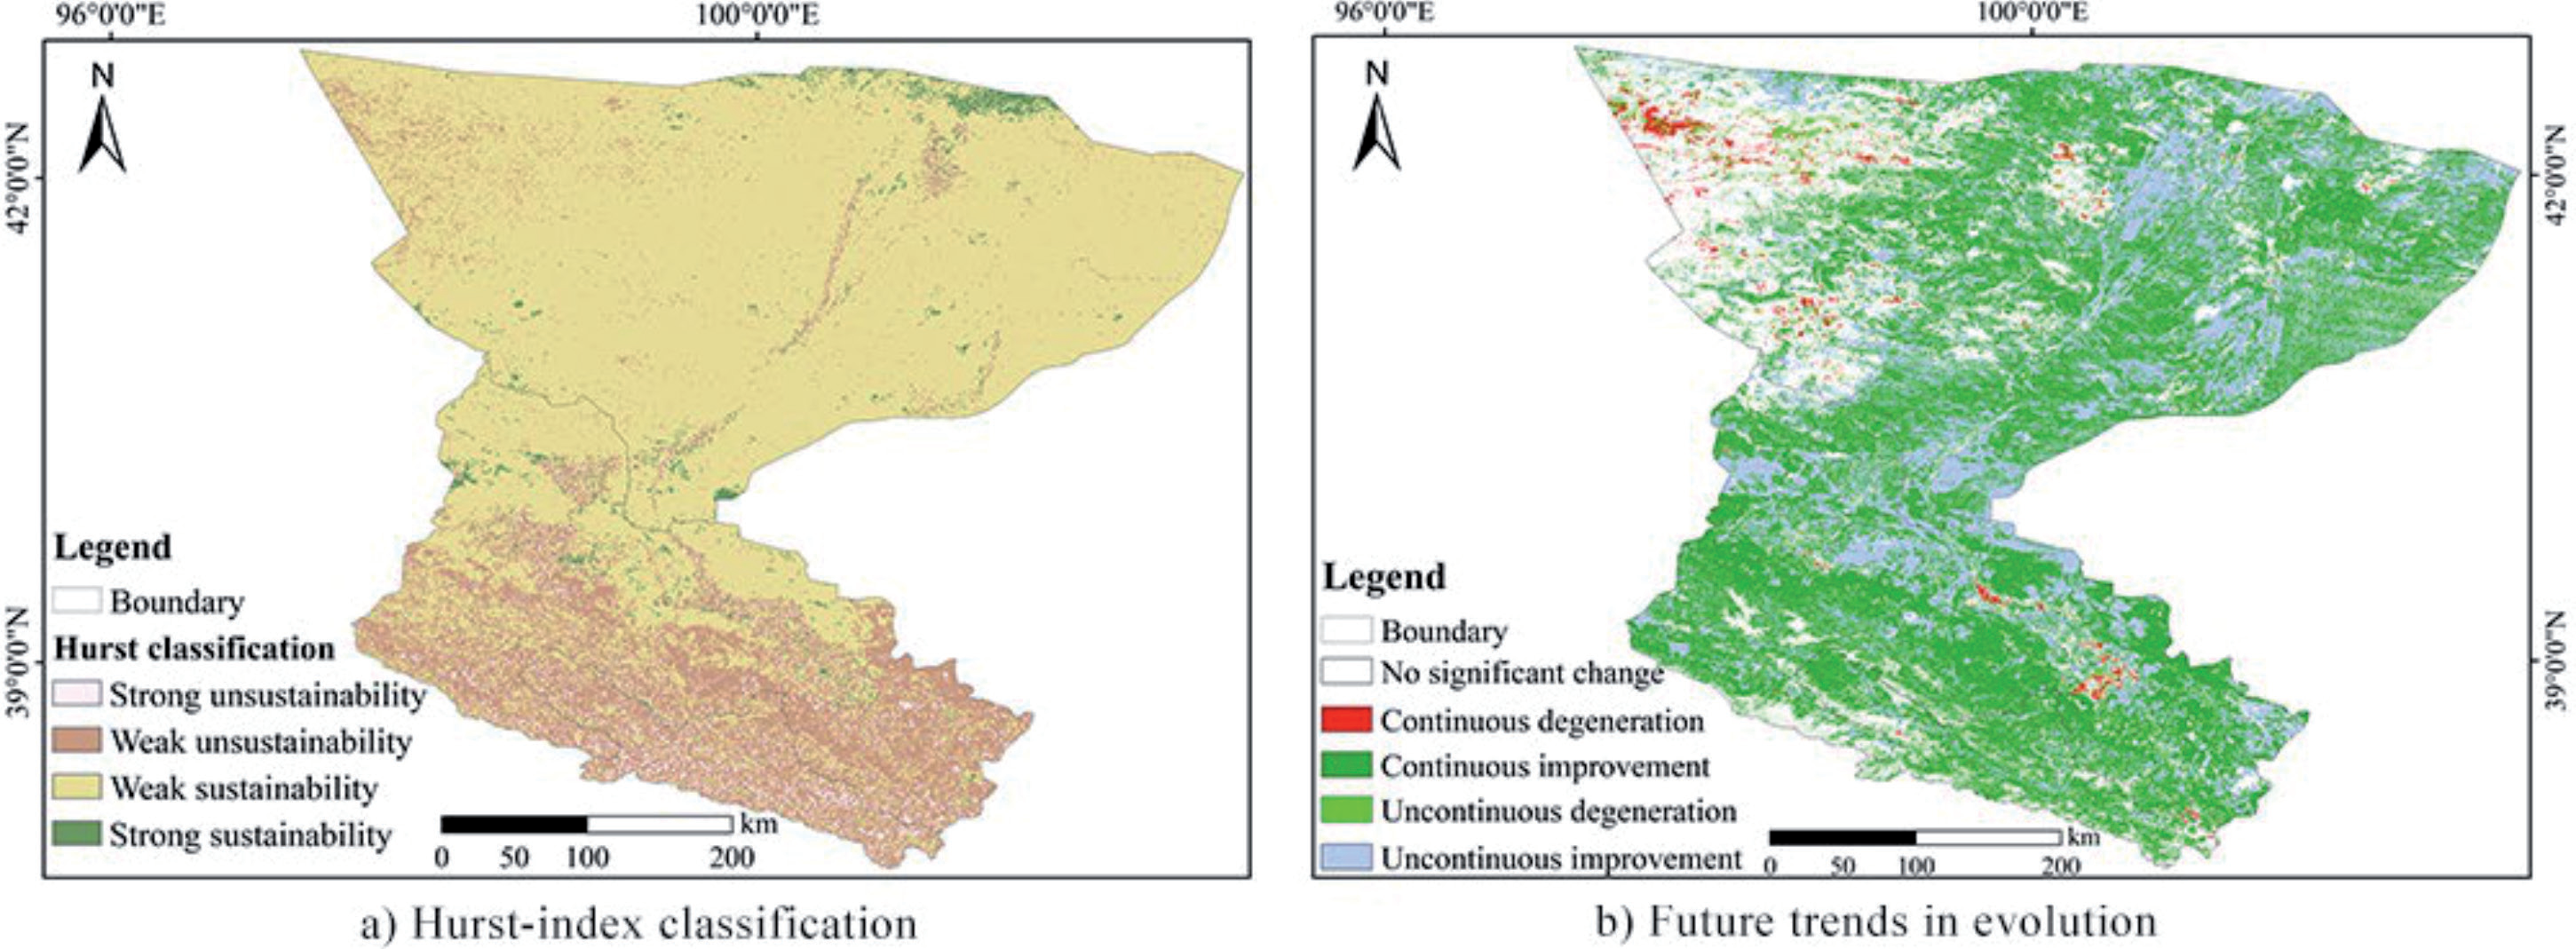
The Hurst index of NDVI in the HHR from 2000 to 2022 ranged from 0.15 to 0.95, with a mean value of 0.53. The area with a value of Hurst >0.5 accounted for 85.28%, indicating that the NDVI in general showed persistence characteristics, which were the same as the past trend (Fig. 7 a). According to the actual situation of the Hurst index calculation, it was divided into four classes: strong, weak, sustainability, and unsustainability. The weak persistence accounted for the largest proportion of 61.29%, mainly distributed in the north and the middle reaches of the HHR and downstream of the HHR. The weak unsustainability was the second largest proportion, accounting for 23.99%, and was mainly distributed in the upper and middle reaches of the HHR. The distribution of the strong persistence and the strong unsustainability areas was less and relatively fragmented, accounting for 14.48% and 0.24%, respectively.
Fig. 5.
Trend of NDVI in the HHRB from 2000 to 2022. a) Sen-trends in vegetation, b) Significance of M-K test).
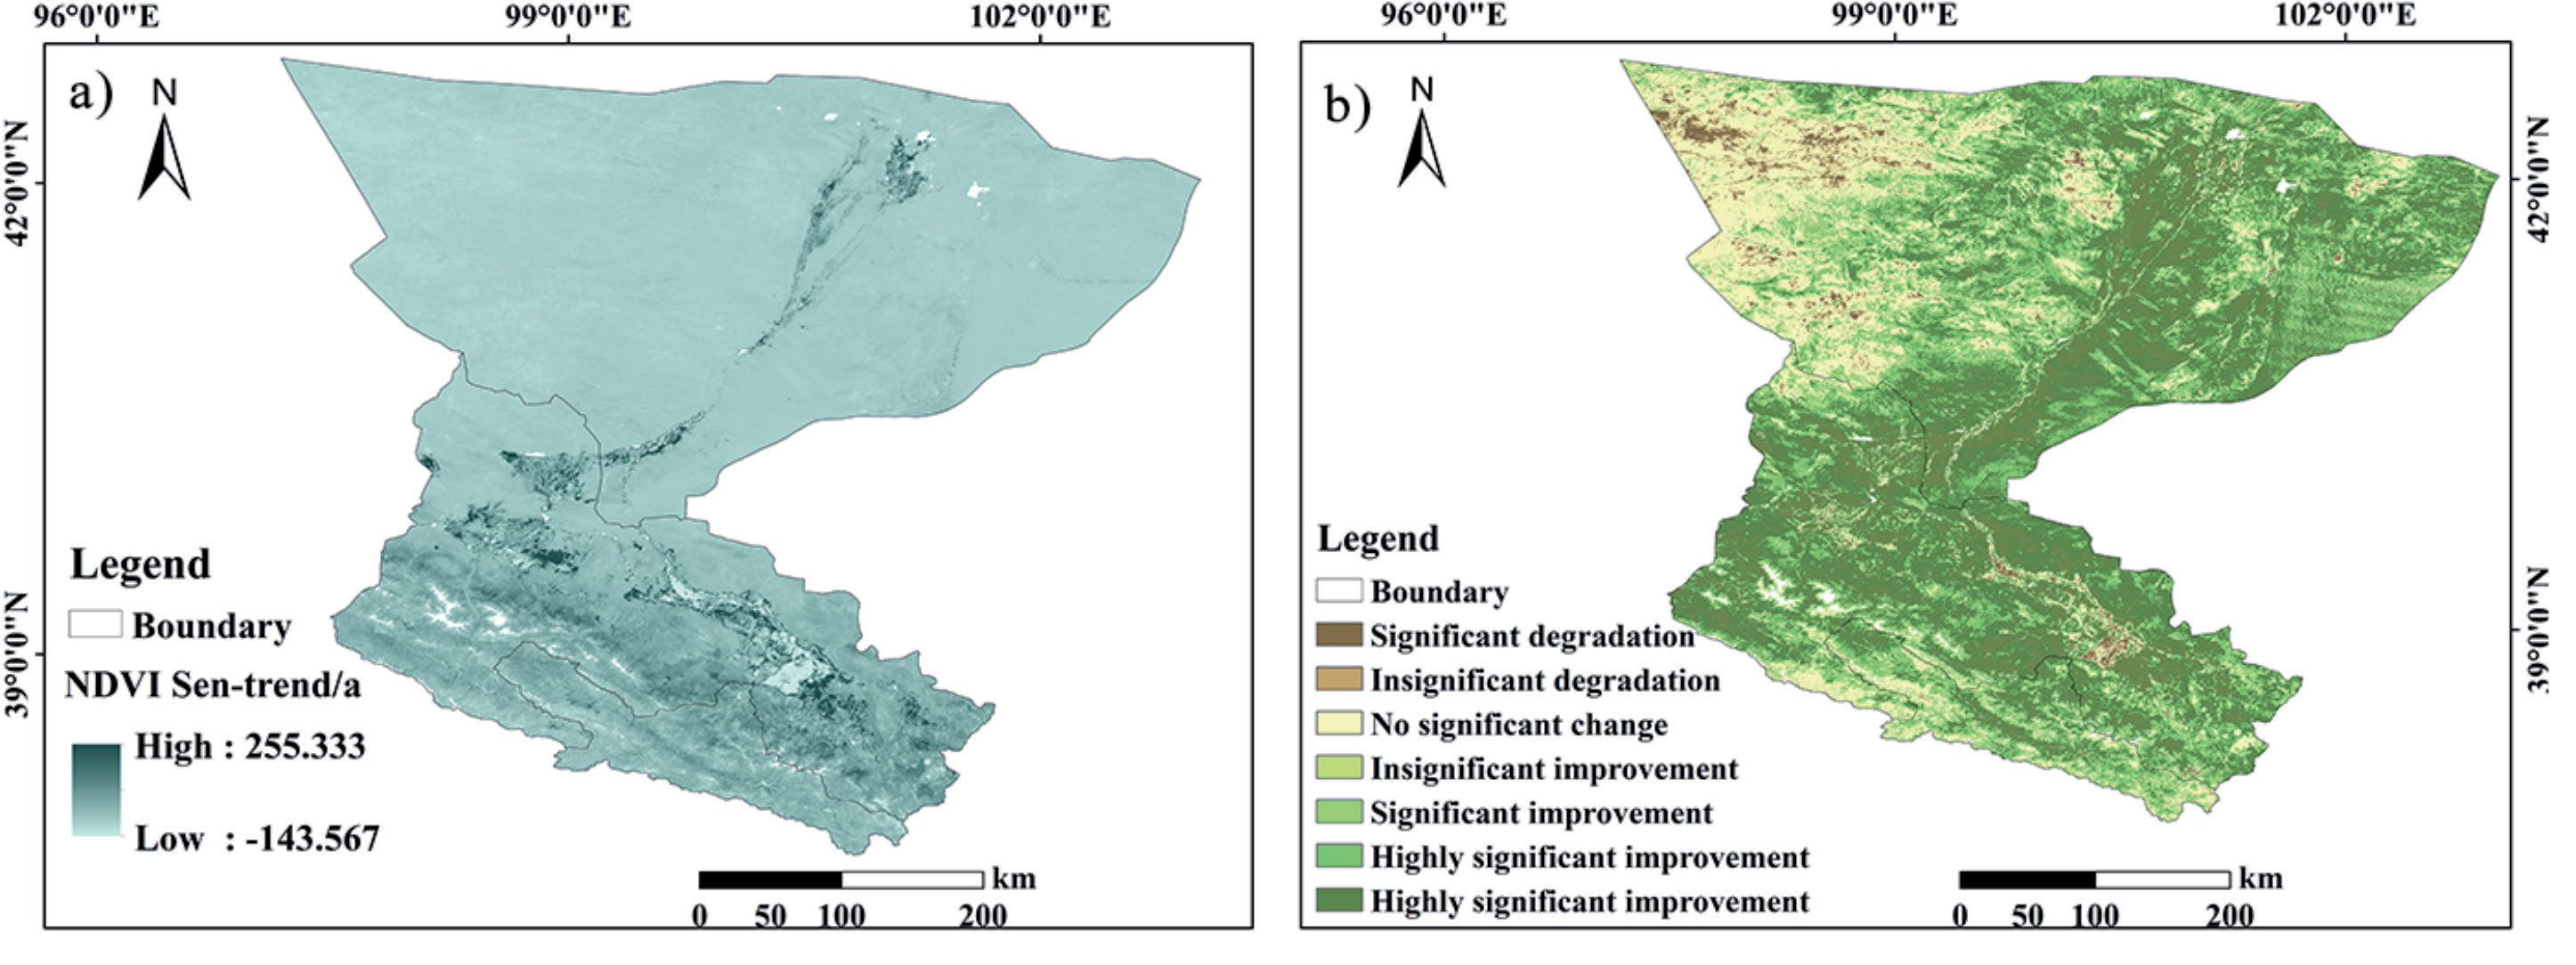
Fig. 6.
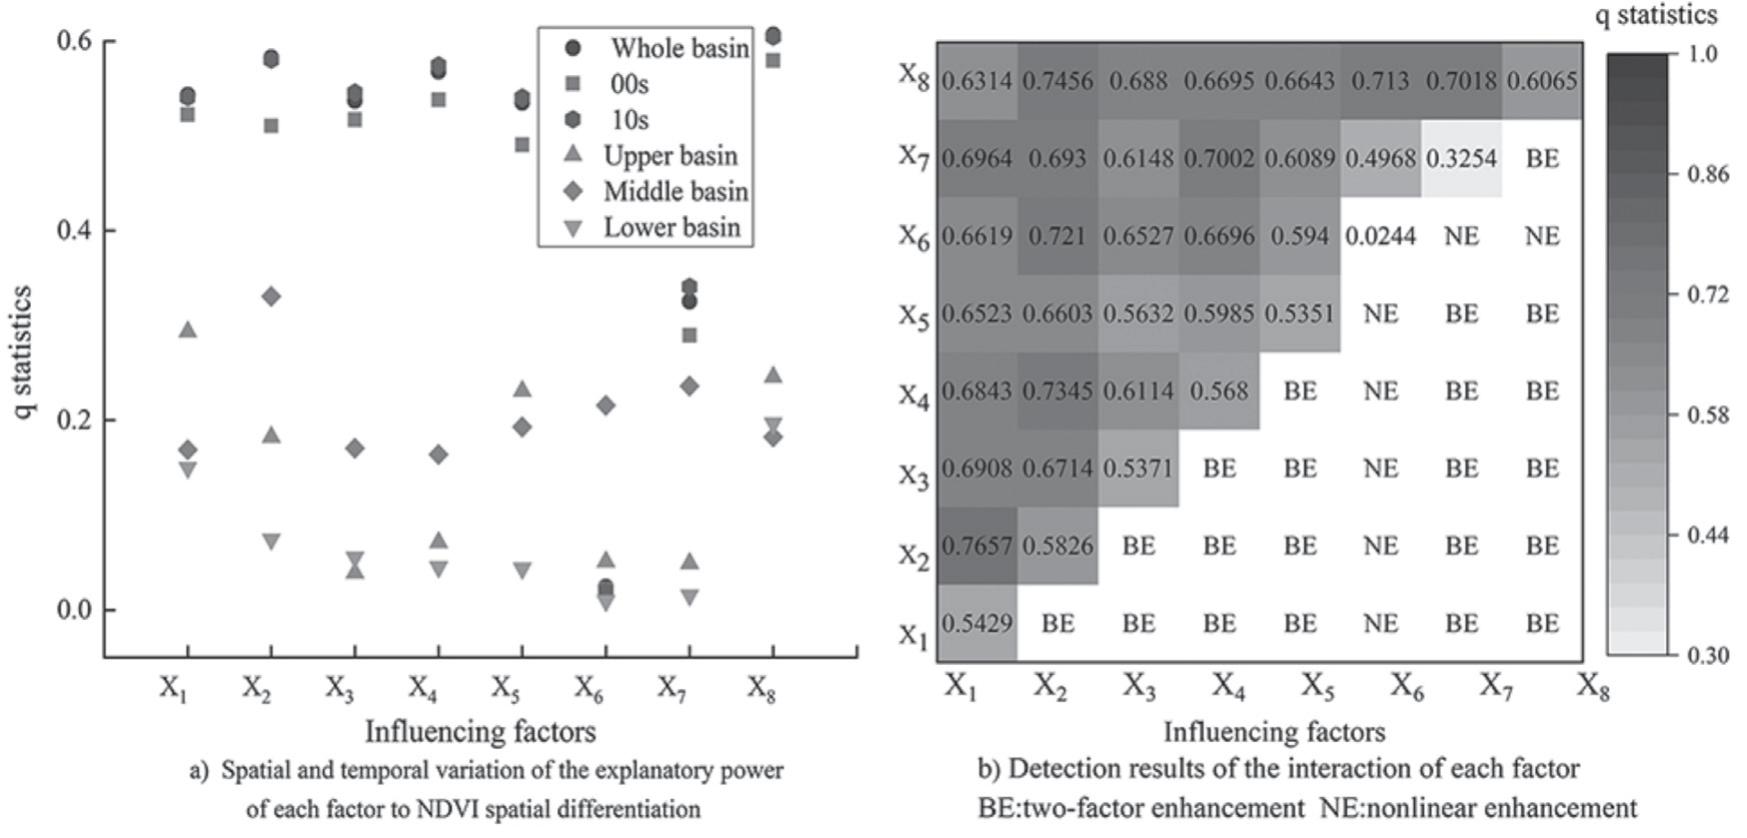
Spatial and temporal variations and interaction effects of factors on the spatial variability of NDVI in the HHR.
The NDVI trend was spatially coupled and superimposed with the Hurst index (Fig. 7 b) to further clarify the future development pattern of NDVI in the HHRB. Among them, the area of sustained improvement was 94,000 km2, with the highest proportion of 61.92%, which will show different degrees of sustained improvement in the future [47]. The anti-continuous improvement was the second highest, mainly distributed near the middle and lower reaches of the HHR river system. And the proportion of continuous degradation and anti-continuous degradation was small, both less than 10%. Mainly distributed in the western part of the lower reaches of the HHR, the main reason for the risk of degradation may be related to the change of water and heat conditions, land use type reconfiguration, and other factors that inhibit the growth of vegetation [33, 46, 48]. And the need to strengthen the ecological environment management of these areas according to local conditions. On the whole, NDVI in the HHRB is in a stable and improving development trend.
Analysis of NDVI Drivers in the HHRB
Single-Factor Impact Detection
Using a GeoDetector to analyze the NDVI of the HHRB from 2000 to 2022 with the mean value of each factor as a variable. Utilizing the natural discontinuity grading method to classify each factor into 9 categories. From a static point of view, the explanatory power of each factor on the spatial differentiation of NDVI passed the test of significance except for the slope direction (P<0.001) [49]. Combined with existing studies [30, 50] the explanatory power was divided into four categories: strong (0.5≤q≤1), medium (0.3≤q<0.5), weak (0.1≤q<0.3), and none (0 ≤ q<0.1). The results showed that elevation (X8), evaporation (X5), relative humidity (X3), sunshine hours (X2), temperature (X1), and precipitation (X4) were the strongest explanatory power. The slope (X7) was the medium explanatory power. While aspect (X6) had basically no effect on the spatial differentiation of NDVI. In general, the explanatory power of climate and elevation on the spatial variation of NDVI in the study area was relatively strong, while the explanatory power of other factors was relatively weak (Table 2).
Fig. 7.
Ecological detection results of various environmental factors in the HHRB. Note: the confidence level is 95%, Y is a significant difference between the two factors on the spatial distribution of NDVI, and the opposite is true for N.
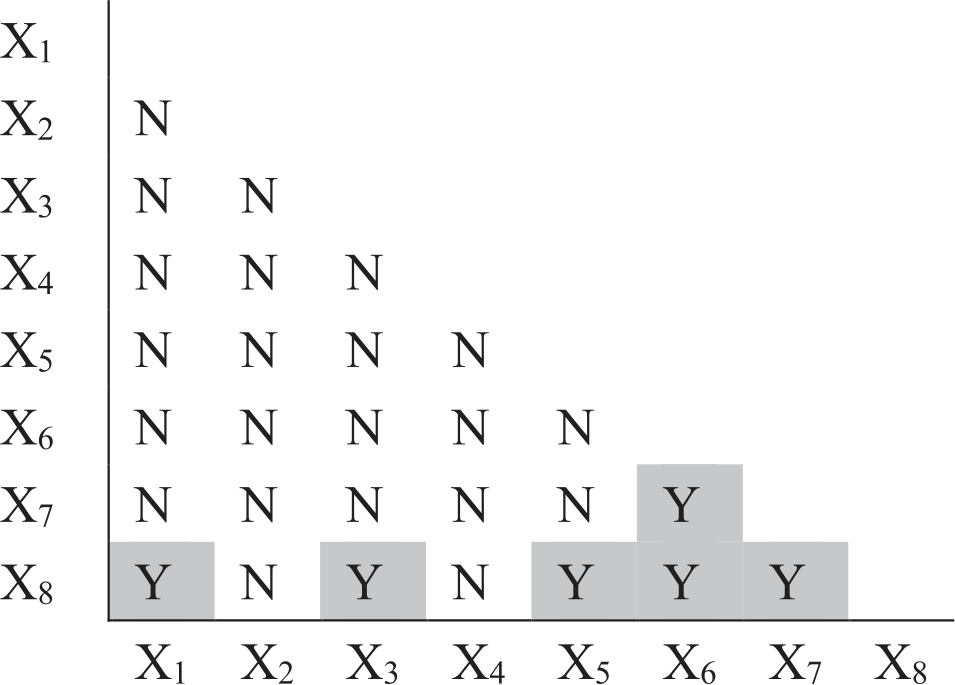
Table 2.
Explanatory power of factors on the spatial distribution of NDVI in the HHR.
| Elevation | Sunshine hours | Precipitation | Temperature | Relative humidity | Evaporation | Aspect | Slope | |
|---|---|---|---|---|---|---|---|---|
| q statistic | 0.6065 | 0.5826 | 0.568 | 0.5429 | 0.5371 | 0.5351 | 0.3254 | 0.0244 |
| p value | 0.000 | 0.000 | 0.000 | 0.000 | 0.000 | 0.000 | 0.000 | 0.6234 |
From the dynamic point of view, the explanatory power of each factor on the spatial differentiation of NDVI in the HHRB showed different degrees of changing trends (Fig. 8 a). Under the two time periods of 2000-2010 and 2010-2020, the explanatory power of each factor was basically unchanged. While the explanatory power of each factor at the 00s was lower than that at 10s, indicating that the influence of each factor tended to increase during the 20 year period, with a higher rate of increase in the number of hours of sunshine and the q-statistics of the slope. In the three divisions of the HHRB according to the upper, middle, and lower regions, the main influencing factors in the upper region are listed as follows temperature, elevation, and evaporation. In the middle region, the main influencing factors are listed as follows: sunshine hours, slope, and slope direction. In the downstream, the main influencing factors are in order as follows: elevation, temperature, and sunshine hours.
Detection of the Influence of Different Factor Interactions
The q-statistics of the interactions among different factors on the spatial differentiation of NDVI in the HHR ranged from 0.0244 to 0.7657 (Fig. 8 b). Among these, the top three interactions with the highest explanatory power were temperature∩sunshine hours (q = 0.7657), elevation∩sunshine hours (q = 0.7456), and precipitation∩sunshine hours (q = 0.7345), respectively. Overall, the explanatory power of the interaction between any two factors on the spatial differentiation of NDVI in the study area was enhanced compared to the explanatory power of a single factor.
The dominant interactions of the spatial differentiation of NDVI in each sub-area unit of the HHR varied (Table 3). But the overall results showed good consistency with those of the whole region. The top three dominant factors affecting NDVI in the upper reaches of the Hei River are temperature, elevation, and evaporation. And except for the second dominant interaction of temperature∩sunshine hours, the other dominant interactions are all elevation∩other factors. On the whole, the top three dominant interactions have two-way enhancement and medium explanatory power, and the rest of them have mostly nonlinear enhancement and weak explanatory power. The top three dominant factors affecting NDVI in the middle reaches of the HHR were sunshine hours, slope, and slope direction. All the interactions were two-way enhancement relationships with medium explanatory power. The top three dominant factors affecting NDVI in the lower reaches of the HHR were temperature, elevation, and sunshine hours, among which elevation was the most closely related. The three dominant factors were all elevation∩other factors (medium explanatory power). All the interactions were nonlinearly enhanced and weakly explanatory, except for the two-factor enhancement of relative humidity∩evapotranspiration and temperature∩elevation.
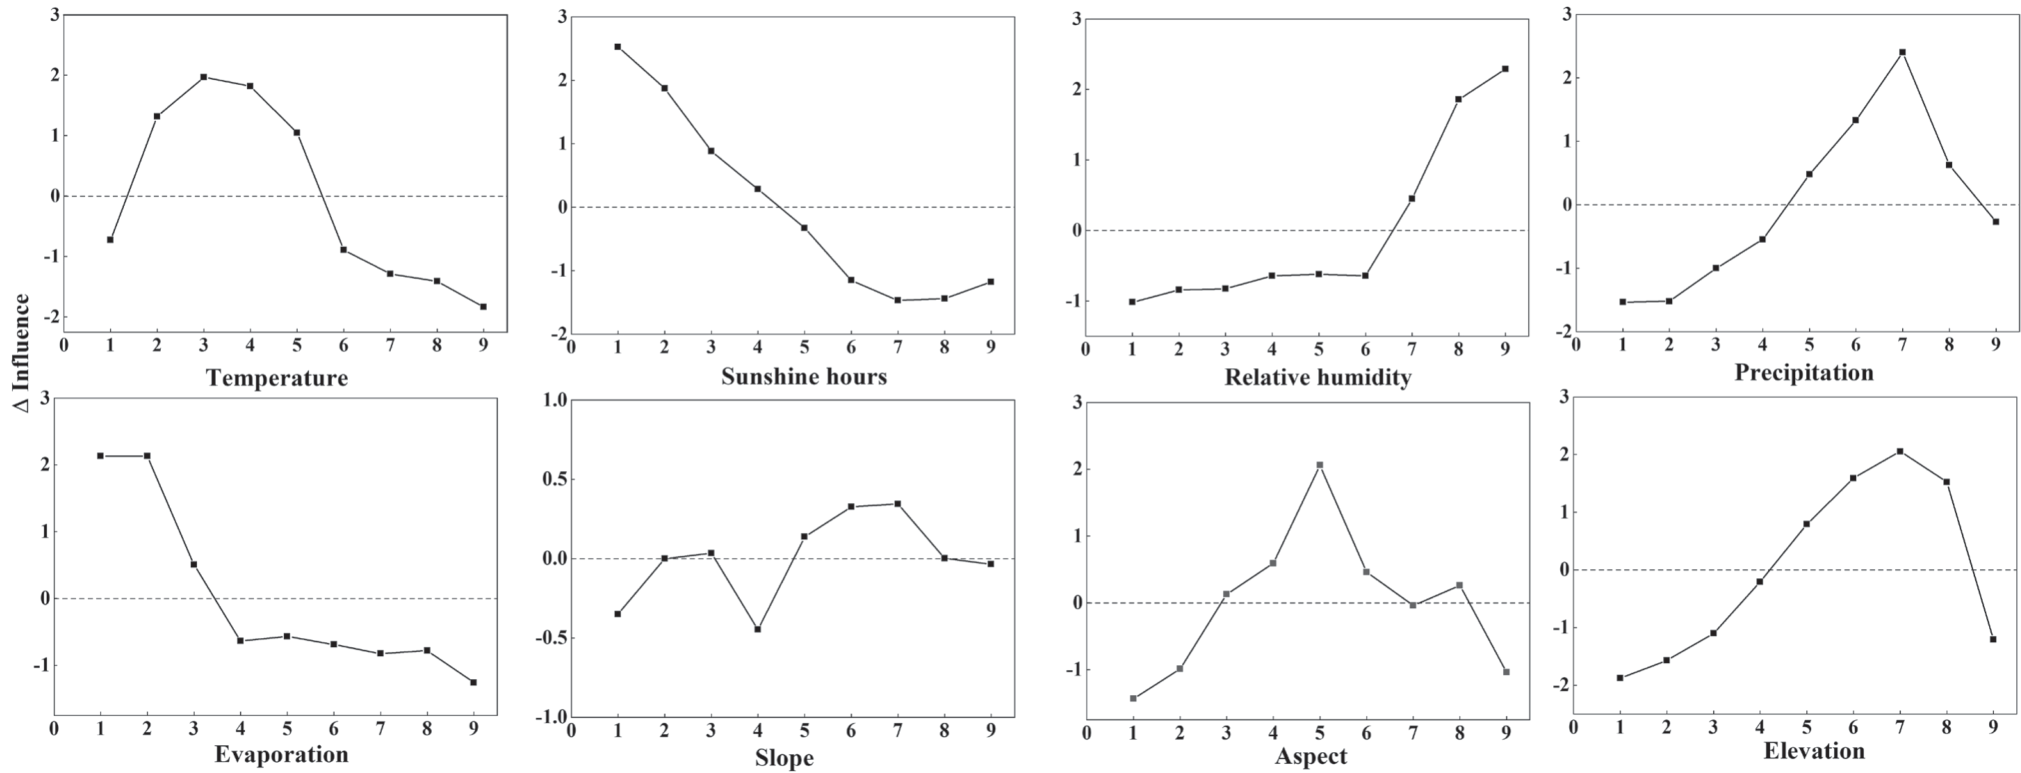
Table 3.
Interaction detection results of the top three factors in different regions.
Response Relationship between NDVI and Environmental Factors
Response of NDVI to Various Environmental Factors
According to the GeoDetector for ecological exploration, it is known that most of the interaction factors have significant differences in the spatial distribution of NDVI. The role of elevation is more prominent with other climatic factors, and NDVI is affected by the combination of climatic factors and surface factors (Fig. 9).
As can be seen from the changes in the influence of each driving factor on NDVI (Fig. 10), the continuous decrease in the rate of influence at each graded level of sunshine hours (ΔI2max = 2,770.84~2,884.88 h), the continuous increase in the rate of influence at each level of relative humidity (ΔI3max = 56.15~60.88%), and slope orientation had little effect. Except for the other factors, which all increased to a peak and then declined in the rate of influence on NDVI. The influence of temperature on NDVI increased to the 3rd classification (-4.42~-2.34ºC) and then decreased. The influence of precipitation on NDVI increased to the 7th classification (495.29~567.18 mm) and then decreased slightly. Evaporation had a positive effect on NDVI when it was small and then decreased sharply in the 2nd classification (1,308.90~1,482.48 mm). The influence of slope on NDVI fluctuated and increased to the 5th classification (I3max = 56.15~60.88%). Slope direction had little effect on the NDVI. The rate of influence of slope on NDVI fluctuated, increased to the 5th level (8.26~11.34ºC), and then decreased. The rate of influence of altitude on NDVI also increased to the 7th level (3,225~3,714 m) and then decreased sharply.
Influence detection using GeoDetector can also be used to derive the relatively more suitable range of NDVI for vegetation in the HHRB for each influence factor (Table 4).
Spatial Correlation between NDVI and Dominant Factors
The study shows that environmental factors are the main reasons that directly affect the NDVI. According to the GeoDetector, to calculate the comparison of the influence size of the influence factors of NDVI in the HHRB from 2000 to 2022, the three main influence factors are elevation, sunshine hours, and precipitation. And the correlation analysis in spatiotemporal can’t be carried out because the elevation factor is basically unchanged.
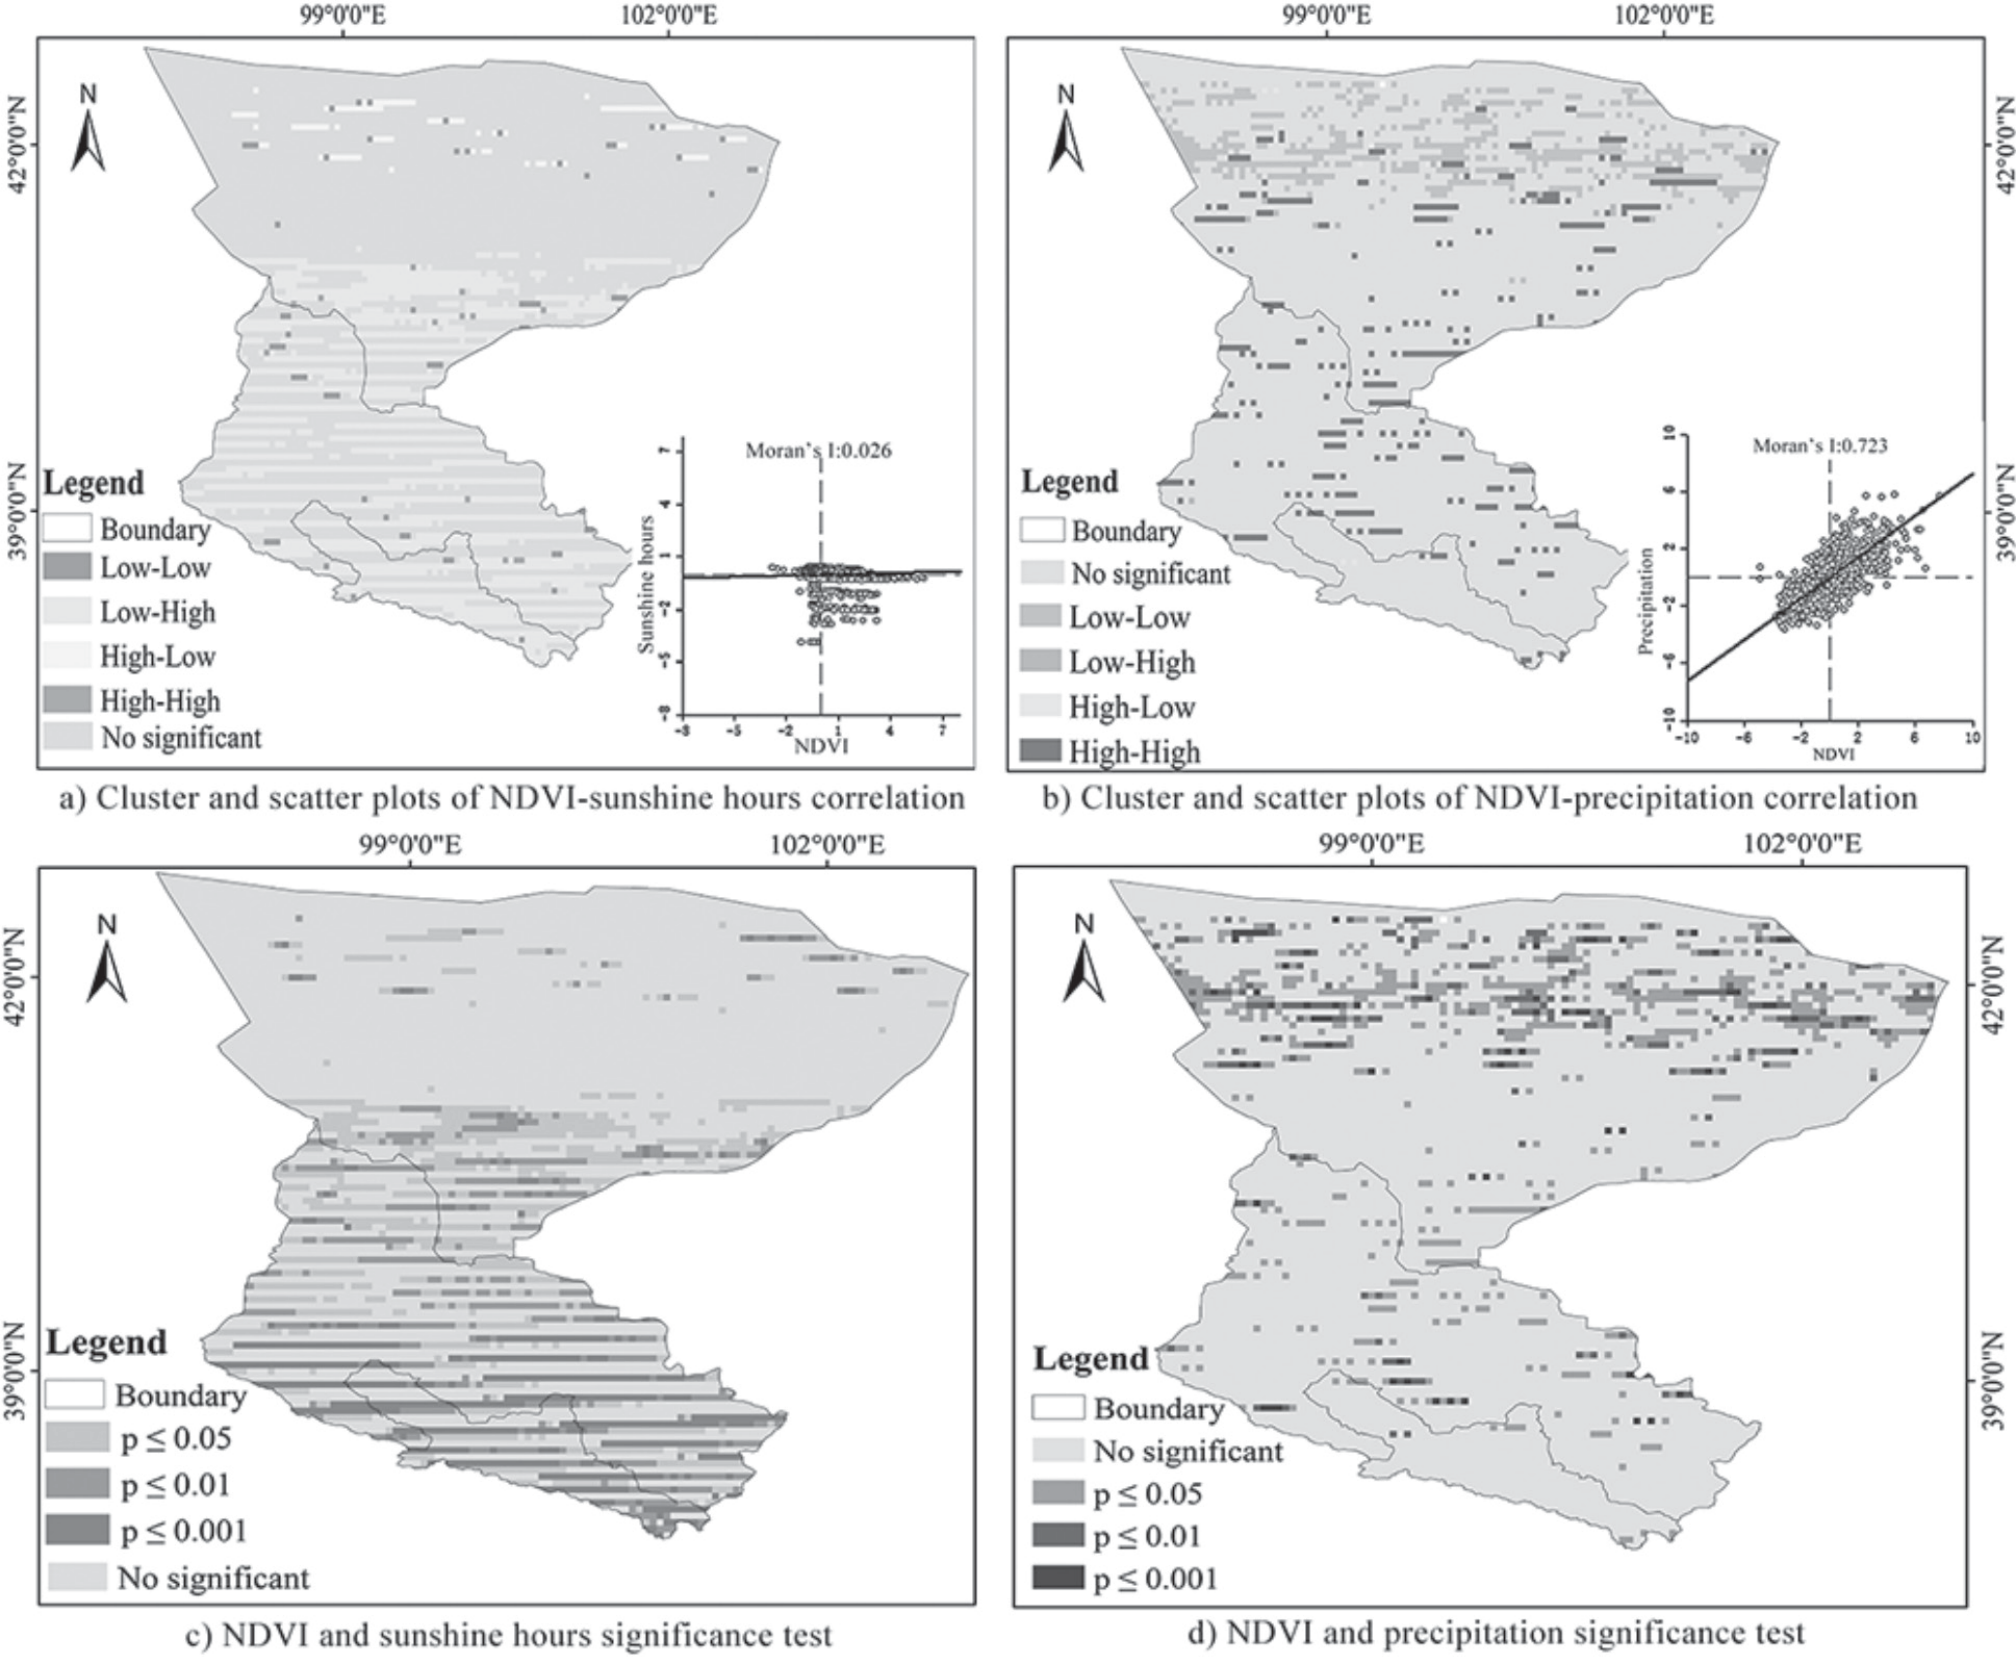
In order to clarify the spatial correlation between NDVI and sunshine hours and precipitation in the HHR, the correlation was analyzed by GeoDa in terms of image elements. The correlation between the NDVI and both of them in the HHRB showed obvious spatiotemporal differentiation. The results showed that NDVI and sunshine hours were mostly negatively correlated (high-low, low-high), with 67.2% low-high in most areas, mainly concentrated in the upper and middle reaches. High-low concentration in the northern part of the lower reaches. And fewer high-high and low-low (<10%) were scattered within the basin. The clustering map was consistent with the scatterplot, and the Moran’s I index scatterplot was concentrated in the first and fourth quadrants with a negative correlation (Fig. 11a). NDVI was mostly positively correlated with precipitation (high-high and low-low), accounting for 71.01% of the total. They were distributed in the middle and lower reaches, with low-low concentrations in the northern part of the lower reaches. High-low and low-high accounted for a smaller percentage (<5%). The clustering plot is consistent with the scatterplot, and the scatterplot of Moran’s I index is concentrated in the second and third quadrants with positive correlation (Fig. 11 b). This indicates that precipitation has a good correlation with the NDVI, and it increases (decreases) with more (less) precipitation.
Table 4.
Suitable range of NDVI for each influence factor in the HHRB.
The NDVI showed a negative correlation with sunshine hours and a high positive correlation with precipitation in the HHRB (Fig. 11 c, d). The results showed that 20.47% and 11.63% of the total image elements were significantly (0.01<P<0.05) and highly significantly (P<0.01) associated with the correlation effect of sunshine hours on NDVI and were mainly located in the upper and middle reaches of the HHR. The image elements had a significant (0.01<P<0.05) and highly significant correlation (P<0.01) with NDVI and precipitation, which accounted for 10.9% and 4.1% of the total images, respectively, and were mainly located in the northern part of the lower reaches of the HHR. As for the precipitation and NDVI, the image elements with significant (0.01<P<0.05) and highly significant correlation (P<0.01) accounted for 10.9% and 4.1% of the total images, respectively, and were mainly located in the northern part of the lower reaches of the HHR.
Causes of Vegetation Change in the HHRB
The NDVI showed a significant increase but not a significant mutation from the point of view of temporal change in the HHRB. The mutations all occurred around 2010, which was mainly related to the obvious increase in the trend of warming and humidification of Northwest China’s climatic environment around 2010 [51]. It contributed to the advancement of the greening period of the vegetation and the acceleration of the melting of snow to supplement the soil water to improve the moisture content of the vegetation. The vegetation growth and development are more favorable to the ‘HHRB Recent Management Project’, and they are consistent with the completion time of the project [32]. The spatial pattern of increasing from northwest to southeast is closely related to the distribution of vegetation types and land use types. The lower reaches of the HHRB are dominated by desert and some scrub vegetation [52]. The middle reaches of the HHR are dominated by desert, grassland, and artificial vegetation. The upper reaches of the HHR are dominated by alpine meadows and plateau vegetation. On the other hand, most of the upper reaches of the HHRB are the Qilian Mountains, which are the water source of the basin. The Qilian Mountains, which are the water source of the basin, and the middle reaches of the HHRB are the main areas of human activity. While the lower reaches of the HHRB are dominated by unutilized land, it is difficult for high vegetation cover to exist. Measures such as the ‘HHRB Water Diversion Program’ and the ‘HHRB Ecological Protection Forest Project’ having been implemented in the HHR mitigated the negative impacts of human activities on the ecological environment [45, 53].
From the perspective of spatial change, most of the NDVI of the vegetation in the HHRB improved significantly, and only a small part of the middle and lower reaches suffered degradation. Overall, the ecological restoration results were remarkable, and the trend of Sen evolution was consistent with the results of spatial distribution transfer (Fig. 5 and Table 1). These results are consistent with most previous studies [33]. The change is mainly due to the upstream Qilian Mountain area, which has large precipitation and abundant water resources. The middle reaches are flat, with sufficient light and heat resources, but with severe drought, low annual precipitation and high evaporation, a large artificial oasis area, and serious salinization of land in some areas [46]. The downstream Ejina Oasis is a desert steppe area with small precipitation, high evaporation, and a lack of water resources [45]. The change has been implemented for many years due to the policy of ecological water transfer, and the vegetation cover has slightly increased. Agricultural water use in the lower reaches of the HHRB has crowded out ecological water use. Although crop cover has increased, natural plants such as poplar have decreased accordingly, and the overall cover has not changed significantly. This is mainly due to overgrazing, blind land clearing, and expansion of land for construction, which have led to land sanding and the growth and development of vegetation being subjected to adversity [54]. The ecological and environmental situation in these areas is still severe and needs to be paid attention to.
Fig. 11.
Spatial distribution of NDVI Hurst index and spatial distribution of future evolutionary trend in the HHRB.
Analyzing the driving factors affecting the HHR using GeoDetector, it can be seen that the intergenerational changes in the number of hours of sunshine and the slope q-statistics rise at a higher rate [2, 55]. This is mainly due to the influence of global warming, HHR governance, and other projects in recent years [53]. In the subregion change, the regional influence factor difference is large, and its main reason may be the Qilian Mountains in the upper part of the watershed, where the height difference and temperature difference are large [56]. The middle reaches of the watershed were the main gathering area for human activities. There are a large number of human activities leading to the transformation of land use type, so it is affected by the slope degree and slope direction [46, 52]. Most of the areas in the lower reaches of the watershed are deserts or grasslands, which are basically unobstructed, and they receive the influence of the factors of temperature and the number of hours of sunshine directly. Meanwhile, the results of the influence detection of interaction factors showed that the spatial differentiation of NDVI was mainly affected by the synergistic influence of climate and elevation. Most studies have looked directly at precipitation and temperature [50, 57-60], and this study improved the classification of the explanatory power of environmental factors in the whole basin and each subregion to NDVI. And most of the interactions among the climate factors had strong explanatory power (q≥0.5371), which further supported the conclusion that climate factors dominated the explanatory power in the spatial differentiation of NDVI in influence detection [50, 53, 61].
Conclusion
Based on the analysis of NDVI changes in the ecological environment of the HHRB from 2000 to 2022, this study quantified the influence of various driving factors on NDVI and obtained the future change trend of NDVI. These findings are crucial for ecological environment protection in arid and semi-arid areas in Northwest China. The results revealed a significant upward trend in NDVI across the HHRB; it showed an increasing trend from northwest to southeast. On the whole, the vegetation in the basin shows a significant positive spatial autocorrelation agglomeration state. The characteristics of vegetation cover transfer in the study area are mainly from low grade to high grade, and the area of the whole region with improved vegetation was as high as 77.46%.
The detection results of the main environmental factors influencing NDVI in the HHRB indicate that elevation has the greatest impact, followed by sunshine duration, precipitation, and temperature. NDVI showed a negative correlation with 75% sunshine hours but a positive correlation with 71.01% precipitation. The suitable ranges of main factors for NDVI in the HHRB are as follows: temperature ranged from 0.10-2.81℃, precipitation ranged from 567.18-645.61 mm, altitude ranged from 714-4,175 m, and sunshine duration ranged from 3,03149-3,10208 h.
The NDVI exhibits a persistent characteristic overall (accounting for 85.28% of the total), which is consistent with the previous trend. The majority of NDVI in the HHRB remains in a highly stable or stable state. The future development trend of NDVI in the HHRB shows continuous improvement. Overall, the NDVI in the HHRB is on a stable and positive development trend. This study provides a scientific basis for ecological environment protection, monitoring, and assessment in the NWARC.

