

Introduction
As a key node of the international transport network, ports are more and more important [1]. However, there are still some phenomena in port operations, such as waste of resources, insufficient output, and large emissions of air pollutants. According to figures, the cargo throughput of ports nationwide reached 15.545 billion tons in 2021, an increase of 6.8% over the previous year. The enormous cargo throughput is bound to bring about the expansion of the port and the discharge of a large number of environmental pollutants, which will seriously damage the natural coastline and the ecological environment [2]. When ships operate in ports, the air pollutants generated by their activities and unloading during berthing are alarming [3]. The data released by Hong Kong shows that in 2016, air pollutants emitted by ships accounted for half of the total emissions, and sulfur dioxide emissions accounted for 49%. Scholars detected soil samples in the port area using X-ray diffraction and optical electron microscopy. They found that the soil contains a large amount of Pd and other toxic elements [4].
Environmental issues have attracted global attention for a long time. In December 2017, the Third United Nations Environment Conference released the 2017 Frontier Report, which mainly studied six emerging issues. At the same time, a series of data released at this meeting also deserve extensive attention. At present, 80% of the world’s urban residents breathe air of poor quality. Marine pollution causes about 500 death zones, which directly threaten the survival of marine life; About 3.5 billion people live around polluted seawater; More than 80% of the world’s wastewater is directly discharged without harmless treatment. These problems are closely related to human life. With the proposal of carbon peak and carbon neutrality targets, developing a green economy has become the consensus of people [5]. The port is not an isolated individual. It is a system with an ecological environment. On the one hand, the production activities of the port and the ship are bound to affect the surrounding ecological environment [6]. On the other hand, excessive environmental damage will also hinder the development of ports. Therefore, considering the environmental constraints and the development of ports at the same time is of great research value [7]. In the long run, the construction of green ports should be comprehensively and deeply carried out to promote the harmonious coexistence of ports and the environment [8].
Policymakers can objectively understand the current situation through the measurement results of ecological efficiency. The extraction of key influencing factors is conducive to their corresponding policy guidance [9]. In the past, scholars have focused on the use of the DEA method to measure ecological efficiency. Roll and Hayuth first applied it to port efficiency measurement. They solved the problem of multiple inputs and outputs in the calculation of port efficiency and proposed that this model can introduce environmental factors into the calculation of port efficiency [10]. Subsequently, Martinez-Budria and Diaz-Armas applied it to the efficiency evaluation of 26 Spanish ports [11]. Tovar and Tichavska expressed the ecological efficiency performance index as the ratio of external cost to port profile [12]. Jiang and Yang introduced the uncertainty theory into the data envelopment analysis and examined the ecological efficiency of the port industry from two different perspectives [1]. Hercules and Girish have made a comparative study of typical DEA models and proposed a new ecological DEA model, which simultaneously evaluates the undesired output and expected output of port service production [13]. Wan and Zhang et al. expressed the green development level of the port quantitatively through the evaluation model and proved the effectiveness of the evaluation model through empirical analysis [14]. Tichavska put forwards the external cost and ecological efficiency parameters related to the exhaust emission of Las Palmas Port and checked the correctness of the estimation [15]. Lee conducted a quantitative calculation of the environmental efficiency of the port city and studied the problems of port cities caused by environmental factors in detail [16]. Wang and Li first viewed the port and its area as an interactive whole. They evaluated the overall environmental efficiency through an efficiency model. Finally, the value of this model is verified through empirical analysis [17]. Quintano assessed the ecological efficiency of 24 European ports. He proposed stochastic frontier analysis to measure the comprehensive capacity of ports and verified consistency conditions through quantitative calculations [18]. But, it is also worth emphasizing that ports have solved the employment problem of a large number of employees through their production activities, provided welfare and social insurance for employees, and fully protected their rights and interests [19]. Meanwhile, a lot of infrastructure construction will be carried out around the port to drive local economic development, and certain resources will be invested in ecological environment governance. Mjelde et al. showed through their case studies that a significant reduction in port vessel emissions would bring social benefits by reducing the risk of loss of health [20], so it should be included in the calculation of port ecological efficiency as expected output.
Scholars have also conducted a series of studies on the influencing factors of port ecological efficiency. Wang and Zhou analyzed the impact of internal factors and external factors on the port’s green efficiency. The study found that the emissions of air pollutants have significant negative effects [21]. Pérez and González et al. calculated the efficiency of 27 ports in Spain over a decade. They clearly stated that the degree of specialization of ports is an important factor that positively affects the efficiency of ports [22]. Cui explored the relationship between port scale and port environmental efficiency, established a new RAM-Tobit-RAM model with unexpected output, and verified its rationality by taking 10 Chinese ports [23]. The results showed that the expansion of port scale does not necessarily have a positive impact on improving environmental efficiency. Castellano adopted a multi-step strategy to measure the efficiency of 24 Italian ports. They put forward a relatively complete method for measuring the environmental and economic benefits of ports and verified their practicability. When ports implement positive green policies, environmental efficiency will be significantly improved [24]. Quintano and Mazzocchi et al. studied the ecological efficiency of 24 European ports through the DEA method and response-based unit segment detection procedure. The research results verified that there is unobserved heterogeneity in port data, and technical efficiency has a positive impact on ecological efficiency [25]. However, only one year’s data is analyzed, which makes the research results limited. The selection of external factor variables must be consistent with the current policy background. Therefore, in our subsequent research, we selected factors that match the background of carbon peaking and carbon neutrality to make the results more practical.
In order to understand the situation of port ecological efficiency and propose policy recommendations to improve port ecological efficiency through analysis of influencing factors, we use the super-efficiency SBM model to measure the ecological efficiency of four major ports in the Yangtze River Delta. Then we use the Tobit regression model to analyze the influencing factors. At last, we put forward relevant policy suggestions according to the results of the data analysis. The marginal contribution of this paper is: Firstly, we include social benefits as expected output in the calculation of port ecological efficiency to make the results more accurate. Secondly, we select influencing factor variables that are more in line with the current policy background to make the results more informative. The research results indicate that the ecological efficiency of the port has not reached an effective level. The economic development of port cities and the application level of emerging technologies have a promoting effect on the ecological efficiency of ports. The expansion of port scale will reduce the ecological efficiency of ports. Our policy recommendations based on data analysis results can provide a certain theoretical basis and ideas for improving the ecological efficiency of ports.
Methods and Variable Selection
In this segment, some primary notions, development processes, and basic principles of the super-efficiency SBM model and Tobit model used in this study are presented.
Super-Efficiency SBM Model
The very beginning DEA method was mainly aimed at estimating nonparametric efficiency. However, it is mainly based on the radial perspective and cannot eliminate the influence of relaxation variables [26]. The super-efficiency SBM model is a non-radial model of the super-efficiency DEA model. It was first proposed by TONE as a model for comprehensively considering input and output when measuring (including expected output and unexpected output). This model considers the relaxation variables involved in input and output indicators in practical problems, which can avoid deviations in the results and make up for the shortcomings of previous models. The formula is as follows:
s. t.
In this equation, ρ is the ecological efficiency value of the port; N, M, I are the number of input, expected output, and unexpected output variables, respectively; sn,x and si,b are redundancy of inputs and unexpected outputs, respectively; sm,y is the deficiency of expected output; xk'nt', yk'mt', bk'it' are respectively the input-output values of the k' decision-making unit in the period; λk is the weight of the kth decision-making unit. The objective function ρ is strictly monotonously decreasing with respect to sn,x, sm,y, si,b, and 0<ρ≤1; if ρ = 1, then sn,x = sm,y = si,b =0, indicating that the evaluated DMU is effective, and there is no redundancy and shortage of input and output; if ρ<1, it means that the evaluated decision-making unit has efficiency loss, and the port ecological efficiency needs to be improved by optimizing the input-output value. In the actual measurement process, the efficiency of multiple decision-making units is 1; that is, they are effective at the same time. So they cannot be sorted and distinguished effectively. Based on the above reasons, we will use the super-efficiency SBM model considering the unexpected output to solve this problem. The advantages of using this model to solve problems are convenience for the ranking and evaluation analysis of decision-making units [27].
Tobit Model
The result calculated by the super-efficiency SBM method is a discrete value greater than 0. When doing regression, the continuously explained variable can only select partial values because of truncated or censored, which will lead to inaccurate results [28]. Davidson et al. defined truncated and censored [29]. The Tobit model belongs to the restricted dependent variable model, which can solve the above problems and was first introduced by Tobin [30]. The mathematical expression is shown in the formula:
In the formula, ρi* is a latent variable, ρi is the observed actual dependent variable, xij is the independent variable, α0 is a constant term, αj is the correlation coefficient vector, εi is independent, and εi~N(0, σ2). If we use the OLS method for direct regression of the model, the parameters of the Tobit model will be biased and inconsistent [31]. Therefore, we will use this method to identify the key factors affecting the port’s ecological efficiency.
Variable Selection
This paper intends to examine the ecological efficiency of the four major ports in the Yangtze River Delta port group from the perspectives of pure technical ecological efficiency, scale ecological efficiency, and comprehensive ecological efficiency. To this end, we selected Lianyungang Port, Nanjing Port, Shanghai Port, and Ningbo Port. We collected data from 2011 to 2021. Traditional output indicators only have economic benefits. This study adds social benefit indicators and environmental indicators representing unexpected outputs on this basis. In the regression analysis, we considered the current background. In the following content, We introduced the relevant indicators selected for data analysis and briefly explained the reasons for selecting them.
Input and Output Variables
When the DEA method is used, output indicators can be divided into two parts. The meaning of expected output is the economic value of the products or services provided by the economy that we expect to receive, which is characterized by the greater the value, the better. The unexpected output mainly refers to the environmental pollution index. We expect a smaller value. In this paper, the unexpected output is taken as the input index when calculating the ecological efficiency. At the same time, the resource consumption index is also a part of the input index, and the smaller the value, the better. Choosing reasonable input-output indicators is the premise and basis for the scientific evaluation of port ecological efficiency. Through reviewing the previous literature on the use of DEA to evaluate port efficiency, we found that there are two methods for selecting input and output indicators, namely the direct method and the indirect method.
The direct method refers to the direct consideration of the resources invested and the output obtained by the port in the production process. The input indicators include the number of terminals, the length of berths, employees, the area of the storage yard, the number of cranes, etc. The output indicators include a series of indicators representing the economic value generated by the port, such as operating revenue and throughput. The research object of the indirect method is port-listed companies. Generally, evaluation indicators are selected from the financial perspective to evaluate the port efficiency indirectly. For example, the cost of the main business, net assets, number of employees, salaries, etc., are taken as input indicators, and the income of the main business, net profits, etc., are taken as output indicators. Such standards are easy to obtain. But they can only explain the operating performance of port-listed companies and cannot provide effective assistance for us to study the ecological development of ports.
Whether the direct method or the indirect method is used, the pollutants that inevitably occur during port operation cannot be ignored. This paper studies the port’s ecological efficiency, which is the ratio of economic output to resource input, including the unexpected output of air pollutants. The water area and land area around the port constitute the ecological environment where it is located. The normal planning, construction, and operation of the port can not be separated from a variety of resources, including cultivated land resources, shoreline resources, human resources, energy, and various engineering materials. For the economic benefits that the port can generate, it includes a series of important indicators represented by the port throughput. As an important link of transportation, the port can also promote the growth of trade volume, drive the vigorous development of surrounding industries and services, meanwhile enhance regional development and economic strength. Moreover, it can meet the employment needs of most people by providing them with salaries to meet their daily needs and carry out infrastructure construction, thus producing huge social benefits. Therefore, according to these characteristics of ports and the connotation of ecological efficiency, we must consider problems from the perspective of green development. To improve port efficiency, we should not only achieve maximum output under certain inputs but also ensure the reduction of pollutants discharged at the same time. Therefore, when selecting input and output indicators, we not only need to consider both direct and indirect methods but also incorporate unexpected output into the indicator system of port ecological efficiency, that is to take into account the gas pollution, water pollution, and solid waste pollution caused by the operation of port ships.
The selection of input variables starts from the natural resources closely related to human production and life, such as energy and land resources, while taking into account the influencing factors of port ecological development, the measurement standards of port ecological construction achievements, and selecting capital input indicators closely related to port development to make the research more comprehensive. Table 1 shows the input variables we selected, and then we provide specific explanations for each variable.
1) Capital investment.
The fixed assets invested in port construction by various regions shall be taken as capital investment. The fixed assets invested in port construction are important indicators reflecting the importance and concern of port construction.
Table 1.
Input variable table.
| Input variable | Proxy variable |
|---|---|
| Capital investment | Fixed assets |
| Resource input | The length of the port shoreline |
| Labor input | The number of employees |
| Energy input | The total energy consumption |
Table 2.
Output variable table.
| Output variable | Proxy variable |
|---|---|
| Expected output | Economic benefits and social benefits |
| Unexpected output | Exhaust emissions |
2) Resource input.
The expansion of the port will consume a lot of land resources. The length of a port’s coastline is a key factor reflecting its scale. Therefore, we characterize the length of the port shoreline as resource input.
3) Labor input.
The labor force is an indispensable factor in each industry, and employees create value for the enterprise. Therefore, we regard the number of employees per port as labor input.
4) Energy input.
The port’s production activities will consume a lot of energy, such as diesel, gasoline, coal, electricity, etc. This paper selects the total energy consumption of each port’s annual production activities as the energy input and uses standard coal as the unit to measure the energy input.
As listed in Table 2, the output variables include expected output and unexpected output. The expected output selects the operating income that can represent the economic benefits of the port and the social insurance premium that represents the social benefits. The waste gas and wastewater generated by ship operation and port activities are unexpected outputs. As the research content of this article is mainly aimed at the unexpected output of air pollutants, wastewater discharge is not considered. We regard the sulfide, nitrogen oxide, and carbon dioxide emissions of ports as unexpected outputs.
Variables of Influencing Factors
In this paper, combining the internal and external dual mechanisms, the influencing factors of port ecological efficiency are divided into internal and external aspects. The internal factors we study include the scale of port development, the application of port emerging technologies, and environmental regulations. External factors include local economic development level and industrial structure. Table 3 shows the influencing factors we selected, and then we provide specific explanations for each factor.
1) Port development scale
The larger the port is, the more advanced the port facilities are, which leads to higher working efficiency and fewer exhaust emissions. For example, Yokohama Port, which has the highest working efficiency in the world, can reduce engine fuel consumption by 40%-50% and exhaust emissions by 40%-50% by using the container gantry crane with energy storage equipment. Large ports have developed waste gas treatment technology, which can reduce unexpected output. We select port cargo throughput as the proxy variable of the port development scale.
2) The application scale of port emerging technologies.
During a study of Spanish ports, Martínez Moya found that the CO2 emissions from terminal tractors and RTGs were very high [32]. The port adopts shore power technology, which means that when the ship enters the port, it is connected to terrestrial power sources and uses terrestrial power sources to meet its own power needs, which can greatly reduce fuel consumption [33]. For example, for the Ro-Ro passenger ship “China South Korea Star” at No. 59 berth in Lianyungang, all the power consumption of the ship after docking in the port is provided by the shore power system, which no longer requires the operation of auxiliary machines to supply power. The emission of pollutants has been greatly reduced, with a total reduction of 2575 tons of air pollutants. We select the coverage rate of shore power technology as the proxy variable of the application scale of port emerging technology.
Table 3.
Influencing factors table.
3) Environmental regulation.
It is the general expectation of the government and society that environmental regulation can reduce the waste discharge of enterprises and improve the environmental quality of enterprises through policy constraints [34]. The joint implementation of environmental regulation and agglomeration economics is helpful to the improvement of ecological efficiency [35].
As for the measurement of the degree of environmental regulation, the indicators commonly used internationally can be divided into several categories: First, the input indicators, such as relevant staff, environmental protection funds, and pollution control investment. The second is the output indicators, such as the rate of reaching the standard and the reduction of pollutant emissions. Thirdly, it is divided into intermediate input indicators, final input indicators, intermediate output indicators, and final output indicators. In order to facilitate quantification, we select the amount of pollution control investment as the proxy variable of environmental regulation.
4) Economic development level of the port city.
The level of economic development mainly affects environmental efficiency in three ways. The first is the scale effect. Due to the expansion of the economic scale, the investment of additional resources to support its development will exert great pressure on the environment; The second is the structural effect. With economic growth, people’s living standards have been improved, and the public’s consumption concept has also been improved. The change in people’s living needs will promote the optimization of industrial structures, and the development of traditional industries will gradually decline. The emerging environment-friendly industries have more room for development and even gradually occupy the market, thus improving ecological efficiency [36]. The last is the technical effect. Economic development enables more funds to be used in the creation of environmental protection technologies, thereby improving the level of pollution control and environmental quality at the technical level. For example, on November 21, 2006, the Port of Los Angeles announced the environmental protection plan and invested 2 billion dollars in the next five years to purify the port air. We select the GDP of port cities as the proxy variable of the economic development level of the port cities.
5) Industrial structure of the port city.
The changes in urban industrial structure will change the consumption of different energy sources. The carbon emissions caused by energy consumption will also change, resulting in the increase of unexpected output in the region, which will change the Ecological efficiency in the region. The upgrading of industrial structure helps to reduce carbon emissions [37] and improve energy utilization efficiency. Both will have a positive impact on the level of green development in the region. Based on the existing literature, this paper calculates the Secondary sector of the economy and Tertiary sector of the economy as the industrial structure level of the target city in a certain proportion.
Since the port ecological efficiency values of the dependent variables are all greater than 0, we select the Tobit model based on the maximum likelihood estimation method to empirically analyze the factors affecting the ecological efficiency of port groups. The regression equation is as follows:
ρit = β0 + β1 deveit + β2 techit
+ β3 envirit + β4 ecoit + β5induit + ε
In the formula, it means the value corresponding to the ith port in the t period, ρ for the ecological efficiency of the port, βi is the regression coefficient, ε is a random interference term.
Based on the actual situation, we chose the panel data from four ports from 2011 to 2021 as samples, including Shanghai Port, Lianyungang Port, Nanjing Port, and Ningbo Zhoushan Port.
The required data come from various official statistical yearbooks, statistical yearbooks of cities where ports are located, environmental statistical annual reports, and annual reports of ports. For some necessary but unavailable data, we use mathematical models to calculate or go to the local area for data collection.
Results and Discussion
Analysis Results of Super-Efficiency SBM Model
At this stage, we use the input-output index system built above to measure the pure technical ecological efficiency, scale ecological efficiency, and comprehensive ecological efficiency of ports in 2011- 2021 when ignoring the impact of errors. For the purpose of removing the effects of dimension, dimensionless processing is used to process the input-output data. The processed data is between 0.1-1. MaxDEA ultra7 is used to calculate the super-efficiency SBM model, and we obtain the three ecological efficiencies mentioned above. The scale eco-efficiency reflects the operation scale level of the port, the pure technical eco-efficiency reflects the management and system level of the port, and the comprehensive eco-efficiency reflects the overall comprehensive resource allocation of the port.
Scale Eco-Efficiency Analysis
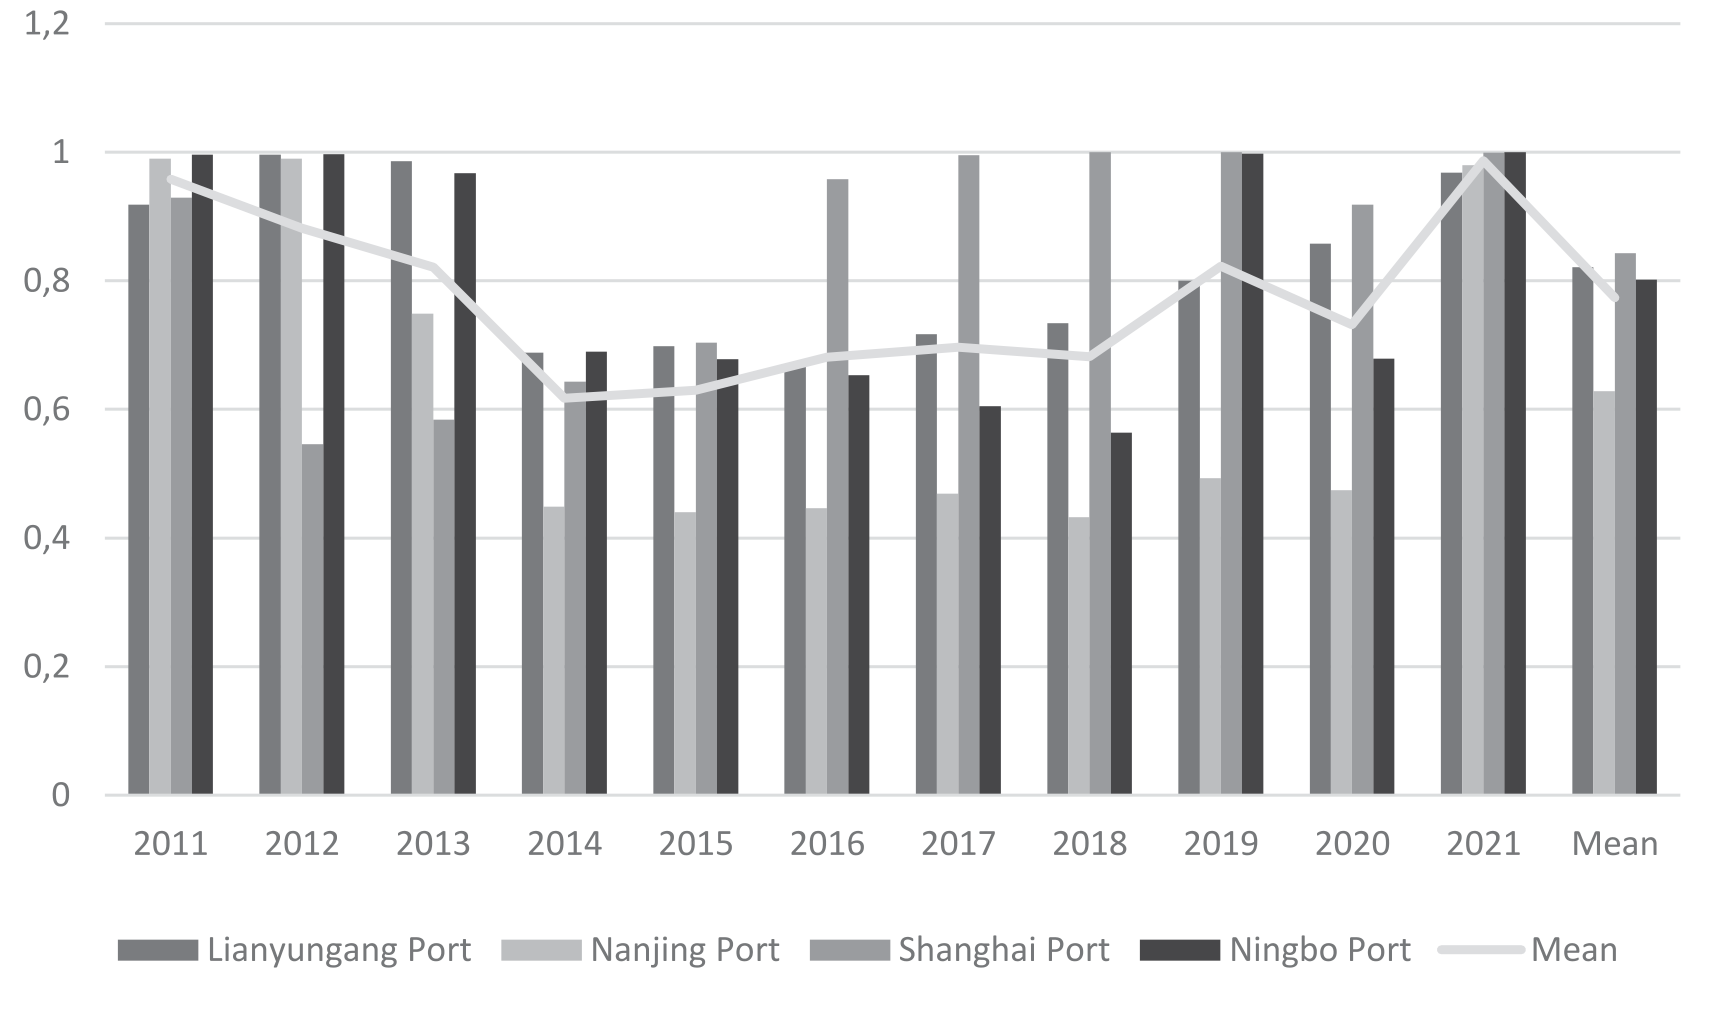
We used the indicator data and MaxDEA ultra7 software to calculate. Through data analysis, the results were shown in Table 4, and further analyzed the data to get the change chart as shown in Fig. 1.
In this paper, scale eco-efficiency refers to the ecological efficiency affected by the scale of enterprises, representing the distance between the actual and optimal production scale. According to Table 4 and Fig. 1, the average scale eco-efficiency of Lianyungang Port, Nanjing Port, Shanghai Port, and Ningbo Port is 0.774, which does not reach the effective level of scale ecological efficiency, indicating that the four ports are still lacking in achieving the optimal production scale. First of all, from the perspective of each port, the annual average scale eco-efficiency value of Shanghai Port ranked first, 0.843, which still did not reach the effective level of scale ecological efficiency. However, it was close to or even reached the effective level of scale ecological efficiency many times in 2011-2021. In 2016-2020, the scale eco-efficiency value of Shanghai Port was far greater than the annual average level, indicating that the enterprise scale was fully utilized. It can do reasonable planning according to the actual development of the enterprise and make the most of the resources required for port production. In 2016, Shanghai Port took the lead in implementing the first phase of measures for the Yangtze River Delta ship emission control area, strictly implementing the ship emission control measures. In 2017, the fully automatic terminal of the Yangshan Deepwater Port Area Phase IV Project was opened for trial operation. This is the largest and most automated port area in the world today. The port containers are operated automatically from the port area loading and unloading to the terminal transportation and storage, and the production operations achieve zero emissions. It has changed the traditional business model of ports, accelerated the business transformation of ports, led the development of smart ports, and achieved great results. The average scale eco-efficiency values of Lianyungang Port and Ningbo Port are 0.821 and 0.802, both exceeding the average level and close to the effective level of scale ecological efficiency, indicating that Lianyungang Port and Ningbo Port have relatively good control over enterprise scale and resource utilization. The efficiency value of Nanjing Port does not reach the average level, and there is a significant gap with the top three ports, which indicates that in the process of ecological development, Nanjing Port needs to think highly of enterprise-scale on its development, avoid blind expansion of enterprise scale, and carry out appropriate planning according to its development level. On the whole, the scale eco-efficiency values of these four ports have developed in a U-shaped over time, which indicates that the blind expansion of port scale without paying attention to the effective use of resources at the initial stage of port construction has led to the reduction of scale eco-efficiency. However, with the continuous enrichment of green development experience in ports, the overall trend is upward, which indicates that each port has gradually found a reasonable development scale to achieve the optimal production scale.
Table 4.
Table of scale eco-efficiency values.
Pure Technical Eco-Efficiency Analysis
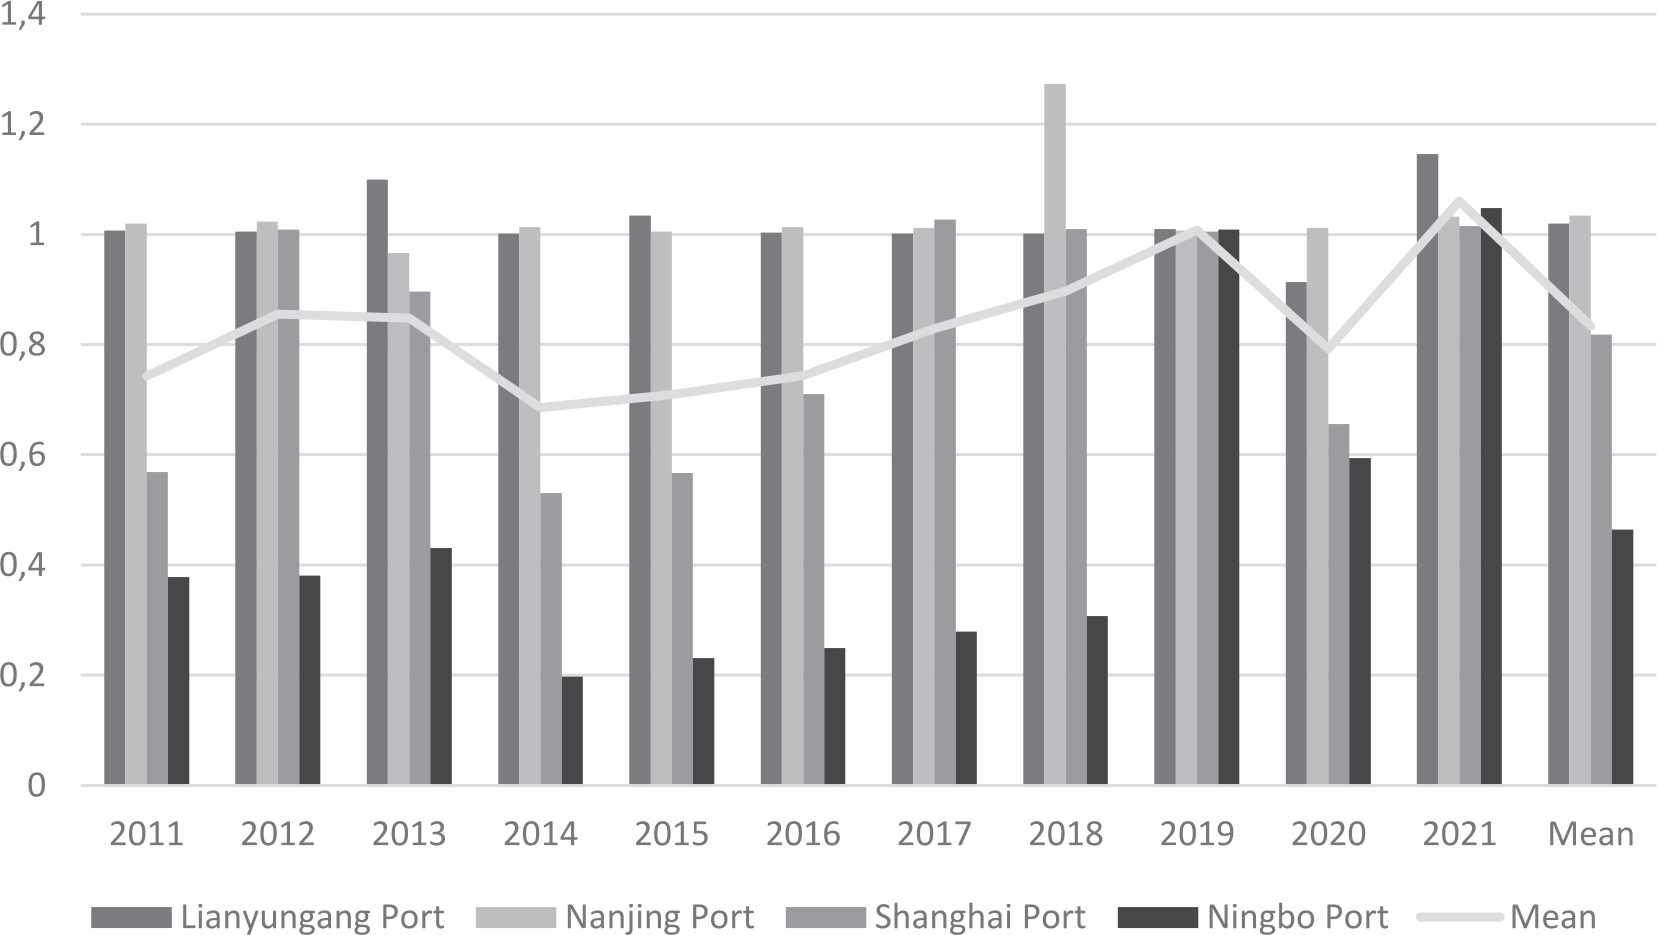
We used the indicator data and MaxDEA ultra7 software to calculate. Through data analysis, the results were shown in Table 5, and further analyzed the data to get the change chart as shown in Fig. 2.
In this study, pure technical eco-efficiency reflects the ecological efficiency brought through the system and management level and is affected by enterprise management and technology. It can be analyzed from Table 5 and Fig. 2 that if external errors are not considered, the average level is 0.834, which is close to the effective level. This figure indicates that Shanghai Port, Lianyungang Port, Nanjing Port, and Ningbo Port can attach importance to their ecological construction in terms of system, management, technology, and other aspects. However, the data is highly volatile, which means that each port still needs to make constant efforts to solve the outstanding problems of the port from the aspects of system and management to push the port to keep approaching from the technical level to the ecological port. However, the volatility of the data is relatively large, which shows that each port still needs to make continuous efforts to solve the outstanding problems in the port from the system, management, and other aspects, to promote the port to be closer to the ecological port from the technical level. First of all, from the perspective of each port, the pure technical eco-efficiency of Ningbo Port is obviously lower than the average level. From 2003 to 2018, the integration process of Ningbo Port was slow, and the status quo of unified management has not yet been formed, which is mainly reflected in the insufficient port service and management capacity, the insufficient level of information management, the unreasonable distribution mode of collection and distribution, the lagging development of railway transportation and inland waterway transportation, and the slow development of enterprise system and management level, which lead to the low pure technical eco-efficiency. Secondly, the pure technical eco-efficiency of Lianyungang Port and Nanjing Port is relatively high, reaching the level of pure technical effectiveness for many years. In 2018, the pure technical eco-efficiency of Nanjing Port reached 1.273. Combined with the port scale, the management system of smaller ports is relatively clear, which can also explain the problems of Ningbo Port.
Table 5.
Table of pure technical eco-efficiency values.
Comprehensive Eco-Efficiency Analysis
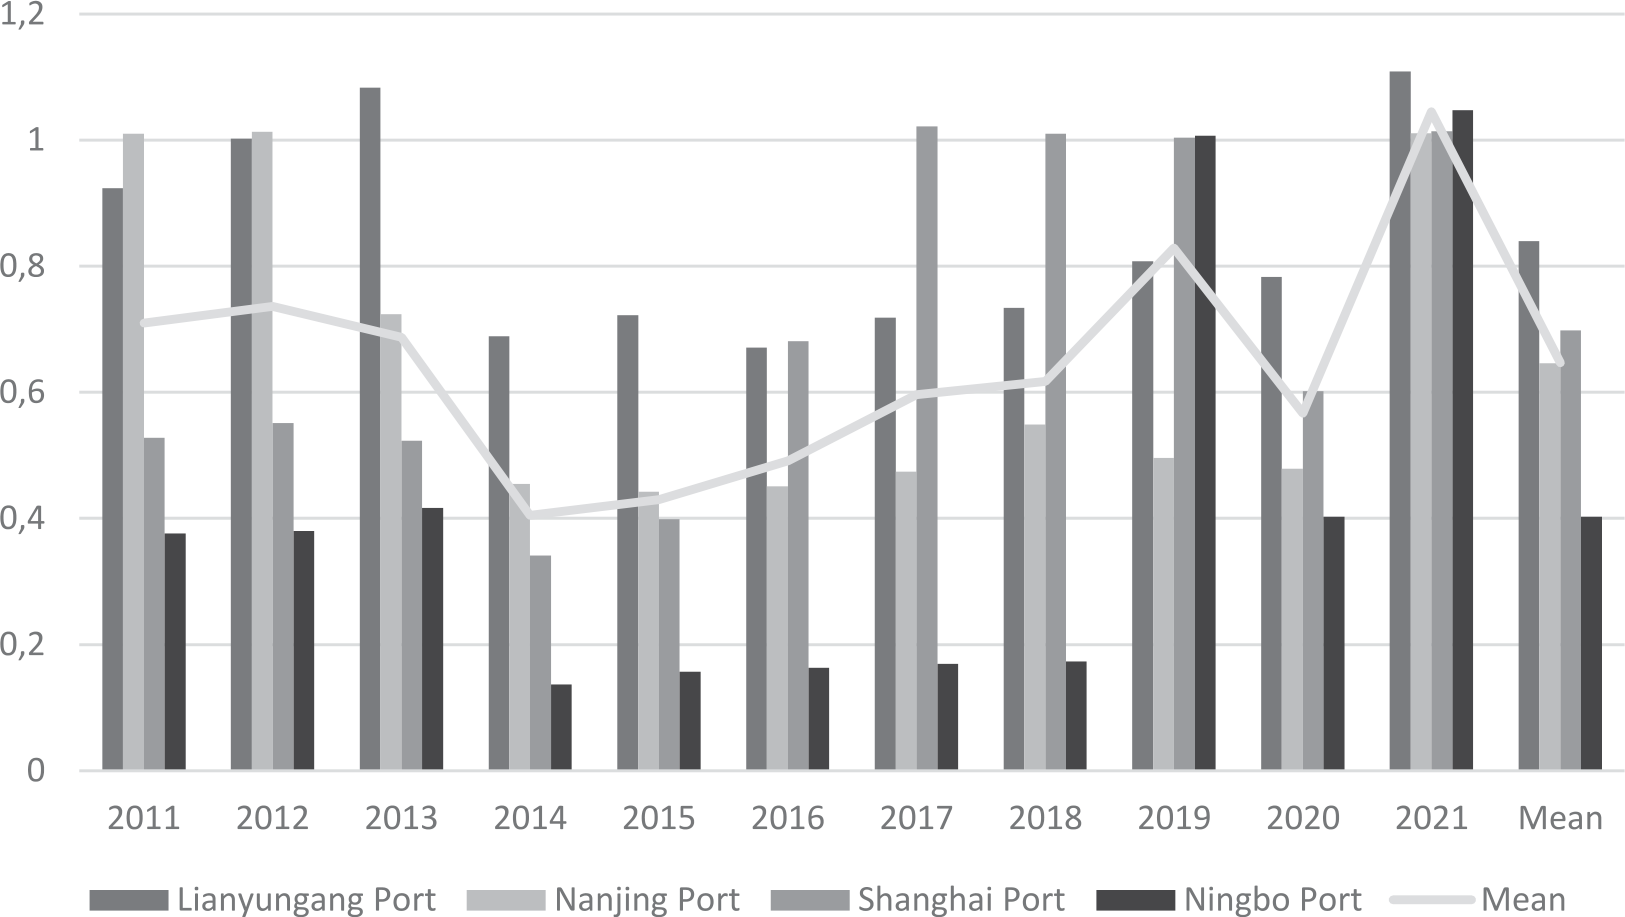
We used the indicator data and MaxDEA ultra7 software to calculate. Through data analysis, the results were shown in Table 6, and further analyzed the data to get the change chart as shown in Fig. 3.
In this study, the comprehensive eco-efficiency reflects the comprehensive ecological efficiency under the overall analysis and balance from the perspective of resource allocation capacity and utilization rate of the research object. It can be analyzed from Table 6 and Fig. 3 that the comprehensive eco-efficiency value is 0.647 without considering the external environmental factors and errors, which does not reach the effective level. The ecological construction of these four ports still has a lot of room for progress. From 2013 to 2016, the shipbuilding industry entered the “winter period”. The price of new ships continued to fall, the cost of raw materials increased significantly, ship owners frequently changed orders, ship enterprises were understarted, and the financing cost was high. These phenomena have resulted in the inability to improve the comprehensive ecological efficiency of various ports in a short period. In 2017, the implementation of the national supply-side structural reform. The implementation of policies started the recovery of the shipbuilding industry, and the comprehensive ecological benefit value of each port had begun to increase. From a single port perspective, the average comprehensive eco-efficiency of Lianyungang Port is 0.840, which is relatively easy to reach an effective level of comprehensive ecological efficiency. Lianyungang Port pays attention to the transformation and upgrading of green ports. In 2011, Lianyungang Port adopted shore power technology for the first time in China and was listed as the first low-carbon demonstration port in China by the Ministry of Transport. In 2021, Lianyungang Port will build the first onshore power storage integrated system in China, leading the use of onshore power technology in the country. Compared with the use of fuel oil, the operation cost of ships during docking can be reduced by about 30%. However, the value fluctuates greatly, indicating that Lianyungang Port still has room for progress in building green ports and improving ecological efficiency by using resource allocation. The overall comprehensive eco-efficiency value of Shanghai Port shows an upward trend, indicating that Shanghai Port is gradually maturing in resource allocation capacity, while the comprehensive eco-efficiency value of Nanjing Port shows a downward trend in fluctuations. The comprehensive eco-efficiency level of Ningbo Port in 2014-2018 was relatively low, which may be due to the sharp reduction of social insurance premiums representing social benefit indicators, resulting in a decrease in expected output, which is reflected in the comprehensive eco-efficiency level.
Table 6.
Table of comprehensive eco-efficiency values.
Tobit Regression Analysis Results
We need to achieve the goal of extracting the main factors that affect the ecological efficiency of the port. Therefore, we need to conduct regression analysis on the variables we select, analyze whether and what impact these variables have, and derive key factors based on their respective weights. Providing policy recommendations to relevant personnel based on key factors can make our research content more objective and useful. We have established a Tobit regression model with the three ecological efficiencies calculated in the above article as dependent variables and several influencing factor variables we selected as independent variables.
Descriptive Statistics
We made simple descriptive statistics on the explained variables and explanatory variables. The results were shown in Table 7.
Correlation Analysis and Collinearity Test
Before regression analysis, we used correlation analysis and collinearity tests to analyze the correlation of explanatory variables. According to Table 8, the correlation coefficient showed that the correlation of all indicators was less than 0.8, indicating that the correlation between indicators was relatively weak. As shown in Table 9, the results of the variance expansion factor VIF test show that these indicators were suitable for regression analysis.
Regression Analysis of Scale Eco-Efficiency
We first standardize the data and then perform regression. The Tobit model was used for regression analysis. The regression results were shown in Table 10.
According to the regression results in Table 10, it could be concluded that CT passed the 10% significance test and GDP passed the 5% significance test, both of which had a positive impact on SE. The scale ecological efficiency will increase with the increase of port scale. It will also increase with the economic development level of port cities. In this paper, scale ecological efficiency reflects the level of port operation scale. So this analysis result is in line with the actual situation. For each increase in CT value by 1, the value of SE will rise by 0.256, and for each increase in GDP value by 1, the value of SE will rise by 0.496. RST passed the 1% significance test, which had a significant negative effect on SE. CSP and IWT failed the significance test, but they had a relatively weak inhibitory effect on SE.
Table 7.
Description statistics.
Table 8.
Pearson correlation analysis.
| CT | CSP | IWT | GDP | RST | |
|---|---|---|---|---|---|
| CT | 1 | 0.065 | .432** | .477** | .503** |
| CSP | 0.065 | 1 | -0.233 | 0.131 | -0.062 |
| IWT | .432** | -0.233 | 1 | .728** | .459** |
| GDP | .477** | 0.131 | .728** | 1 | .709** |
| RST | .503** | -0.062 | .459** | .709** | 1 |
Table 9.
Collinearity test.
| Tolerance | VIF | |
|---|---|---|
| CT | 0.670 | 1.493 |
| CSP | 0.653 | 1.531 |
| IWT | 0.315 | 3.177 |
| GDP | 0.209 | 4.786 |
| RST | 0.393 | 2.547 |
Regression Analysis of Pure Technical Eco-Efficiency
The results of regression after standardization were shown in Table 11.
According to the regression results in Table 11, it could be concluded that CT had passed the 1% significance test and had an obvious inhibitory effect on PTE, indicating that PTE will decrease with the expansion of the port scale. In this paper, pure technological ecological efficiency reflects the level of port management. The difficulty of port management will increase with the expansion of scale. On the contrary, it will reduce the pure technological ecological efficiency, which is consistent with the actual situation. CSP and GDP passed the 10% significance test, both of which had a positive impact on PTE. The value of PTE increases by 0.245 for each increase in CSP, and 0.52 for each increase in GDP. This indicates that the pure technological ecological efficiency of ports will improve with the increase of the scale of emerging technologies. It will also improve with the improvement of the economic development level of port cities. IWT and RST had not passed the significance test, which had a weak impact on PTE.
Table 11.
Pure technical eco-efficiency regression results.
| Variable | Regression coefficient | Standard error |
|---|---|---|
| CT | -0.720*** | 0.130 |
| CSP | 0.245 * | 0.126 |
| IWT | 0.060 | 0.259 |
| GDP | 0.520 * | 0.288 |
| RST | -0.203 | 0.158 |
| Constant | 0.955*** | 0.102 |
Regression Analysis of Comprehensive Eco-Efficiency
The results of regression after standardization were shown in Table 12.
According to the data in Table 12, CT passed the 10% significance test, which had an obvious inhibitory effect on the CE, indicating that the comprehensive eco-efficiency will decrease with the expansion of the port scale. In this paper, the comprehensive ecological efficiency reflects the overall resource allocation of the port. Expanding the scale of ports will result in a waste of resources. This will reduce the comprehensive ecological efficiency of the port, which is consistent with the actual situation. CSP and IWT failed to pass the significance test, which had a weak positive impact on CE. GDP passed the significance test of 5%, which had a clear promotional effect. This showed that CE will increase with the improvement of economic construction in the area where the port is located, and the value of CE will increase by 0.682 every time GDP increases by 1. RST passed the 1% significance test, but it had an obvious inhibitory effect on the comprehensive eco-efficiency of the port.
Conclusions
In this paper, We first used the super-efficiency SBM model and Tobit model to quantitatively calculate the ecological efficiency values of four ports from 2011 to 2021, including Ningbo Port, Shanghai Port, Lianyungang Port, and Nanjing Port. The conclusion of this paper is as follows: Firstly, from the perspective of scale ecological efficiency, the average value of the four ports is 0.774. There is a gap in the effective level of scale, indicating that these four ports have not achieved their optimal production scale. The overall development is in a U-shaped trend, indicating that various ports are gradually finding better production scales through development. The scale and ecological efficiency of Nanjing Port are lower than the average, and it is necessary to comprehensively consider the port scale and its actual development status to improve ecological efficiency. Secondly, from the perspective of pure technological ecological efficiency, the average value of the four ports is 0.834, which is relatively small compared to the effective level. However, the pure technological ecological efficiency of Ningbo Port is relatively low, and it is necessary to solve the problems caused by its management. Thirdly, from the perspective of comprehensive ecological efficiency, its average value is 0.647, which has not reached an effective level. After the “winter period” of the shipbuilding industry in 2013-2016, the shipping market began to recover, and the ecological efficiency of ports began to improve gradually. However, the comprehensive eco-efficiency value only reached the effective level in 2021, but did not reach the effective level in the rest of the year, indicating that ports still need to strengthen their resource allocation capacity to make full use of their resources to improve the ecological efficiency of ports. Then, we used the Tobit regression model to analyze the factors affecting ecological efficiency. The conclusion is as follows: Firstly, the economic development level of port cities has a significant positive impact on the ecological efficiency of ports. Secondly, blindly expanding the scale of ports not only causes a waste of resources but also makes port management more difficult. Both of these will reduce the ecological efficiency of ports. Thirdly, the application of emerging technologies has had a positive impact on the pure technological ecological efficiency and comprehensive ecological efficiency of ports, so the application of emerging technologies can improve the ecological efficiency of ports. The theoretical contributions of this paper are as follows: Firstly, we include social benefits as expected output in the calculation of port ecological efficiency to make the results more accurate. Secondly, we select influencing factor variables that are more in line with the current policy background to make the results more informative.
Finally, we provided some policy recommendations based on our empirical analysis results: Firstly, ports should increase the utilization rate of shore power technology. According to the regression results, the coverage rate of shore power technology has a positive impact on the ecological efficiency of ports. The use of shore power when ships are berthing is the most effective measure to reduce atmospheric pollutants and carbon dioxide emissions during berthing. However, although some ports have high coverage of shore power facilities, they are not in use. On April 7, 2021, the report issued by the Asian Clean Air Center pointed out that “although the completion of the goal of shore power construction is good, the problem that the utilization level of shore power does not meet the standard is still prominent.” The data obtained from the survey in the report found that the shore power utilization rate of cargo ships in the five ports surveyed in 2020 ranged from 3.8% to 54.7%, with an average of 17%, less than 20%. The task of building a low-carbon ecosystem is arduous, so the promotion and application of clean energy still need to be accelerated. The relevant departments in China proposed to “continue to promote the construction of electricity facilities at ports promote the transformation of ship power receiving facilities, and constantly improve the utilization rate of shore power.” Therefore, ports should continue to promote the coverage of shore power facilities and fully utilize them to improve their ecological efficiency. Secondly, ports should plan their scale reasonably. From our empirical analysis of four ports, we can conclude that the ecological efficiency of larger ports is not high. The reason is that the effective utilization rate of resources in port-scale conferences is low and management may encounter problems. Therefore, ports should plan their scale reasonably and strengthen resource utilization, which is an inevitable choice to improve the ecological efficiency of ports. Thirdly, port cities play a role in regional economic radiation to drive port development. According to the analysis results, the economic level of the port cities has a significant positive impact on the ecological benefits of the port. The prosperity of the port city economy can bring a better investment environment and more advanced technology to ports. At the same time, if a city’s economic development is better, then its related infrastructure construction is also more comprehensive. It will have a positive impact on the operation and future planning of ports. Therefore, port cities can play an economic radiation role in driving the development of ports and improving their ecological efficiency.

