

Introduction
The Yellow River (YR), the longest river in China, has been famous as the “Mother River of China” since ancient times. It is the symbol and spiritual home of the Chinese nation. Nevertheless, as a result of the boom in society, the ecological environment (EE) in the middle and lower reaches (MLR) of the YR has been severely damaged and threatened [1]. To protect the EE of the YR Basin, many ecological protection measures have been proposed in the YR’s MLR. The YR’s MLR has rich and diverse landforms, such as rivers, lakes, wetlands, hills, deserts, etc. [2]. These geomorphic landscapes are of great significance for maintaining regional ecological balance and protecting species diversity [3]. However, due to human interference and excessive development, many geomorphic landscapes face the risk of degradation, destruction, and loss [4]. Geomorphic landscape ecological assessment is a comprehensive evaluation method of geomorphic landscape ecosystems. By observing and analyzing the physical characteristics, biodiversity, and ecological functions of the landform landscape, it evaluates the quality of the ecological environment and the sustainable development status of it. By evaluating the ecosystem of the middle and lower reaches of the Yellow River, we can fully understand the impact of natural and human factors on the ecological environment of the Yellow River and provide a basis for the formulation of scientific and reasonable ecological protection policies. On the basis of ecological assessment, ecological space optimization has become a key measure to realize the coordinated development of economic development and ecological protection. Through the rational planning and optimization of the ecological space in the middle and lower reaches of the Yellow River, the benefits of natural resources can be maximized, the anti-interference ability of the ecosystem can be improved, and the harmonious coexistence between man and nature can be realized. Therefore, it is of important theoretical and practical significance to deeply study the ecological assessment and ecological space optimization in the middle and lower reaches of the Yellow River [5]. Currently, many studies concentrate on water resources, soil erosion, and other issues in the YR’s MLR, with relatively few studies about ecology assessing and optimizing ecological space for geomorphic landscapes [6]. Therefore, to fill the relevant gap, it proposes to evaluate the landscape ecology of the YR’s MLR and, on the basis of the analysis results, develop ecological space optimization strategies for the YR’s MLR. It aims to propose targeted protection and management measures through ecological assessment and ecological space optimization of the geomorphic landscape in the YR’s MLR for the restoration and protection of the geomorphic landscape, maintaining the ecology balance and sustainable development (SD) of the region. By studying the ecological assessment of geomorphic landscapes and the optimization of ecological space in the YR’s MLR, scientific basis as well as decision-making support will be provided for the EE protection and SD of the YR Basin.
In the first section, the research elaborates on the current development status of landscape ecology, landscape pattern assessment methods, and ecological space optimization methods. In the second section, a landscape ecology based geomorphological landscape ecological assessment system for the YR’s MLR was constructed. It builds an ecological space optimization method on the basis of landscape ecological assessment in the third section. In the fourth section, the results of landscape ecological assessment and ecological space optimization strategies are presented. The fifth section is the conclusion and prospects for future research directions.
Related Works
With the increasing awareness of environmental protection, there is an increasing amount of research on landscape ecological assessment. To protect soil and water resources and landscape ecology, Freyer et al. utilized a universal evaluation algorithm derived from fuzzy logic to construct a potential impact analysis model for agricultural land ecosystems. This model can summarize risk categories, quantify potential risks and impacts, and provide corresponding explanations [7]. The method of comparing responses between different scales also lacks the characteristics of biological variables and landscape attributes. Atlantic et al. constructed a correlation matrix of landscape features on the basis of biological response variables to analyze the effectiveness of this method. The results indicate that the correlation matrix can reflect the ecological situation of spatial or temporal patterns caused by multiple interrelated factors [8]. To manage forest landscape patterns, Ramalingam et al. proposed the process of analyzing ecosystems using insect community distribution as well as carrying out the relevant analysis. The results indicate that changes in the distribution of insect communities can be explained by spatially relevant habitat characteristics, which has certain feasibility [9]. To quantify the driving force of evapotranspiration dynamics, Yu et al. proposed using a surface energy balance system to construct a spatiotemporal dynamic analysis model of evapotranspiration and conducted empirical analysis on this model. The results indicate the positive impact of the aggregation index of the model on evapotranspiration dynamics [10]. To ensure the SD of cities, Wang et al. proposed the construction of a grain energy water impact model and conducted empirical analysis on this model. The results indicate that the spatiotemporal variation of the water system of megacities is closely related to rice production and energy [11].
With the progress of society, research on ecological space optimization has become a popular research direction. To construct strategies for optimizing food production and biodiversity, Segre constructed a mixed planting landscape simulation model on the basis of positive feedback from ecosystem services and conducted an effectiveness analysis on the model. The results indicate that the optimization effect is related to crop type and not to landscape or ecosystem configuration [12]. To verify the effectiveness of fish stocking and fishing methods in optimizing the Dior ecosystem, Johnston et al. proposed a comprehensive model for freshwater recreational fisheries and predicted their physical, social, and economic performance. The results indicate that in aquaculture based fisheries, proliferation, and release can generate significant benefits [13]. To investigate the impact of reproductive interference on the phenotypic convergence of species with different defense levels, Grégoire et al. proposed a deterministic model on the basis of ecological purification to simulate it. The results indicate that reproductive interference can limit the convergence effect of mimetic interactions [14]. Zhou and Peng proposed an ecosystem service optimization model on the basis of hybrid cellular automata and Bayesian networks to address the issue of not considering variable complexity and uncertainty in ecosystem service optimization methods and conducted land use (LU) simulation research on this model. The results indicate that the design of ecological protection scenarios can maintain and improve regional ecosystem services and functions [15]. To explore the impact of plant size on the spatial patterns generated by insect host relationships, Tian et al. conducted empirical research by combining distance index spatial analysis and spatial point pattern analysis. The outcomes demonstrate that the degree of aggregation of white wax trees at the landscape scale is much higher than that at the stand scale [16].
According to existing literature research, from the perspective of research topics, various studies focus on environmental protection, water and soil resource protection, and the sustainable development of the ecosystem. Secondly, from the perspective of research methods, these studies use a variety of models and analytical means. Among them, fuzzy logic, the correlation matrix, and the ecosystem service model are widely used. At the same time, these studies have not only focused on the state and function of ecosystems, but also on the economic, social, and resource utilization aspects closely related to human activities. This multidimensional, comprehensive analysis contributes to a deep understanding of the interaction between the ecosystem and human society and provides a more comprehensive perspective for the realization of ecological and human symbiosis. In addition, different studies adopt different strategies and methods for the study of ecological space optimization. For example, Segree performs ecological space optimization based on a mixed planting landscape simulation model, and its results show that the optimization effect is related to the crop type. This suggests that differentiated strategies should be developed according to specific ecosystem characteristics and objectives in ecological space optimization. Finally, these studies provide the validity and validation of various models and methods through empirical analysis, providing experience and inspiration for future similar studies. However, it is also important to note some limitations in different studies, such as sample limitations and model parameter settings, which may affect the generalizability of the study.
Construction of the Landscape Ecological Assessment System for Landform Landscape in the MLR of the YR Based on Landscape Ecology
To promote ecological protection and SD in the YR’s MLR, it builds a landscape ecological assessment system to comprehensively evaluate the landscape ecology in the YR’s MLR.
Building of the Landscape Ecological Health Assessment System on the basis of PSR
The YR is known as the mother river of China. The landscape in the YR’s MLR is rich and diverse, including undulating mountains, vast plains, winding rivers, etc., forming a unique and diverse natural ecological landscape. However, with the continuous expansion of society’s activities and the acceleration of economic development, the landscape ecology of the YR’s MLR is facing increasingly severe challenges [17]. One of the primary challenges is the change in land use structure. With urbanization and agricultural expansion, large areas of natural ecology are transformed into farmland or urban areas, leading to a serious break in the original ecological balance. At the same time, the inevitable effects of human activities, including excessive agricultural practices, overgrazing, and industrial emissions, accelerate soil erosion, water pollution, and the destruction of ecosystem structures. Landscape ecology can provide a comprehensive and reliable basis for the formulation of scientific ecological protection policies and sustainable development strategies by deeply studying the surface characteristics, species distribution, ecological processes, and human activities in the middle and lower reaches of the Yellow River. The study will comprehensively evaluate the landscape ecology of the YR’s MLR using theories as well as methods about landscape ecology [18]. The content of landscape ecology includes landscape structure, function, and change. The study evaluates the landscape ecology of the YR’s MLR from the perspective of landscape pattern, process, and scale. The Pressure State Response (PSR) model is an environment issue analysis problem that considers environmental issues as the result of the interaction of three elements: pressure, state, and response. It is extensively utilized in fields such as environmental management, SD, and policy formulation. In the PSR model, stress refers to HA, or natural factors, that have an impact on the environment, such as population growth and urbanization. State refers to the actual condition or quality of the environment, such as biodiversity. Response refers to positive actions or policies taken on environmental issues, including government laws and regulations, environmental protection measures, etc. Due to the complexity of the geomorphic landscape in the YR’s MLR, it builds a landscape ecological health indicator evaluation system on the basis of the PRS model, on the basis of the principles of science, system, and comprehensiveness, and on the basis of the PSR model. In addition, the research also uses the expert scoring method to analyze the indicators in the landscape ecological health index evaluation system and uses the experience and knowledge of the experts to let the experts score the importance of each index through the expert questionnaire survey and expert meeting. Finally, the weights of each index are calculated by the average value method. The evaluation system for landscape ecological health indicators on the basis of the PSR model proposed in the study is showcased in Table 1.
Table 1 shows that the study conducted a systematic evaluation of the landscape in the YR’s MLR from three criteria levels: pressure, state, and corresponding factors. The pressure layer includes four indicators: population density, land reclamation rate, intensity of human influence, and terrain fragmentation. Population density refers to the quantity of people per unit area or volume. The relevant formula is demonstrated in Equation (1).
In equation (1), Pα represents the population per unit area α ; A serves as the total land area. The land reclamation rate serves as the degree of LU in a region or country, which is the proportion of the developed and utilized land area to the total land area. Its calculation formula is shown in Equation (2).
In equation (2), R represents the land reclamation rate; A represents the land area; C A represents the area R of cultivated land. The Human Impact Intensity Index is an indicator that measures the degree of influence of HA on the nature circumstance. It reflects the degree of change and destruction resulting from HA on the natural environment. The relevant formula is demonstrated in Equation (3).
In Equation (3), H represents the intensity index of human influence. Fractional Vegetation Cover (FVC) refers to the coverage or proportion of plants on a certain area or surface, reflecting the density and distribution of vegetation. This study calculates it using the Normalized Difference Vegetation Index (NDVI). NDVI is a remote sensing calculation index on the basis of vegetation reflection characteristics, which can reflect the growth status and coverage of vegetation. The calculation formula for NDVI is shown in Equation (4).
Table 1.
Landscape ecological health index evaluation system.
In equation (4), B represents the approximate 1 infrared band of the remote sensing satellite image; B is the infrared band of the remote sensing satellite 2 image, with a value between [-1,1]. The calculation formula for FVC is shown in Equation (5).
In equation (5), NDVIsoil represents the value without vegetation cover; NDVIveg represents the NVDI value of vegetation cover.
The calculation formula for Net Primary Production (NPP) of vegetation is shown in Equation (6).
In Equation (6), x serves as the position of vegetation; t represents the research time; ε shows the efficiency at which unit light energy is utilized by vegetation. Land surface temperature (LST) is often measured by ground meteorological stations, satellite remote sensing, and Earth observation sensors, and its calculation is shown in Equation (7).
In Equation (7), Tb is the brightness temperature observed by remote sensing; λ represents the central wavelength of the infrared band; ρ is a constant, 1.438 × 10⁻². Ecological System Services Value (ESV) refers to the various benefits and values provided by natural ecosystems, including both material and non-material aspects. The relevant formula is showcased in equation (8).
In Equation (8), Ai serves as the area of LU type i ; VC serves as the unit ecosystem service value of LU i type.
Landscape Pattern Evaluation System for the YR’s MLR
The Markov transition matrix is a probability matrix used for describing Markov chains, which is usually an n n square matrix. Markov transfer matrices have * wide applications in many fields, including natural language processing, machine learning, finance, and biology [19]. By analyzing the transfer matrix, the development trend of land types can be understood. In LU change, the n of the Markov transfer matrix represents the number of LU types in the study area [20]. Each element of the matrix represents the probability of a certain LU type being converted to another LU type. The relevant formula is shown in Equation (9).
In Equation (9), S represents the area transferred ij from LU type i to LU type j . In addition, the study also uses dynamic degree to quantify the dynamic changes in LU, and the relevant calculation is shown in Equation (10).
In Equation (10), K represents the dynamic degree of LU for a single type; T represents the time span of land type change; A and a A serve as the land b area in the early and late stages of T The formula for calculating the comprehensive LU efficiency is shown in Equation (11).
In Equation (11), LU represents the land area of i Class i land; ∆LU −i j represents the change in land area from Class i land to Class j land. However, due to the differences in characteristics, dimensions, and units between different indicators, to ensure that each indicator can accurately reflect the characteristics and changes of the research object, the study uses the range method to standardize the indicators. The normalization calculation formula for positive indicators is shown in Equation (12).
In Equation (12), x serves as the actual value; ' x'min represents the minimum value; x'max represents the maximum value. The normalization calculation formula for negative indicators is shown in Equation (13).
In the landscape ecological health evaluation system, due to the varying degrees of influence of each indicator, to scientifically and systematically reflect the degree of influence of each indicator, this study uses the combination weight optimization method of minimum relative information entropy to establish the weights of each indicator; The relevant calculation is showcased in Equation (14).
In Equation (14), A represents subjective weighting; j E represents objective weighting. The comprehensive j index method is utilized for calculating the landscape ecological health evaluation system established in the study. The relevant calculation is showcased in Equation (15).
In Equation (15), Z represents the comprehensive evaluation value; wi represents the weight of the indicator; yi represents the standardized indicator value. In addition to analyzing the landscape in the YR’s MLR using LU types, the study also quantitatively calculates the landscape structure and spatial characteristics using the landscape pattern index. The landscape pattern index is a quantitative indicator used for describing and measuring the characteristics of landscape patterns. This study analyzes the spatial structure and organization of the landscape and obtains information on the number, size, shape, distribution, connectivity, and other factors of internal patches in the scenic area. The landscape pattern research system constructed in this study includes patch density, maximum patch index, landscape diversity index, separation index, and other relevant indices. The landscape index patch density is an indicator used by landscape ecology to measure the number of patches of different shapes and sizes within a research area, representing the degree of fragmentation of the landscape. The maximum patch index serves as an indicator in landscape ecology. Its purpose is to calculate the percentage of the largest patch in the overall landscape area of a given research region. This calculation reflects the size and relative significance of the most extensive patch in the landscape. The Landscape Diversity Index, known as the Shannon Diversity Index, reflects the diversity of the landscape by calculating the proportion and degree of diversity of various patch types in the entire landscape. The closer it gets towards 1, the more uniform the patch types in the landscape, and the higher the diversity. The closer it gets towards 0, the more concentrated the types of patches in the landscape, and the lower the diversity. The separation index is the ratio of a certain type of distance index to its area index, used to evaluate the degree of separation of different landscape types and the HA’s influence on landscape patterns. The scatter parallel index measures the degree of mixing and proximity between different landscape elements, reflecting whether a certain landscape has artificial landscape characteristics. The spread index measures the spread and expansion ability of different landscape elements. A higher contagion index suggests greater habitat fragmentation in the landscape, while a lower contagion index indicates a more continuous habitat with good connectivity in the landscape. The landscape shape index is calculated by dividing the boundary length of a landscape element by the square root area of that element. It is utilized for describing the complexity and heterogeneity of the shapes of landscape elements. The aggregation index determines the level of clustering of landscape elements by calculating the proportion of shared boundary length between adjacent areas to the total boundary length. The landscape cohesion index is calculated by measuring the spatial relationships between landscape elements. A higher cohesion index indicates strong connectivity and correlation between landscape elements, while a lower cohesion index indicates weak connectivity and correlation between landscape elements. These indices can be utilized to offer a description of landscape pattern characteristics.
Construction of the Ecological Space Optimization Method Based on Landform Landscape Ecological Assessment
To optimize the ecological space in the YR’s MLR, it proposes an ecological space optimization method based on the results of the landscape ecological assessment. The aim is to provide a scientific basis and decision-making support for ecological protection and SD in the YR’s MLR.
Data Source and Digital Elevation Model Construction
The YR is China’s second-longest river and an important economic, cultural, and transportation artery. As a result, the YR’s MLR have become important agricultural production areas and industrial bases in China. The YR’s MLR are located in the central and western regions of China, mainly including provinces such as Henan, Shanxi, Shaanxi, Shandong, and Hebei. The specific geographical location of the YR’s MLR is in cities and regions such as Kaifeng, Zhengzhou, Luoyang, Taiyuan, Yuncheng, Xi’an, Weinan, Tongguan, and Qinhuangdao, which flow through the main stream of the YR. The geographical location of the YR’s MLR is approximately between 110°-120° E and 33°-40° N.
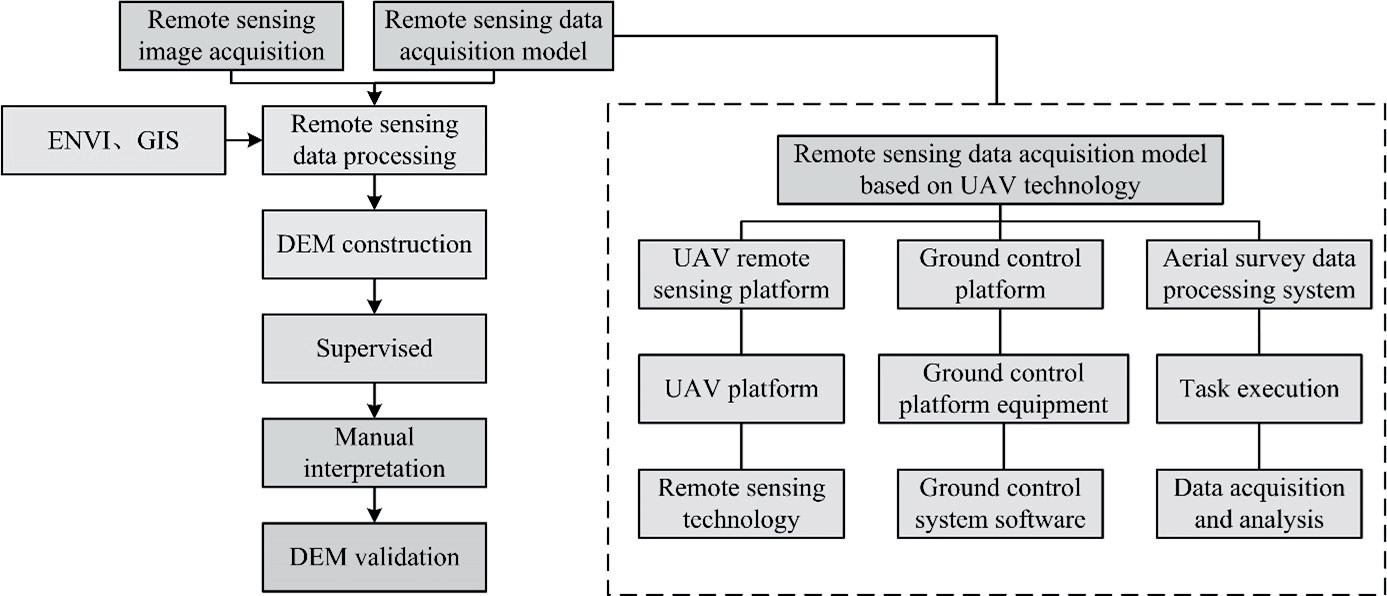
The YR’s MLR refers to the area from the Weiyuan in Gansu to the mouth of the Shandong River. The terrain and landforms of this region are complex and diverse, including high mountains, plateaus, hills, basins, plains, etc. Among them, the Henan Yubei Basin, the Shandong Peninsula, and the Beijing Tianjin region are well-known types of landforms. These areas have relatively low terrain and are mostly flat alluvial plains and lakes within the basin, making them suitable for agriculture and population settlement. The terrain and topography of the YR’s MLR have had an essential influence on its economy, agriculture, and population distribution. To accurately and scientifically explore the landscape pattern of the YR’s MLR, this study is based on drone remote sensing technology to construct a Digital Elevation Model (DEM) for the YR’s MLR. DEM is a three-dimensional terrain surface model. In landscape ecological assessment, digital elevation models are widely used to analyze terrain features, hydrological processes, LU, and ecosystem services. The DEM construction method proposed in the study for the YR’s MLR is shown in Fig. 1.
Fig. 1 showcases that the study first utilized geospatial data clouds and the EarthExplorer-USGS platform to extract remote sensing image data from the YR’s MLR from 2000 to 2015, with the same extreme data being used for remote sensing data. In addition, to obtain remote sensing images of the YR’s MLR this year, it built a remote sensing data collection model on the basis of drone technology. This model consists of a low altitude unmanned aerial vehicle remote sensing platform, a ground control platform, and an aerial survey data processing module. The drone remote sensing platform combines drone technology and remote sensing technology, which can achieve high-resolution, high-precision, and efficient acquisition of surface information. The selected drone for this study is the Avain-P fixed wing drone, which has the advantages of high endurance, fast flight speed, and functional payload. The remote sensing payload carried on the drone is a high-resolution optical camera, and the camera model selected for this study is the SONY ILCE-7R. On the unmanned aerial vehicle remote sensing platform, this study conducts command operations on the ground control platform for unmanned aerial vehicles. Aerial photography is carried out using remote sensing payloads carried by drones, collecting surface images, thermal infrared data, and recording parameters such as position, attitude, and altitude. Subsequently, the collected remote sensing data is transmitted to the aerial survey data processing system through wireless transmission or storage media through the transmission system for subsequent data processing and analysis. The unmanned aerial vehicle ground control platform includes ground control platform equipment and ground control system software. In the unmanned aerial vehicle ground control platform equipment, this study can survey the drone in real-time, flexibly adjust flight parameters, and use wireless communication technology to command and control the drone. The drone ground control system software ensures the execution of drone flight tasks and the acquisition of image data. Before drone flight and image data acquisition, research requires some preparation operations, including determining the route, designing route parameters, and selecting takeoff and landing sites. Subsequently, the study utilized drones to obtain aerial image data from the survey area, accurately located it with Google Earth, and obtained an impact on the survey area under good weather conditions. Subsequently, the study utilized the Environment for Visualizing Image (ENVI) and Geographic Information System (GIS) to interpret remote sensing data. This is to achieve the recognition and interpretation of geographical objects in the image and then complete the classification of land features, namely cultivated land, construction land, forest land, grassland, and water body types. However, the quality of DEM in the YR’s MLR has a direct impact on the research results, therefore, the study also conducted quality analysis on the constructed DEM.
Optimization Method for Ecological Space in the MLR of the YR
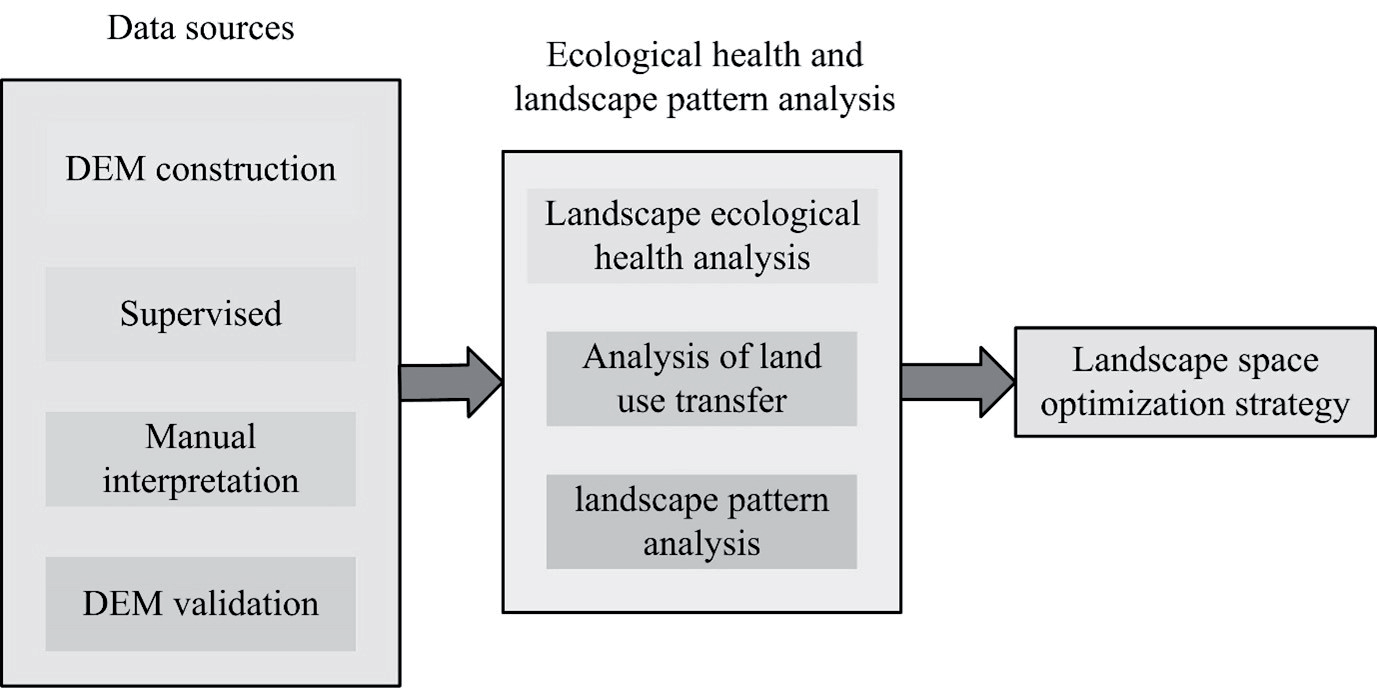
Due to the influence of HA and natural factors, the landscape pattern in the YR’s MLR was subjected to a certain degree of damage and disruption. For protecting and restoring the EE in the YR’s MLR and scientifically and effectively optimizing the landscape pattern of the YR’s MLR, this study constructs the principle of spatial optimization. Firstly, the optimization of landscape patterns in the YR’s MLR should be on the principles of integrity. The study regards the YR’s MLR as an ecosystem rather than just optimizing local landscapes. By comprehensively considering the landscape characteristics of different regions and ecological functions, a comprehensive landscape pattern can be established to maximize the stability and functionality of the ecosystem. Secondly, the optimization of landscape patterns should also pay attention to the principle of diversity, that is, to preserve and restore the diversity of the original ecosystem as much as possible. By protecting and restoring different types of ecosystems, such as wetlands, forests, and grasslands, it is possible to provide appropriate habitats for the survival and reproduction of various biological species, thereby increasing the stability of the ecosystem. Finally, landscape pattern optimization should follow the principle of sustainability, that is, the optimized landscape pattern should be able to meet human needs and have long-term sustainability. In addition, when optimizing the landscape pattern of the YR’s MLR, the study also considers natural factors in the region, such as terrain and hydrological characteristics. By utilizing terrain and hydrological characteristics reasonably, the rational allocation and utilization of water resources could be reached, wetland and river ecosystems could be protected and restored, and the EE quality of the region could be enhanced. The ecological space optimization method for the YR’s MLR, on the principles of integrity, diversity, and sustainability. The method of ecological space optimization in the middle and lower reaches of the Yellow River is shown in Fig. 2.
As shown in Fig. 2, this study regards the landscape pattern of the YR’s MLR as a system and, while maintaining its ecological function, through reasonable landscape planning and design. This is to increase the richness of landscape types and structures and achieve SD in the YR’s MLR. Firstly, the study will conduct a detailed analysis of remote sensing data in the YR’s MLR from 2000 to 2020 and construct a digital elevation model. Subsequently, the study was on the basis of DEM to evaluate and analyze the ecological health status, landscape pattern, and LU situation in the YR’s MLR. By analyzing the results, the study diagnoses the problems in the landscape pattern of the YR’s MLR, such as small landscape patches, unreasonable shapes, and poor connectivity. In response to the discovered problems, this study proposes corresponding spatial optimization strategies on the basis of setting optimization goals. If the landscape patches in the YR’s MLR are too small, the shape is unreasonable, and the connectivity is poor, this study can adopt optimization operations such as merging, segmentation, and recombination to solve these problems. Finally, on the basis of the formulated spatial optimization strategy, this study will plan and adjust the existing space in the YR’s MLR, optimizing the landscape pattern of the YR’s MLR, This is to achieve excellent development and promote sustainable utilization in the ecosystem.
Landscape Ecological Analysis Results and Ecological Space Optimization Strategies in the MLR of the YR
This study verifies the effectiveness of DEM in the YR’s MLR and analyzes the landscape ecology in the YR’s MLR. This is to construct an ecological space optimization strategy for the YR’s MLR. The study first utilizes drone remote sensing technology to construct a digital elevation model for YR's MLR. Subsequently, based on the landscape ecological assessment system and digital elevation model, the ecological health status, landscape pattern, and land use situation of YR's MLR were evaluated and analyzed. By analyzing the results, this study diagnoses the problems existing in the landscape pattern of the YR's MLR and proposes corresponding spatial optimization strategies.
Landscape Ecological Analysis and Evaluation Results in the MLR of the YR
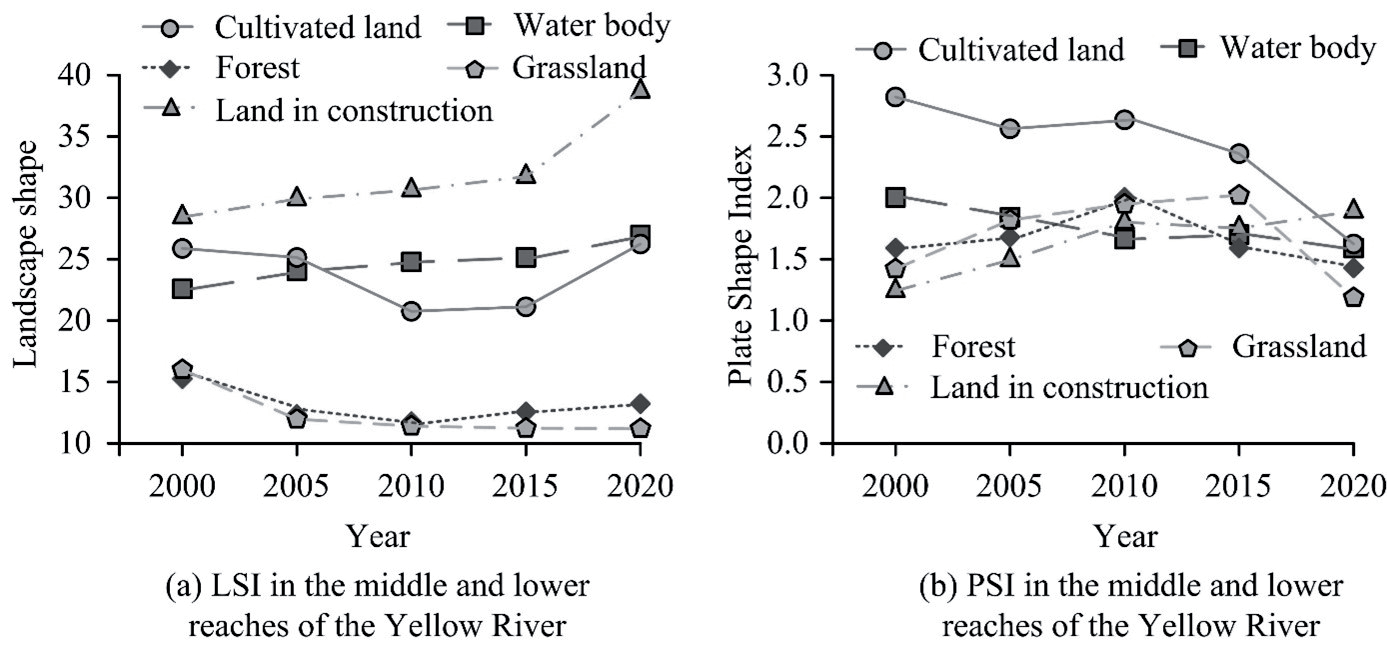
To diagnose the problems of landscape ecology in the YR’s MLR, this study is based on the geomorphic landscape ecological assessment system and analyzes the landscape ecology in the YR’s MLR. Due to limitations in the length of the article, this study selected some indicators as representative analysis results. The study evaluates the landscape ecology of the YR’s MLR from the ecological perspective of overall landscape ecology, LU transfer, and landscape types. The analysis results of landscape fragmentation, aggregation, and diversity in the YR’s MLR are showcased in Fig. 3.
Fig. 3a) shows the changes in patch density and edge density of the landscape in the YR’s MLR. As shown in Fig. 3a), the patch density and edge density in the YR’s MLR showed an upward trend from 2000 to 2005, a downward trend from 2005 to 2015, and a sudden increase in the upward trend from 2015 to 2020. The patch density increased from 0.83 to 1.36, and the edge density increased from 21.1 to 24.6. Fig. 3b) showcases the variations in the spread index and aggregation index of the landscape in the YR’s MLR. Fig. 3b) demonstrates that the fluctuation trend of the spread index and aggregation index in the YR’s MLR between 2000 and 2015 is the same. From 2015 to 2000, however, the landscape spread in the YR’s MLR suddenly increased, and the landscape aggregation suddenly decreased. This indicates that the patches of the landscape in the YR’s MLR are gradually dispersed, and the ability to spread to other landscapes is enhanced, resulting in increased fragmentation of the landscape. Fig. 3c) shows the landscape diversity changes in the YR’s MLR. Fig. 3c) indicates the Shannon diversity in the YR’s MLR showed an overall downward trend, reaching 0.81 in 2020, indicating a decrease in landscape heterogeneity in the YR’s MLR. The analysis results of landscape shape and patch shape index in the YR’s MLR are showcased in Fig. 4.
Fig. 4 a) shows the analysis results of the landscape shape index in the YR’s MLR. Fig. 4a) illustrates that the shape index of grassland landscape shows a decreasing trend in arable land, water bodies, construction land, forest land, and grassland landscape, reaching 10.6 in 2020. Fig. 4b) shows the analysis results of patch shape index in the YR’s MLR. Fig. 4b) demonstrates that the patch shape indices of arable land, water bodies, forest land, and grassland showcased a decreasing trend from 2015 to 2020, reaching 1.5, 1.5, 1.4, and 1.1, respectively, in 2020. On the basis of the above analysis results, it can be concluded that the shape of grassland patches has transformed from irregular to regular and is showing an expanding trend. The emergence of grassland patch expansion indicates that the restoration of farmland to forests and the construction of urban green spaces in the YR’s MLR have achieved results. This research did not further study the landscape ecology of the YR’s MLR. Then, the study analyzed the level index of forest land and grassland, and the changes in the level index of forest land and grassland types in the YR’s MLR are demonstrated in Fig. 5.
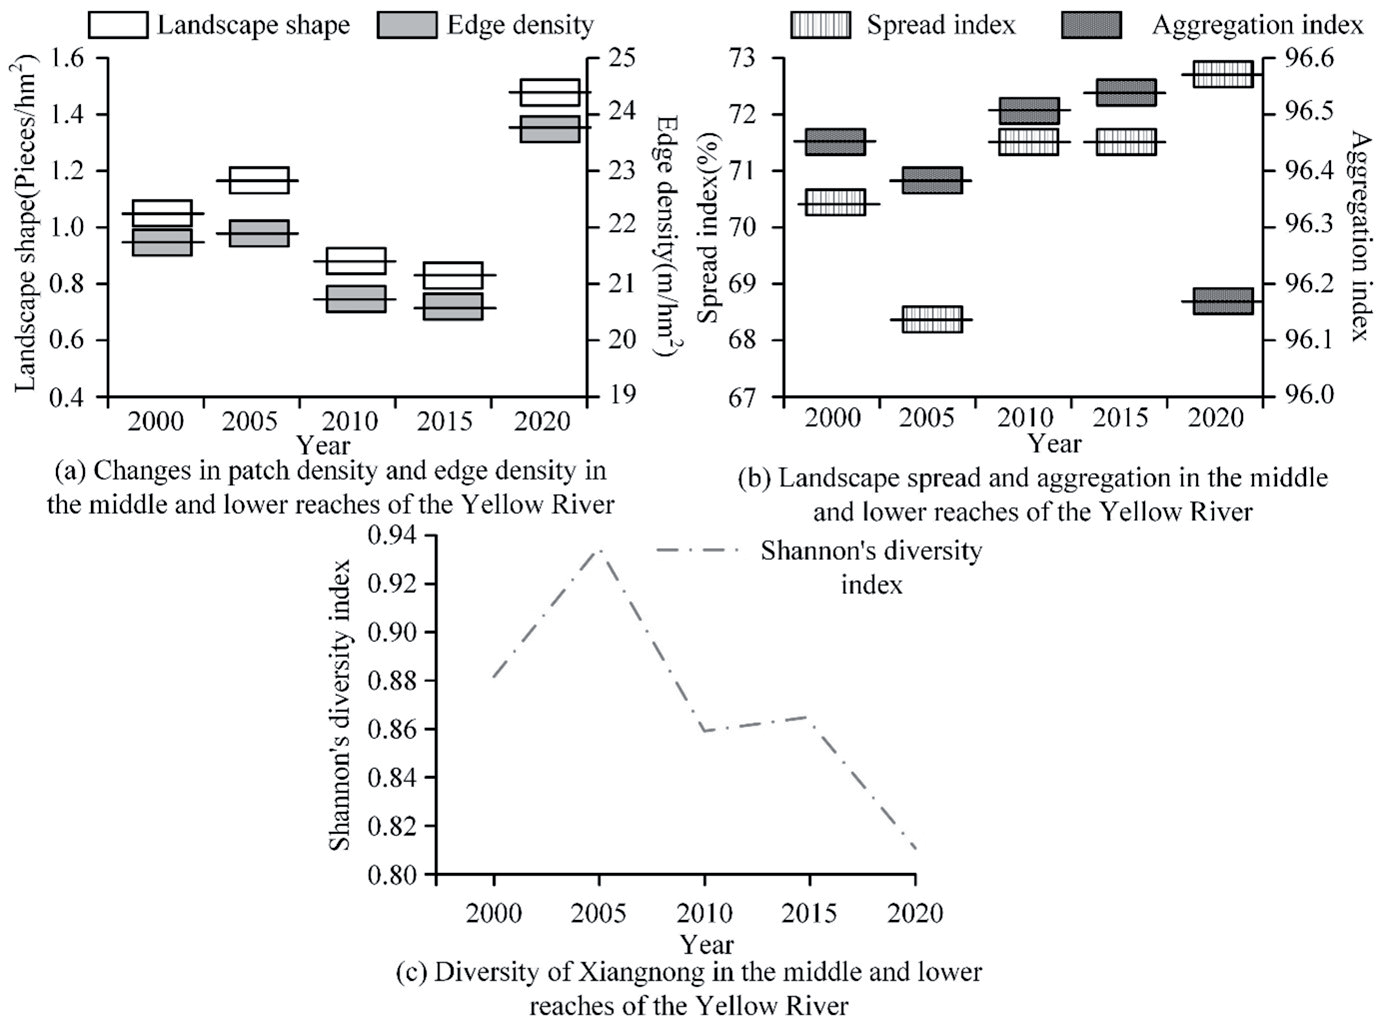
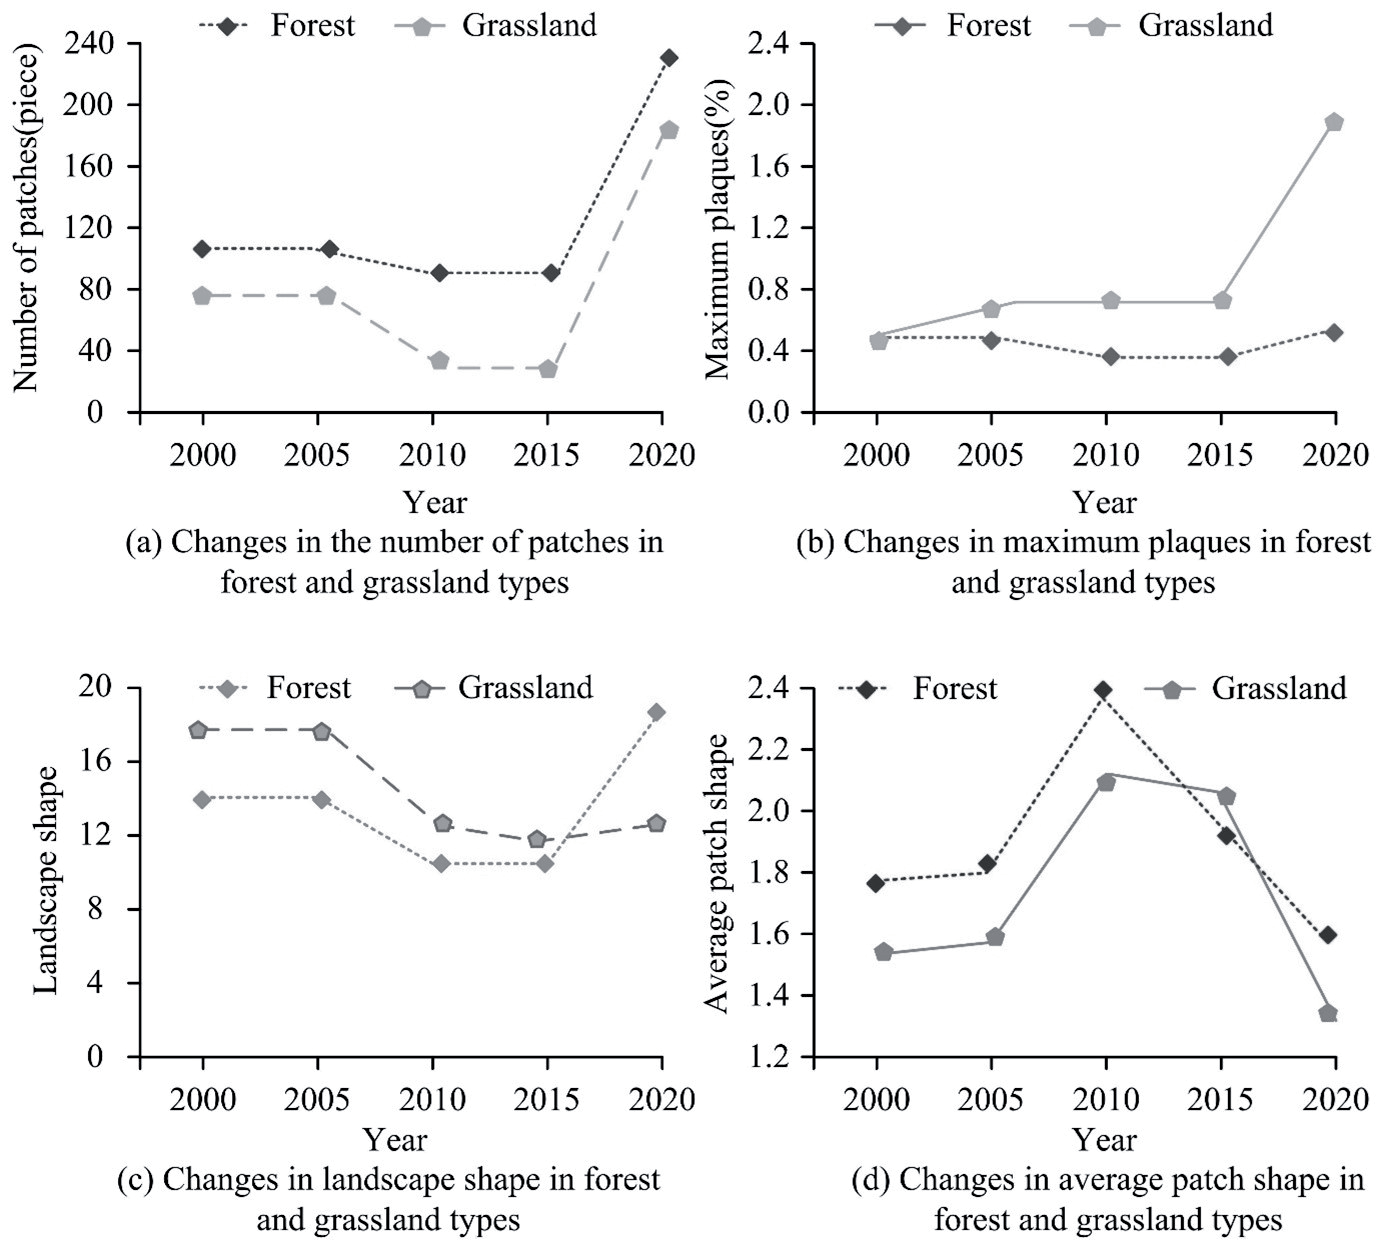
Fig. 5 a) shows the trend of the number of patches in woodland and grassland types. As shown in Fig. 5a), during the period of 2000 and 2020, the number of woodland and grassland patches rose, reaching 239 and 189 in 2020, respectively. Fig. 5b) shows the maximum patch trends for woodland and grassland types. As shown in Fig. 5b), from 2000 to 2020, the maximum patches of grassland types in the middle and lower reaches of the Yellow River showed an increasing trend, reaching 2.1% in 2020, but the maximum patches of woodland types showed little change, reaching 0.5% in 2020. Fig. 5c) shows the trend of patch shape for woodland and grassland types. As shown in Fig. 5c), between 2000 and 2020, the patch shape of woodland and grassland types in the middle and lower reaches of the Yellow River fluctuated greatly, and their patch shape was gradually irregular. Fig. 5d) shows the trend of mean patch shape for woodland and grassland types. As shown in Fig. 5d), from 2000 to 2020, the patch shape of woodland and grassland types in the middle and lower reaches of the Yellow River fluctuated greatly, and the distribution uniformity decreased, the difference increased, and the fragmentation degree increased. The reason for this phenomenon may be related to the destruction of landscape ecology by human activities in the middle and lower reaches of the Yellow River.
Optimization Strategies for Ecological Space in the MLR of the YR
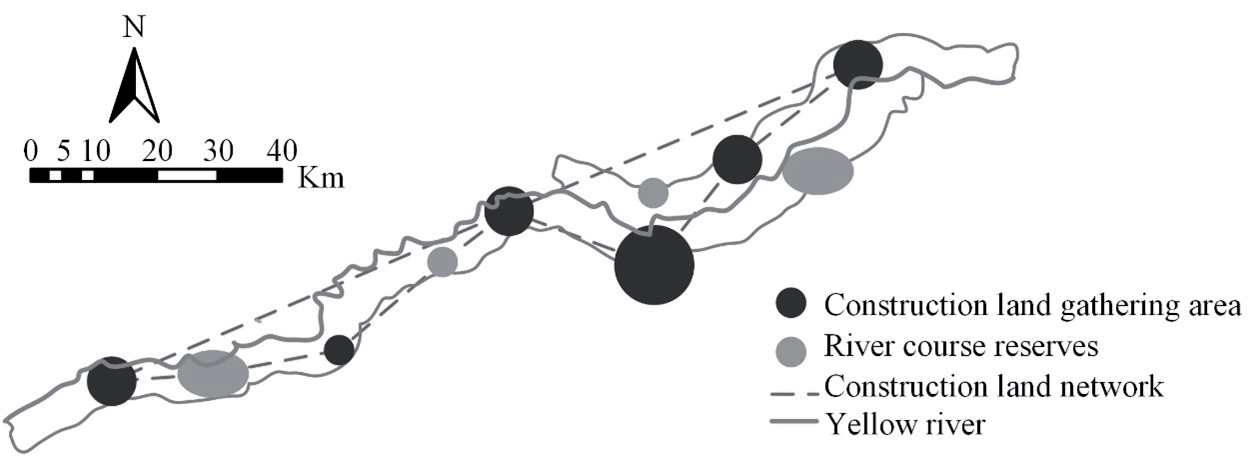
Analyzing the landscape ecology of the YR’s MLR, the study found that the landscape pattern in the YR’s MLR is characterized by unreasonable spatial structure, small green landscape patches, low density, and significant fragmentation of forest landscape patches. Therefore, this study proposes adjustments to various landscape elements, including LU optimization strategies, spatial structure optimization strategies, and the construction of ecological core areas. This study plans and arranges ecological and landscape spaces in the YR’s MLR on the basis of the principles of integrity, diversity, and sustainable optimization. This can achieve a virtuous cycle of ecological protection and economic development, ensuring SD in the YR’s MLR. Firstly, on the basis of the analysis results of LU in the YR’s MLR, this study optimized its LU. The proposed LU optimization strategy is shown in Figure 6.
Fig. 6 demonstrates that due to the interference of urban advancement on the landscape ecology in the YR’s MLR, this study proposes the establishment of construction land aggregation areas and construction land relationship networks. It ensures that the green landscape is not extensively fragmented while improving LU efficiency and promoting SD in the YR’s MLR. In addition, the study also takes corresponding protection measures for natural wetlands like rivers and lakes to protect the EE, water resources, and natural landscapes of rivers to achieve the goals of SD and ecological protection. In summary, this study established a construction land relationship network and river protection zones to achieve LU in the YR’s MLR while also enhancing the ecological function of the region and protecting biodiversity. This can promote SD and ecological tourism in the YR’s MLR. In addition, the study also optimized the ecological spatial structure of the YR’s MLR, and the proposed ecological spatial structure optimization strategy is shown in Fig. 7.
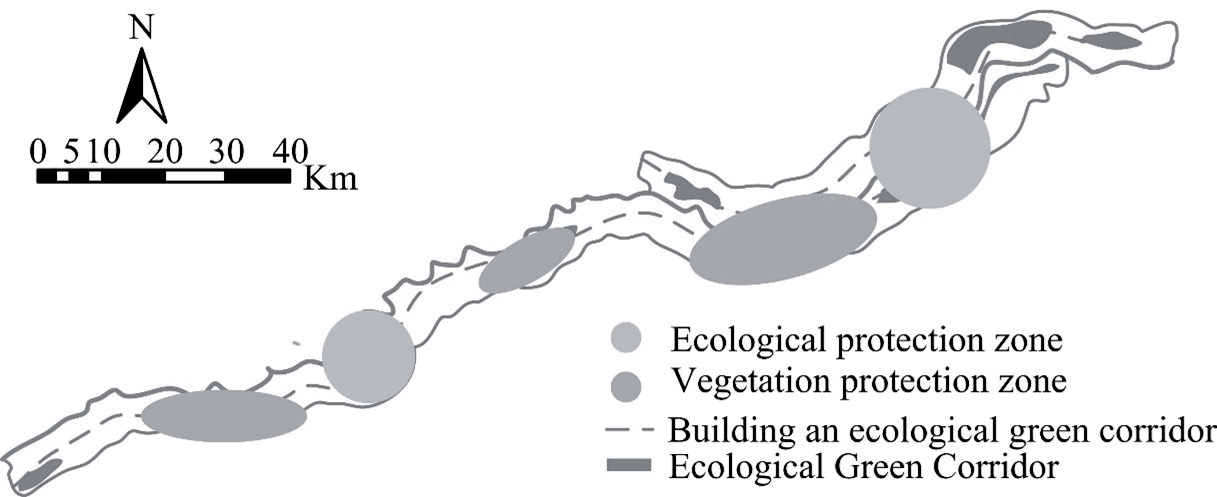
To enhance landscape connectivity and optimize the ecological spatial structure of the YR’s MLR, a strategy of “one corridor, two sources, and three areas” ecological spatial structure optimization is proposed. The “One Corridor” refers to the planning and construction of an ecological corridor that runs through the YR’s MLR, connecting various landscape nodes and important ecological landscape areas, achieving landscape continuity and ecological connectivity. The “two sources” refer to strengthening the protection of ecological sources and water resources, with a focus on protecting ecosystems such as wetlands, grasslands, and forests, and strengthening water resource management. The “three areas” refer to the research and division of ecological protection areas, farmland landscapes, and urban landscapes. Three different landscape areas are divided along the YR’s MLR. The ecological protection zone strengthens protection work, protects the EE of the YR, and creates a natural ecological landscape. The farmland landscape is created through scientific cultivation and farmland landscape planning to create a beautiful farmland landscape. Urban landscapes create a livable urban landscape by improving the level of urban building. The study also constructed an ecological core area in the YR’s MLR for repairing the ecological source areas damaged by HA. The proposed ecological core area construction strategy is shown in Fig. 8.
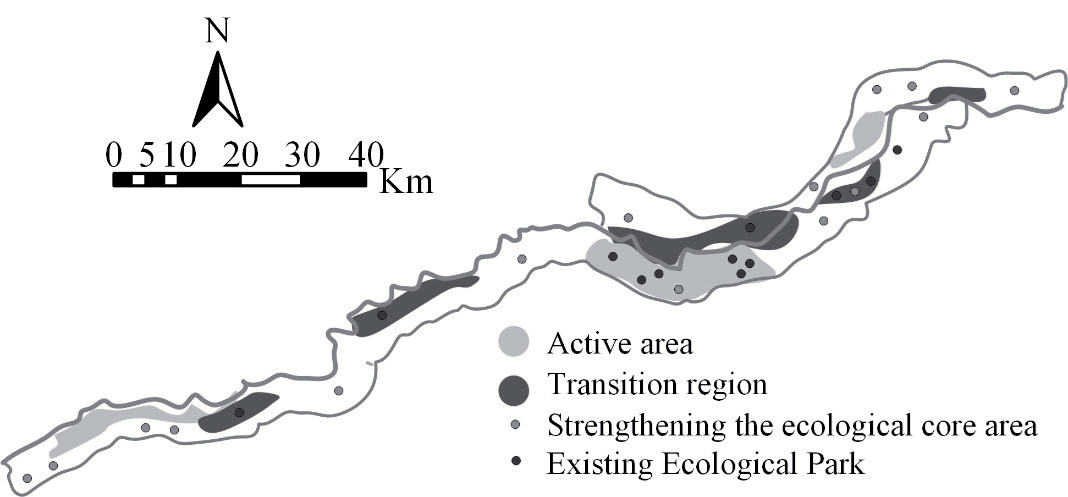
As shown in Fig. 8, to restore the ecological status of the YR’s MLR, the integration of wetland parks in the YR’s MLR is studied, and the ecological main area of the area is reasonably planned. Subsequently, the study established transition zones and activity zones for zoning management of the ecological core area. In the activity area, this study controls the red line of ecological green spaces, restricts HA, and fully protects the ecosystem. In the transition zone, research has placed it on both sides of the activity zone to buffer HA. In addition, the study also provides education and publicity on the ecology protection of the YR to the public by increasing public awareness and participation in the ecology protection of the YR and forming an atmosphere of common concern and support from the whole society for the ecology protection of the YR. This can achieve long-term EE improvement and SD.
Conclusion
Due to human interference and excessive development, the geomorphic landscape in the YR’s MLR is facing the risk of destruction and loss. To strengthen the protection and rational utilization of its EE, research is conducted to evaluate the geomorphic landscape ecology in the YR’s MLR. The study found that between 2000 and 2020, the diversity of Shannon in the YR’s MLR decreased to 0.81, and the area of grassland landscape gradually decreased, with its shape index and patch shape index decreasing to 10.6 and 1.1. In addition, between 2000 and 2020, the number of patches in forest and grassland types showed an upward trend, reaching 239 and 189, respectively, in 2020, and the largest patches also showed an increasing trend year by year, reaching 2.1% and 0.5%, respectively. This proves that the shape of patches in forest and grassland types gradually becomes irregular and the degree of fragmentation increases. Therefore, there is a problem of unreasonable spatial structure and significant fragmentation in the landscape ecology of the YR’s MLR. Therefore, it proposes to adjust various landscape elements in the YR’s MLR, including LU optimization strategies, spatial structure optimization strategies, and ecological core area construction strategies. However, research also has certain limitations. The determination of the weight of the landscape ecological health evaluation system is mainly on the basis of existing literature research, and there is a certain lack of regional specificity. The future research direction is to build a landscape ecological health evaluation system that is more suitable for the YR’s MLR.

