

Introduction
Sustainable utilization of water resources refers to the principle of permanent utilization of water resources in order to guarantee the sustainable development of human society, economy and ecological environment [1]. Since the concept of sustainable development was put forward in the 1980s, it has attracted the attention of relevant scholars. In order to realize the sustainable development of water resources, countries and administrative regions put forward relevant measures and policies according to their own conditions [2, 3]. The basic idea is to pay attention to the balance between the adverse side effects caused by development and the expected social and economic effects in the process of water resources development and utilization. Therefore, in the development and utilization of water resources, ecological and environmental systems must not be harmed. At the same time, the water required for the rational development of society and economy should be guaranteed to meet the water requirements of various industries and provide continuous water supply [4, 5]. In addition, water will be disturbed in the natural cycle process, and countermeasures should be paid attention to to reduce the impact of such interference on the sustainable use of water resources [6, 7].
In order to ensure that the sustainable development of water resources and the level of social and economic development are compatible with the carrying capacity of water resources, since The State Council issued the Opinions on Implementing the Strictest Water Resources Management System in 2012, the state and various provinces and cities have clearly put forward the main objectives of the control of water resources development and utilization, the control of water use efficiency and the “three red lines” limiting the absorption of pollution in water functional areas [8]. Since the implementation of the strictest water resources management system, Xinjiang has adhered to the principles of “determining land, production, city and electronically controlled water according to water”, and has distributed the “three red lines” control indicators to various states and cities, and has initially realized the control of total water use and water use efficiency[9, 10]. In order to realize the general goal of “three red lines”, Hotan region actively carries out the construction of water-saving society, and implements a series of measures: perfect and perfect water resources management system [11]; The industrial structure and water supply structure should be established according to local water resources endowment and spatial and temporal distribution characteristics. In order to ensure the water quality standard, the water resources monitoring system has been improved. Improve residents’ awareness of water-saving and the popularization rate of efficient water-saving technologies. However, due to the low level of industrial and agricultural development and relatively backward industrial development in Hotan, its water economic benefits are low, which is not conducive to the construction of a water-saving society, and is also a major factor hindering the realization of the overall goal of “three red lines” and the sustainable utilization of water resources [12, 13].
The distribution of water resources in Hotan is uneven in time and space, and water resources are scarce. However, with the development of industrialization and modernization, the social and economic water demand is increasing, the contradiction between supply and demand of water resources is becoming increasingly prominent, and water pollution is becoming increasingly serious, which has become an important “bottleneck” restricting its sustainable development. The main influencing factors of water resources sustainable development in different periods are also different. With the help of obstacle degree model, the influence of each factor on the sustainable development of water resources system can be quantitatively expressed from the aspects of index deviation degree, obstacle degree and contribution degree. Therefore, the study on the sustainable utilization of water resources in Hotan and the analysis of its main influencing factors are of great guiding significance to the realization of the overall goal of “three red lines” and the sustainable utilization of water resources in local and Xinjiang. The specific arrangement of this work is as follows:
Research Data and Methods
Overview of the Study Area
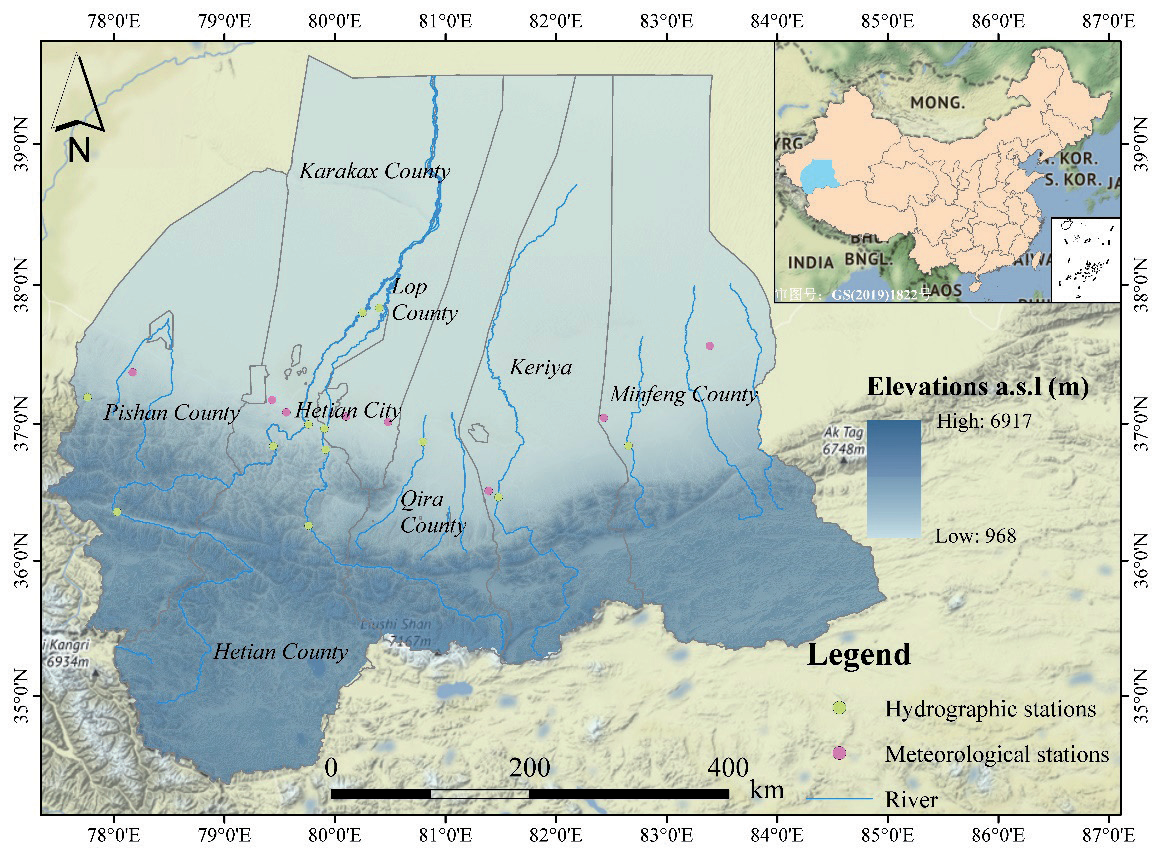
Hotan (77°31’E~84°55’E, 34°22’N~39°38’E) is located in the southernmost part of Xinjiang Uygur Autonomous Region (Fig. 2) [14]. By 2018, the per capita disposable income of urban residents in Hotan was 29,046 yuan, and the per capita net income of farmers and herdsmen was 8,882 yuan [15]. It is bounded by the Kunlun Mountains in the south, Aksu in the north by the Taklimakan Desert, Bayingoleng Mongolian Autonomous Prefecture in the east, and Kashgar Prefecture in the west. The area of the prefecture is 247,800 square kilometers; The area is rich in light and heat resources, which is not only the habitat of rare wild animals such as wild yaks and snow leopards, but also the distribution of wild plants with high economic value. The region is rich in mineral resources, with rich reserves of oil, natural gas and other mineral resources; Due to its location in a warm continental climate, it is characterized by strong evaporation and drought, low annual precipitation and frequent wind and sand [16-18].
Data Sources
This study chooses 2000-2020 as the research year with relatively complete data. The original data of total population, wastewater discharge, GDP, vegetation area and other indicators were derived from Xinjiang Statistical Yearbook (2000-2020). The original data of annual average precipitation, total water consumption, annual precipitation, evaporation change rate, surface water quantity, underground water quantity and total water resource were obtained from Xinjiang Water Resources Bulletin (2001-2020).
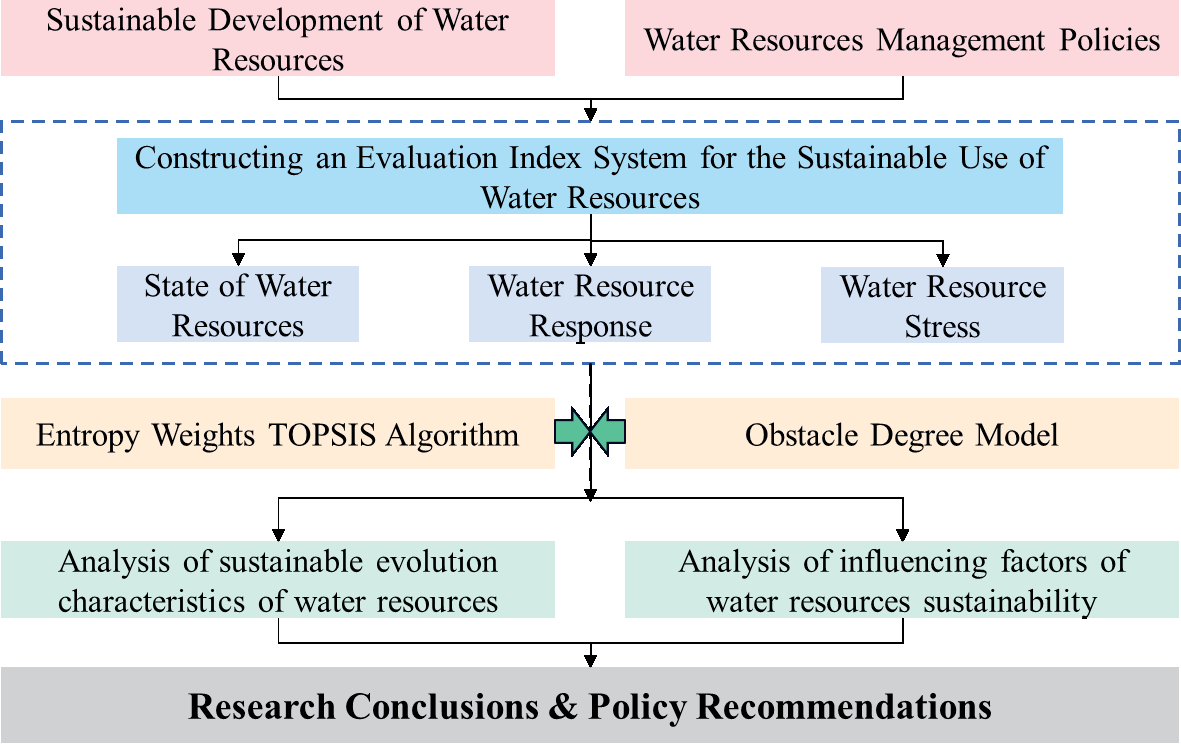
Research Methodology
Construct Evaluation Framework and Index System
For the sustainable utilization of water resources, according to the concept of resilience and the logical idea of pressure-state-response, an index system was constructed from three aspects: system pressure, state and response, as shown in Table 2-1. For the sustainable use of water resources, water system pressure: 5 indicators were selected from the aspects of sewage discharge, resource development and utilization intensity; Water system status: considering the amount of resources, water production capacity and surface/ water conversion capacity, a total of 3 indicators; Water system response: three indicators were selected based on changes in green cover, rainfall and evaporation. (Table 1).
Table 1.
Evaluation index system of sustainable utilization of water resources in Hotan area
Indicator Weight
In this paper, entropy based method is used to assign the index. Entropy weighting overcomes the shortcoming of subjective weighting and has higher credibility [19, 20]. Due to the different information contained by each index on system changes, the weight of different indicators is different: the greater the weight of a specific indicator, the greater the impact on system changes, and vice versa [21].
Data Standardization
Because the dimensions of each index are different, it is necessary to carry out standardization processing, so that different data can be compared. Based on the core idea of TOPSIS algorithm, this paper adopts deviation standardization, and the calculation formulas according to the characteristics of indicators are as follows:
where: xij is the jth index in the year of sample i, and xij' represents the jth index in the year of sample i after standardization. Where 1≤i≤m, 1≤j≤n.
Entropy Weighting
The basic idea of entropy weighting method is to calculate the information entropy among indicators, and the index weight of the measure has strong objectivity and credibility [22]. The specific steps are as follows:
(1) Calculate the specific gravity matrix of the index system:
where: (Pij)(m,n) is the specific gravity matrix of evaluation indicators, 0≤Pij ≤1, where m represents the number of sample years; n represents the number of evaluation indicators; xij' represents the jth index in the standardized sample year i.
where ej is the entropy value of each index, 0≤ej≤1.
where: gj is the difference coefficient of the jth index; Wjsz is the entropy weight of the jth item.
TOPSIS Algorithm
In order to fully show the development and change of evaluation targets, TOPSIS algorithm is adopted to evaluate the development status of evaluation targets by measuring the relative distance between each sample scheme and the optimal (or inferior) solution [23]. For specific calculation, refer to relevant studies [24].
where H(x)i ranges from [0,1], H(w)i represents the index of sustainable utilization of water resources, and H(s)i represents the index of sustainable utilization of water resources. sep(x)i+ is the distance between the ith sample scheme and the optimal solution; sep(x)i– is the distance between each sample scheme and the worst solution. Where 1≤i≤m, m is the number of sample years.
Obstacle Degree Model
In order to further reveal the main factors hindering the improvement of the sustainable utilization level of water resources in Hotan area, this paper adopts the obstacle degree model to conduct a quantitative analysis of the obstacle factors and the degree of obstacles affecting the sustainable utilization of water resources in the basin, based on the analysis of the obstacle degree of a single index to the overall goal. This paper refers to the methods provided by relevant literature for calculation:
where: zij is the obstacle degree of the jth index to the sustainable utilization of water resources in the basin in the year i; Lij is the difference between the single factor and the target condition, and Wj is the weight of the jth indicator. Where 1≤i≤m, 1≤j≤n, m is the number of sample years, n is the number of evaluation indicators.
Results and Analysis
Evaluation Index Weight Determination
Based on the data standardization results, the entropy weighting method was used to assign weights to the selected indicators, and the indicators were sorted according to their weights (Table 2). The ratio weight of evaporation change is the largest (0.149), the weight of water production coefficient is the smallest (0.046), and the weight difference is 0.103. The top five indexes ranked by weight were evaporation change rate (0.149), precipitation change rate (0.117), water consumption per 10,000 yuan GDP (0.114), population density (0.111), surface water/groundwater conversion capacity (0.083), and the weight difference was small. From the attribute level, the weight ranking is stress index (0.436), response index (0.335) and state index (0.229).
Changes in the Sustainable Use of Water Resources in Hotan
The raw data is standardized according to the data standardization method described in 2.3.2.1. According to the different index systems corresponding to each criterion layer and factor layer, TOPSIS algorithm is used to calculate the relative distance between each sample scheme and the optimal (or inferior) solution of different evaluation objectives from 2000 to 2020. Finally, the sustainable utilization of water resources in the study area and the close degree of each index of the factor layer are obtained.
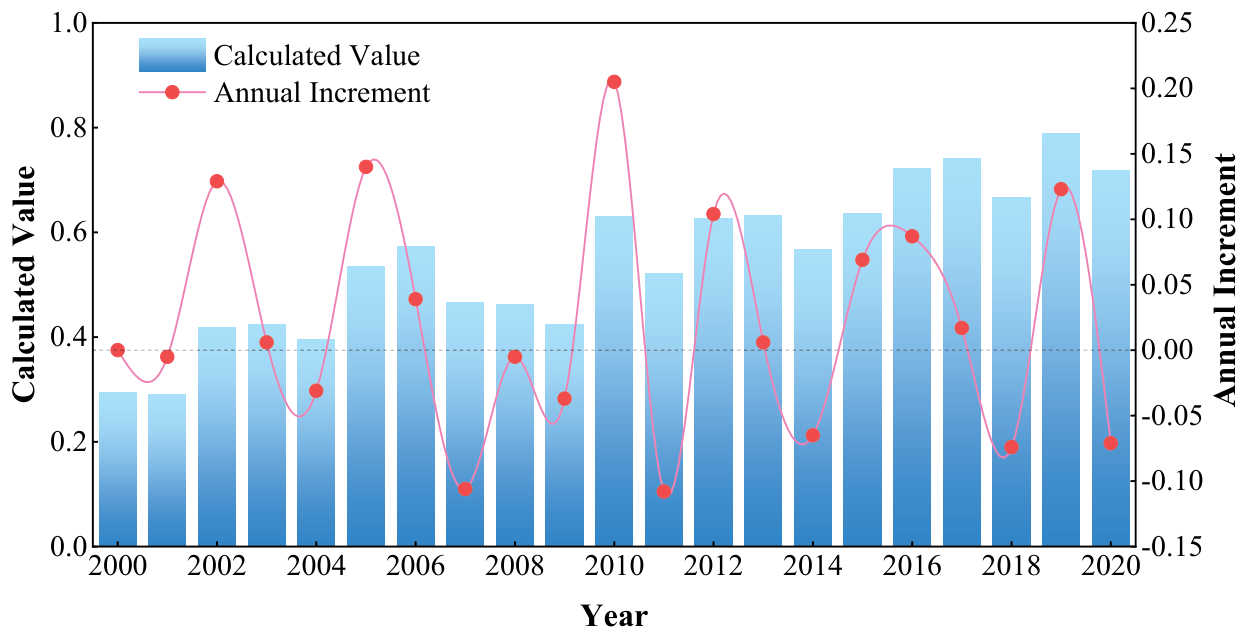
In the past 20 years, the sustainable utilization of water resources in Hotan showed a fluctuating upward trend (Fig. 3), with a variation of 0.423. Taking 2006 as the cut-off point, the index of sustainable water resources utilization from 2000 to 2006 showed a trend of rapid increase, and the change was obvious, with a amplitude of 0.278; From 2007 to 2020, the sustainable water resources use index showed an upward trend, among which the change of the sustainable water resources use index from 2007 to 2009 was relatively slow, and the change of the sustainable water resources use index was only -0.042, and the change of the sustainable water resources use index from 2017 to 2020 was 0.251, and the change was obvious but tended to be stable.
Table 2 .
Weights of indicators in Hotan area.
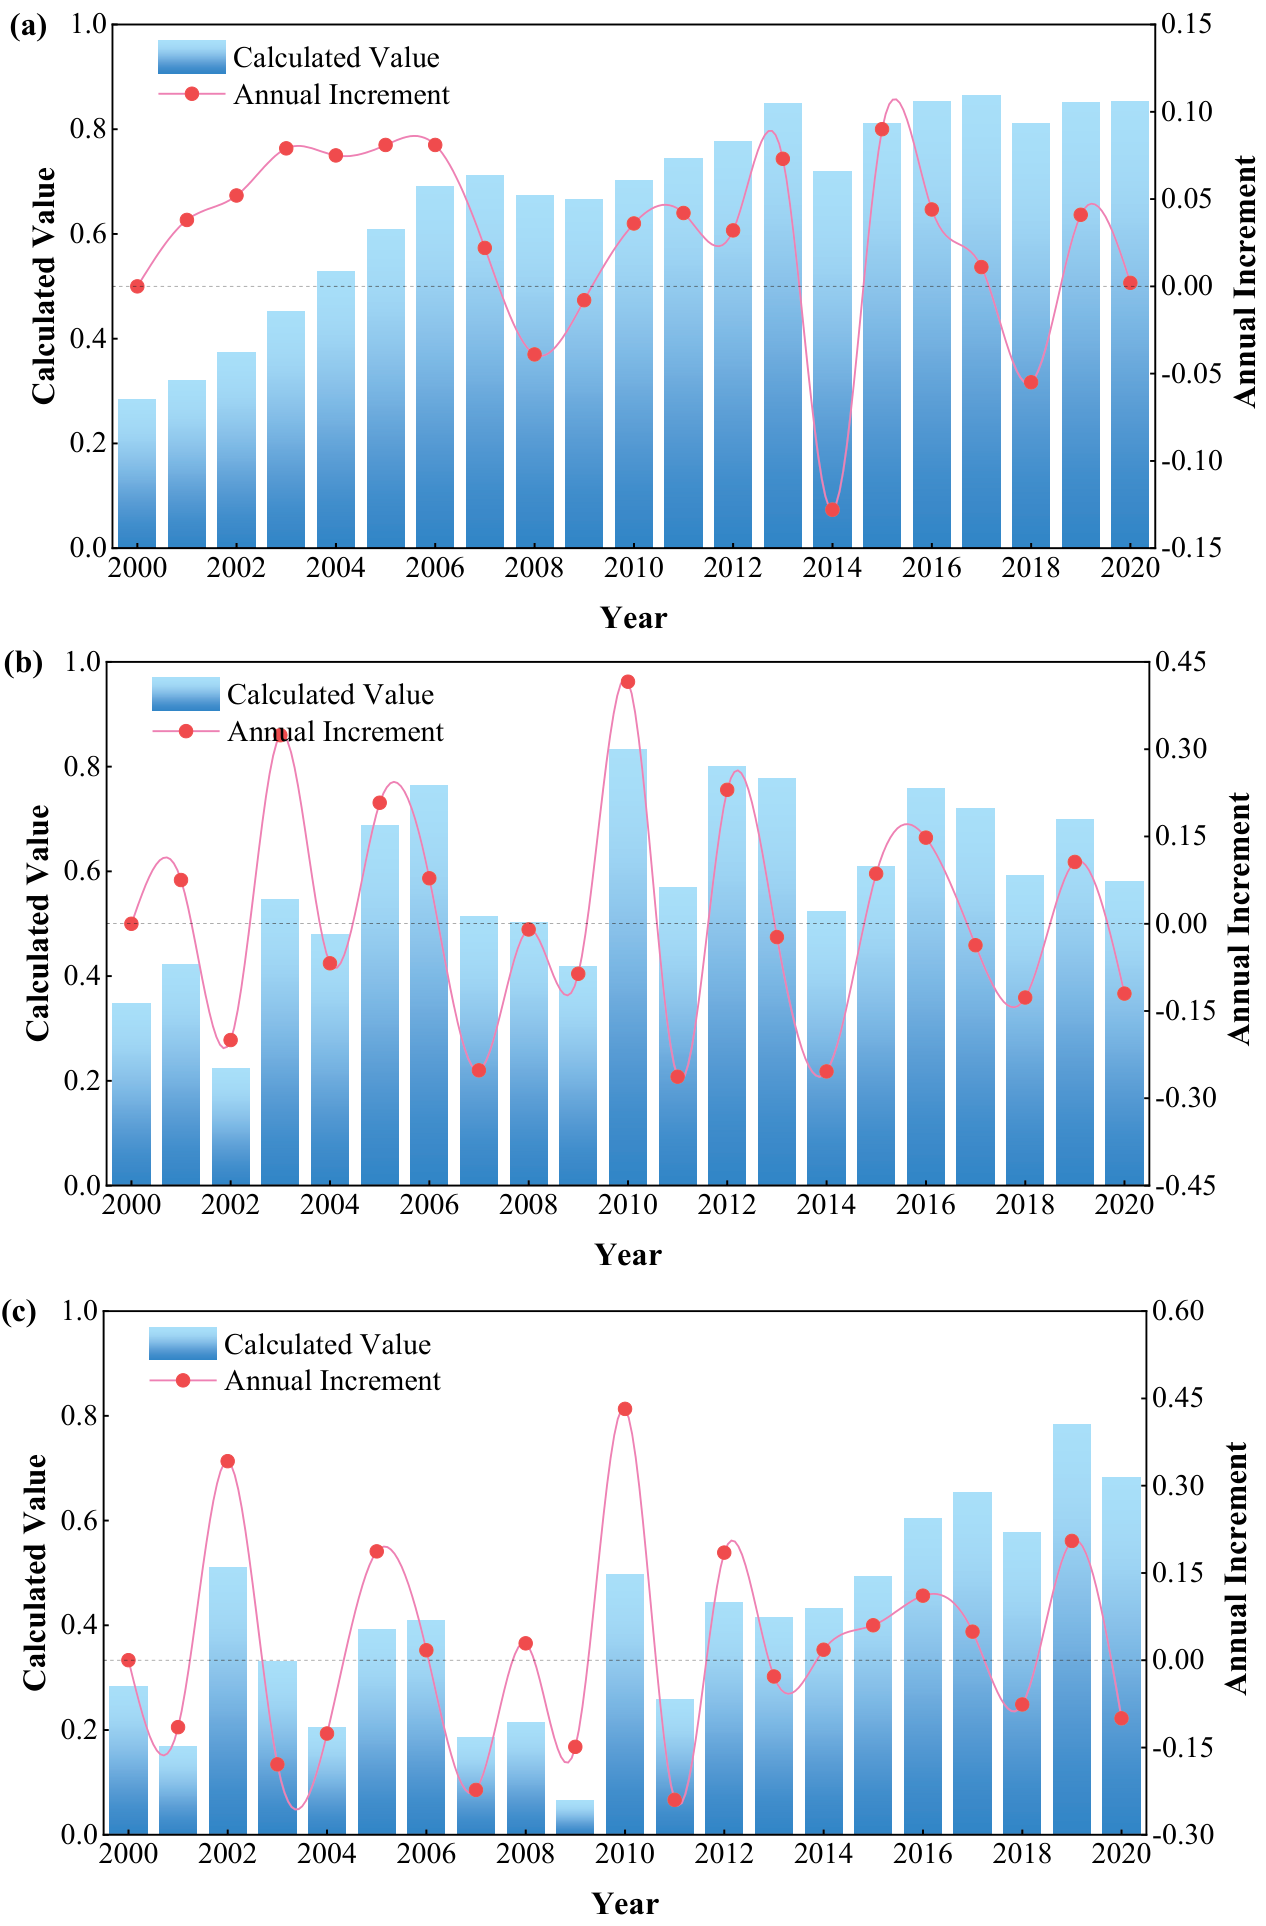
In addition to the obvious upward trend of the water resource pressure index, the overall change trend of the status and response indicators is the same, showing a fluctuating trend (Fig. 4), and the specific changes are different in different periods: (1) Before 2007, the water resource pressure index showed an overall upward trend with obvious changes, and after 2008, it showed a slow fluctuating upward trend with a small increase (Fig. 4a);
(2) Taking 2006 and 2010 as the demarcation points, the water resources status index showed an obvious upward trend at first, a relatively stable trend from 2007 to 2009, and an overall fluctuating downward trend from 2010 to 2020 (Fig. 4b); (3) The change trend of water resources response index can be divided into two sections: the fluctuation trend from 2000 to 2008, and the change and increase from 2009 to 2020, with an increment of 0.570 (Fig. 4c).
Obstacle Degree Analysis of Sustainable Use of Water Resources
According to the obstacle degree model, the obstacle degree of each index to the sustainable use of water resources in different years was calculated, and the obstacle degree of each index was analyzed from the index level, attribute level and criterion level, and the main obstacle factors were determined. Obstacle degree of each index was ranked in order of magnitude, and obstacle factors were screened according to the criterion of obstacle degree Zi≥4.0% [25], and the diagnostic results of major obstacle factors for sustainable utilization of water resources in Hotan area were obtained (Table 3). The top five obstacle factors of this year were selected to analyze the changes in the main obstacle factors of sustainable water resources use (Table 4).
Table 3.
Main obstacles to sustainable utilization of water resources in Hotan area
| Obstacle factor | X5 | X6 | X1 | X3 | X4 | X10 | X11 | X8 | X9 | X7 |
|---|---|---|---|---|---|---|---|---|---|---|
| Frequency | 20 | 20 | 19 | 19 | 19 | 17 | 14 | 12 | 12 | 9 |
| Frequency | 0.952 | 0.952 | 0.905 | 0.905 | 0.905 | 0.810 | 0.667 | 0.571 | 0.571 | 0.429 |
Table 4.
Main obstacle factors and obstacle degree of sustainable utilization of water resources.
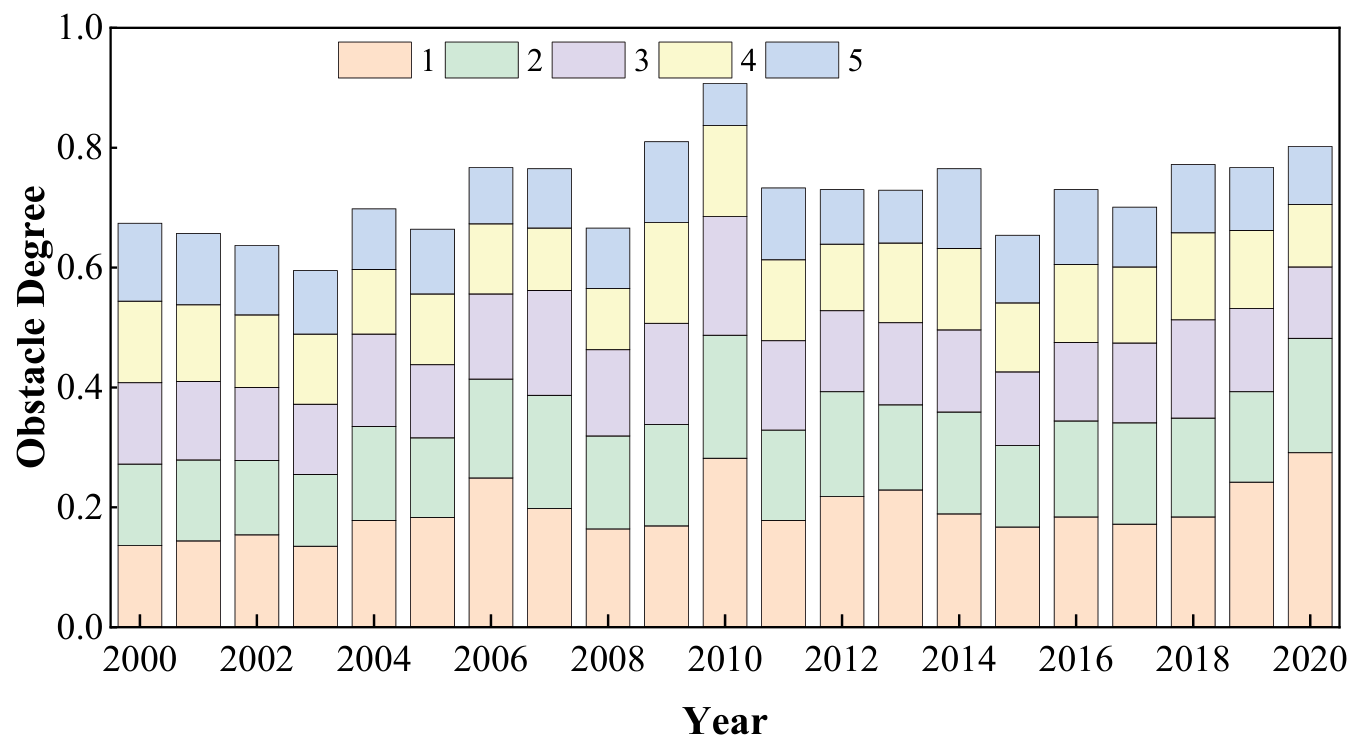
Fig. 6.
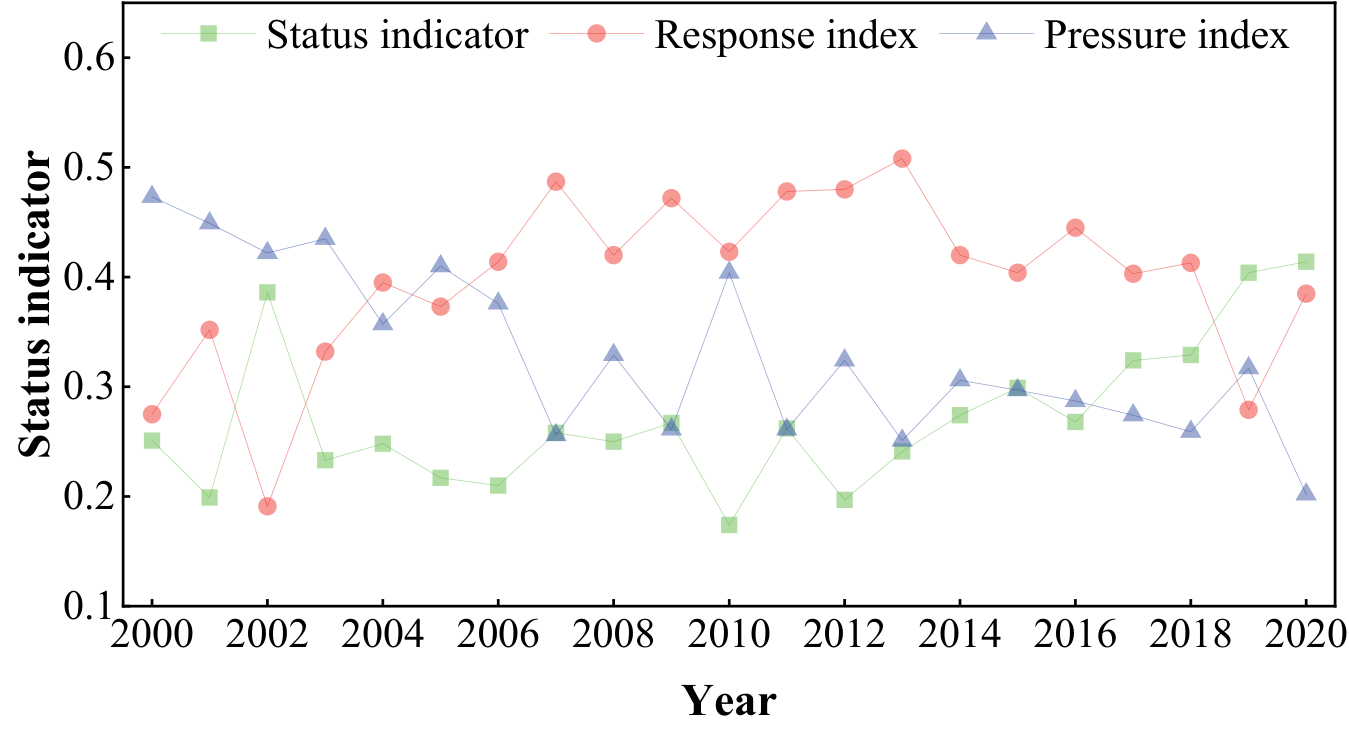
Change trend of obstacle degree in attribute layer of sustainable water resources utilization.
As can be seen from Table 3, among the obstacles to the sustainable use of water resources in Hotan area from 2000 to 2020, the rate of change of evaporation (X5) and the rate of change of vegetation area (X6) have the highest frequency, both of which are 95.24%. Followed by water production coefficient (X1), water resources amount (X3) and precipitation change rate (X4), the frequency is 90.48%. From the perspective of attribute level indicators, there are 5, 2 and 3 indicators belonging to water resources pressure index, state index and response index respectively.
As can be seen from Table 4 and Fig. 5, the cumulative obstacle degree of the top 5 obstacle degrees in the index layer gradually increases. In 2020, it even reached 80.1%, while in 2003, the cumulative handicap was the lowest at 59.5%. Among the obstacle factors of sustainable water resources utilization this year, the obstacle factors with the obstacle degree greater than 5% are mainly: evaporation change rate (X5), vegetation area change rate (X6), precipitation change rate (X4), water production coefficient (X1), water resources volume (X3), population density (X7) and water consumption of 10,000 yuan GDP (X9).
As can be seen from Fig. 6, water resource pressure, state and response index obstacle degree change are also different. During the study period, the obstacle degree of water resource stress index showed a decreasing trend as a whole, but its changing trend could be divided into two periods: starting from 2010, the overall fluctuation decreased before 2015, and the change was relatively stable after 2015, mainly within the range of (0.300,0.200); The overall change of obstacle degree of state index showed a fluctuating upward trend, which can be divided into two stages: from 2000 to 2010, the increase rate was only 0.015, and after 2011, it showed a significant upward trend, with a amplitude of 138.3%; The barrier degree of response index took 2013 as the demarcation point, which experienced rapid growth and fluctuation decline successively.
Discussion
The changes of indicators and evaluation objectives show that (Fig. 3 and 4) : In the past 20 years, the sustainable utilization capacity of water resources in Hotan region has been mainly affected by water resources pressure and response capacity, and after 2018, the change of water resources status has a significant impact on the development of sustainable utilization capacity of water resources in Hotan region.
(1) Although with the implementation of many policies such as returning farmland to forest and pasture, the overall vegetation area shows a trend of fluctuation and decline due to the influence of social and economic activities, which limits the sustainable development of water resources in this region [26, 27]. (2) The precipitation in Hotan area increased steadily, the local conditions of water resources were improved, and the state capacity of local water resources was enhanced [28, 29]. (3) With the adjustment of industrial structure and the iteration of industrial technology, the economic benefits of water resources have been improved, and the sustainable development of water-socio-economic multiple system in Hotan has been promoted.
(4) During the study period, the natural population growth rate showed an overall upward trend and the population increased, but due to the gradual expansion of human activity space and influence scope, the population density showed an overall downward trend, which reduced the local water resources pressure. At the same time, due to the gradual increase of social economy and agricultural irrigation demand, the development and utilization rate of water resources gradually increased, and the global water resources pressure increased.
From the attribute level indicators, there are 5, 2 and 3 indicators of water resources pressure, state and response indicators respectively. On the one hand, it shows that the sustainable utilization of water resources in Hotan area is affected by the combined effects of water resources pressure, state and response ability. On the other hand, it also shows that the obstacle factors affecting the sustainable development of water resources mainly come from the factor layer of water resources pressure and water resources response ability [30- 32]. In the past 20 years, the vegetation area of water resources in Hotan has fluctuated and declined, the intensity of water resources development and utilization has increased [33, 34], the water environment has deteriorated, the social and economic benefits of water resources have improved, and the local conditions of water resources in the region have improved , so it is urgent to strengthen the protection of water resources in the region for sustainable development of water resources in the region.
Conclusion
On the basis of constructing the index system of sustainable water resources utilization in Hotan area, this paper analyzes the evolution characteristics and main obstacle factors of sustainable water resources utilization in Hotan area by using the entropy-weighted TOPSIS model and the obstacle degree diagnosis model. The conclusions of this paper are as follows:
(1) The comprehensive weights of each evaluation index in Hotan were determined based on entropy weighting and random weighting.
(2) From 2000 to 2020, the sustainable utilization of water resources in Hotan region showed an overall upward trend, and its development tended to be stable.
(3) The main obstacles to the sustainable use of water resources in Wada area were different at different time periods. Overall, the rate of evaporation change (X5) and the rate of vegetation area change (X6) are the main obstacles to the sustainable utilization of water resources. Water yield coefficient (X1) and vegetation area change rate (X6) are gradually becoming the main obstacle factors.

