

Introduction
More than 10 million locations with more than 20 million hectares of land are categorized as having contaminated soil, and more than 50% of these locations have hazardous heavy metals and/or metalloid contamination [1-4]. Heavy metal toxicity and its potential for bioaccumulation are transmitted to people through the food chain [4-7]. Metallic substances in higher quantities are poisonous to living things yet necessary to keep the body’s metabolism running smoothly [8-9]. The main food chain exposure route for humans is eating food crops that have been tainted with heavy metals [10-12]. Heavy metal stress in animals is caused by eating agricultural crops extremely tainted with toxic substances, which are the mainstay of the food web [13].
The availability of forages in arid zones is correlated with water availability. Long droughts lower forage production and availability for grazers, which in turn lowers forage availability for animals. This is the main constraint on livestock in the world’s arid and semi-arid regions. For the grazers in these areas, who normally eat crop remnants and dry grasses, the rainy season is a time of feast [14].
Heavy metal poisoning has caused significant and widespread human catastrophes throughout the food chain. Food chain contamination leads to heavy metal contamination in foodstuffs, which ultimately reduces crop production. The effect generated by pollution is permanent and everlasting. Cd is a significant contaminant that is easily disseminated throughout various plant components and enters the food chain after being absorbed by plants through polluted locations [15]. Cadmium (Cd) has no physiological use and is frequently thought to be toxic [16]. Cadmium damages the liver, kidney, skin, and pancreas while also being nephrotoxic, neurotoxic and carcinogenic [17].
Copper (Cu) exists in nature as an element. In acidic liquids, Cu needs oxidising agents to dissolve. In both industry and agriculture, Cu is widely used. Additionally, it is utilised in electrical appliances, plumbing, alloys, and buildings. Lacrimation, increased salivation, and allergic rhinitis can all result from prolonged exposure to Cu. In addition, it can harm the liver and kidneys. Smoke, dust, and mist are all by-products of the industrial manufacture of Cu. It may elevate body temperature and encourage nasal mucosal atrophy. Wilson’s disease, which results in liver cirrhosis, brain impairment, and renal issues, can be brought on by long-term exposure to excessive Cu levels. A pathognomonic symptom of the Kayser-Fleischer ring is brought on by Cu deposition in the cornea [18].
Through unintentional soil leaching, soil contamination from edible plants, or intake of tainted animal feed products, Cu may enter the human food chain. Copper is frequently used in electrical equipment and has a number of applications in horticulture, including wood preservation and treatment, nutrients, insecticides, and fungicides [19].
Many techniques are employed to estimate the quantity of ingested dietary pollutants. To predict chronic exposure, the basic deterministic model gathers information on individual feed intake with information on mean poisoning. As a result, the pollutant quantity in food ingested by the populace in locations affected by toxins on a regular basis is analysed. These outcomes are linked to data on food consumption to estimate metal exposure through diet [20]. The aim of this study was to evaluate the movement of Cu and Cd through the soil, plants, and animal food chains. The goal of the current study was to examine the build-up of Cu and Cd in irrigation water, soil and forages as well as assess any potential health effects to animals from consuming these forages. In order to establish the deficiency or toxicity of Cu and Cd in animals, other pollution indices were also measured.
Materials and Methods
Study Area
This research was conducted in the arid region of District Khushab, Punjab Province, Pakistan. The temperature of Khushab in summer increases up to 50ºC and the minimum temperature during cold is recorded upto 5ºC. Three arid regions namely Joiya (Place-I), Talokar (Place-II) and Khushab (Place-III) were selected for sampling which was irrigated with groundwater.
Collection of Samples
Groundwater samples (1L) were collected from the three arid sites irrigating the fodders. Samples were collected in bottles that were washed before with water to prevent any contamination. Samples of soil (1 kg) were collected from where fodders samples were collected. Samples were taken from each site. Soil was collected at a depth of 0-15 cm. Then it was placed in polythene bags and brought to the laboratory for further analysis.
Samples of fodders (1 kg) were collected from three selected sites, Joiya (Pl-I), Talokar (Pl-II) and Khushab (Pl-III). Samples were washed with water to remove contaminants. The samples were packed in plastic bags and taken to the laboratory for further metal analysis. Samples include Medicago sativa, Trifolium alexandrinum, Avena sativa, Pennisetum glaucum and Brassica campestris.
The Sahiwal cow is one of Pakistan’s top dairy breeds. It tolerates heat well, resists ticks, and has strong internal and external parasite resistance. While breastfeeding a calf, cows produce an average of 2270 kg of milk each lactation, however far greater milk outputs have been seen. They have been transported to other Asian nations as well as Africa a nd the Caribbean due to their excellent milk output and heat tolerance.
The experimental period occurred during the crop cycle, taking into account the arid season of six months. During this time interval, the cows were housed in free stalls. The diet consisted of forage samples and concentrates with vitamin and mineral premix, urea and water ad libitum. With the exception of pasture ingredients, efforts were made to ensure that the other ingredients offered to improve animal nutrition were identical in origin and quantity in the three selected regions.
In accordance with best practices for milk collection, the teats were washed with water before the first three milk jets were tossed into a glass with a black bottom to check for lumps. The teats were then dipped into the fore milk using an applicator. To determine the overall production efficiency, a sodium hypochlorite-based milking solution was introduced, and 25 seconds were allowed to pass. The nipples were dried with a paper towel after cleansing. A post-milking solution containing 0.25% glycerine iodine was used after the milking process was complete.
Five samples of raw fresh cow’s milk were collected from the selected locations who were eating the particular samples. During sampling, a partial fresh milk sample was obtained from each milking (three milkings per day) and the proportions were as follows: 1/3 milk in the morning, 1/3 milk in the afternoon and 1/3 milk in the evening were added to the same 100 ml bottle. With these samples, an independent sample was collected at each milking and a total of 100% milk was collected in the bottle. Milk was collected in polythene bottles that were already washed with deionized water to avoid contamination. 500mLmilk was collected from cows and stored at -20ºC until analysis was done.
Digestion of Fodder Samples
Water and milk samples were digested in digestion tubes. 50 mL and 1 mL of water and milk samples were taken and then 10 mL of HNO3 was added digestion tubes were heated into the digestion chamber and after that, they were allowed to cool and were collected into a volumetric flask 50 mL. After that, they were subjected to an atomic absorption spectrophotometer for heavy metal analysis.
Soil and fodder samples were air-dried and ground into a fine powder then placed in an oven at 70ºC for 72 hours. 0.5 g of soil and 1 g of fodder sample were taken into the digestion chamber and then 20 mL of soil and 5 mL of 68% of HNO3 were added into the sample with the help of a measuring cylinder. The mixture was then left for the night. The samples were then transferred to the digestion block and were heated for 1 hour then allowed to cool and added 10 mL and 5 mL of 30% H2O2 of soil and fodder were heated again. The process of addition of H2O2 was repeated again and again until it became clear and allowed to cool. Then it was transferred to a 50 mL volumetric flask and was then taken to the atomic absorption spectrophotometer for heavy metal analysis. The collected fodder samples are given in Table 1.
Metal Profile Evaluation by Statistical Analysis
Statistical Analysis
One-way analysis of variance was used to evaluate the differences in metal values in irrigation areas using IBM SPSS 24 (Statistical Package for Social Sciences). The differences between the values were statistically tested at 0.05, 0.01 and 0.001 levels. The Pearson correlation matrices with the correlation coefficient (r) for the specimen were used in the study to correlate the impact of one metal uptake on the amount of another metal in a similar specimen.
Pollution Load Index (PLI)
A spectrophotometer used for atomic absorption analysis was used to determine the zinc content of all produced samples. According to the methods described by Ge et al. [13], statistical analysis and the least significance within samples were noticed. By using the following formula, PLI was used to assess metal contamination in soil:
Bioconcentration Factor (BCF)
The metal transfer from agricultural soil to grassland was predicted using BCF.
Daily Intake of Metals (DIM)
The equation evaluated DIM:
C represents the Concertation of metal in plants F = Conversion factor (0.085) D food intake = Food intake per day
Table 1.
List of fodder samples collected from three selected sites.
Table 2.
Analysis of variance data for Cd and Cu in groundwater samples.
| Source of variation (S.O.V) | Degree of Freedom | Mean square value of Cd water | Mean square value of Cu water |
|---|---|---|---|
| Site | 2 | 0.000460ns | 0.449** |
| Error | 6 | 0.001018 | 0.07066 |
| Total | 8 |
For evaluating this DIM value, the conversion factor was deemed to be 0.085. Using the cow’s body weight of 600 kg and the daily fodder consumption of 12 kg, the DIM was computed by Johnsen and Aaneby [21].
Cd and Cu Concentrations in Groundwater
The concentrations of Cd and Cu ranged from 0.041-0.065 mg/L and0.585-1.341 mg/L, respectively. Analysis of variance data for Cd and Cu in groundwater samples is shown in Table 2. The maximum level of Cd (0.065 mg/L) in water samples was found at Pl-II (Talokar) and lowest (0.041 mg/L) concentration of Cd was detected at Pl-I (Joiya) while the highest level of Cu (1.341 mg/L) in water samples was found at Pl-III (Khushab) and lowest (0.585 mg/L) concentration of Cu was detected at Pl-II (Talokar) (Fig. 1).
Cd and Cu Concentrations in Soil Treated with Groundwater
The results from analysis of the variance of data revealed that the concentrations of Cd and Cu were highly significant p>0.001 and their concentrations ranged from 0.223 to 2.600 mg/kg and 11.550 to 15.853 mg/kg, respectively. Analysis of the variance data for the selected metals in the soil samples is shown in Table 3. The minimum Cd level was observed at Pl-III by A. sativa, while the maximum Cd content was observed by T. alexandrinum at Pl-II. The minimum concentration of Cu was observed at Pl-II by M. sativa, while the maximum concentration of Cu was presented by B. campestris at Pl-III (Fig. 2).
Fig. 1.
Alteration of Cd and Cu in groundwater samples of fodder at selected sites, Joiya (Place-I), Talokar (Place-II) and Khushab (Place-III).
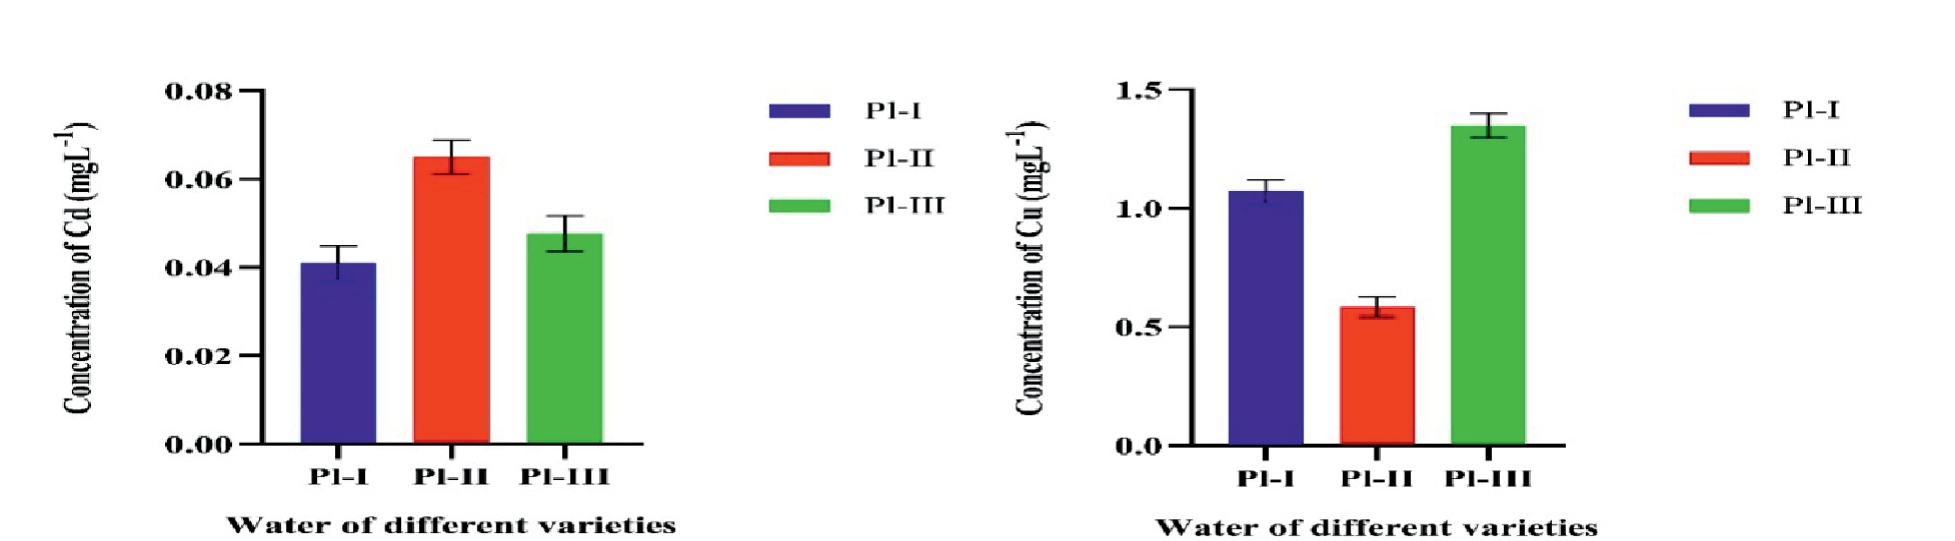
Table 3.
Analysis of variance data for Cd and Cu in collected soil samples.
| Source | Degree of Freedom | Cd means squares value | Cu means squares value |
|---|---|---|---|
| Sites | 2 | 8.32659*** | 22.0256*** |
| Soil | 4 | 0.30597*** | 5.6114*** |
| Sites*soil | 8 | 1.24248*** | 0.4103*** |
| Error | 30 | 0.02042 | 0.0382 |
| Total | 44 |
Cd and Cu Concentrations in Fodder Grown in Soil Treated with Groundwater
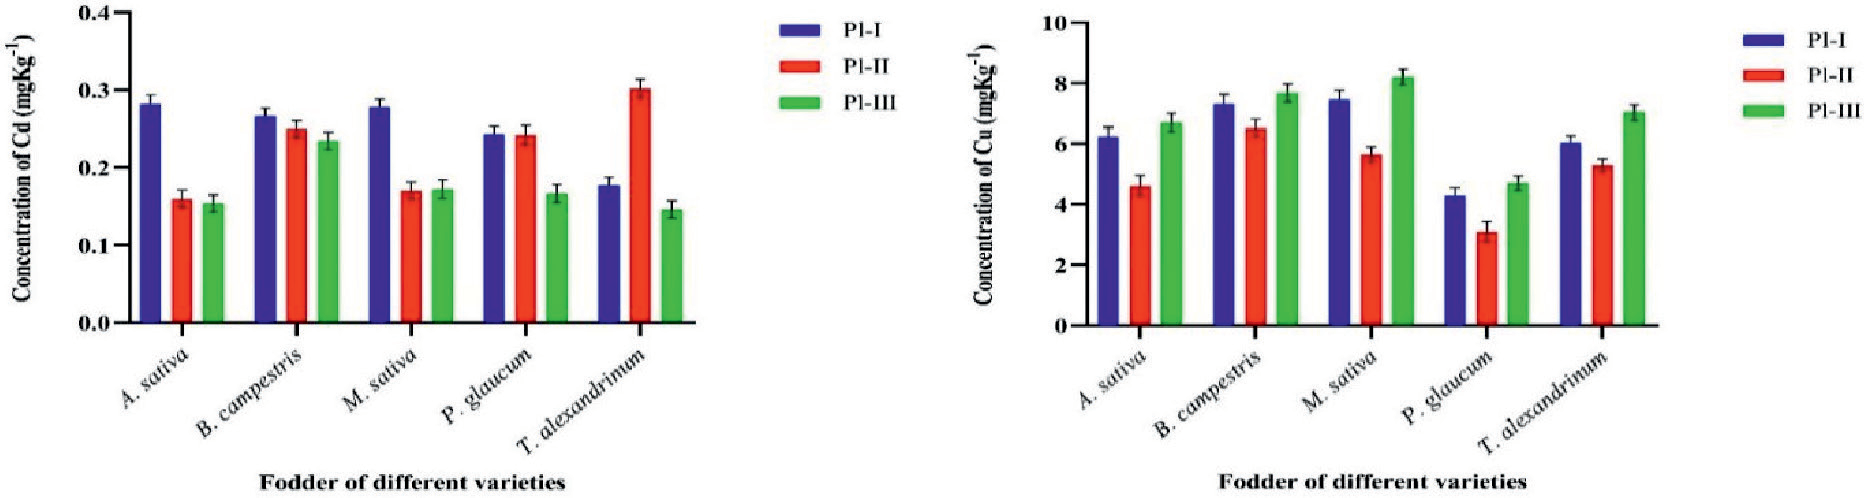
The forages were non-significantly affected (0.05>p) by Cd and Cu concentration, their concentration ranged from 0.0037 to 0.682 mg/kg and 3.0917 to 8.208 mg/ kg, respectively. Table 4 depicts the analysis of variance data in fodder samples. The plant with the highest Cd levels was A. sativa at Pl-I, while P. glaucum exhibits the lowest value at Pl-III. The highest concentration of Cu was observed in M. Sativa at Pl-III, while the lowest value was found in P. glaucum at Pl-II (Fig. 3).
Cd and Cu Concentrations in Cow Milk
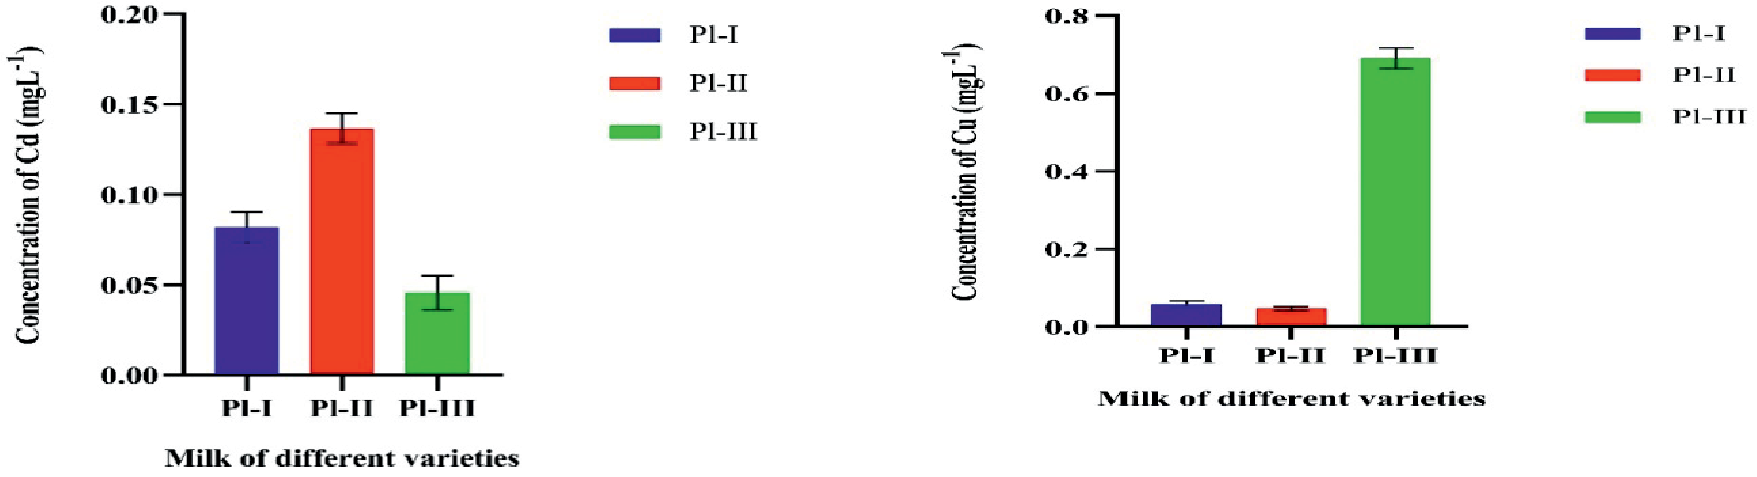
The findings from analysis of the variance of data revealed that the concentration of Cd and Cu were highly significant (p<0.001, 0.01, 0.05) in a few samples and some were affected non-significantly (p>0.05). The Cd and Cu concentrations ranged from 0.0457 to 0.137 mg/L and 0.0167 to 0.690 mg/L. Table 5 shows the analysis of variance data for Cd and Cu in milk samples. In this study, the maximum Cd level (0.137 mg/L) was observed in cow’s milk feeding on fodder grown in groundwater-irrigated soil at place-2 and the least content of Cd (0.0457 mg/L) was found in milk samples at place-3 whereas the uppermost (0.690 mg/L) level of Cu was observed at place-3 and least content of Cu (0.0167 mg/L) was found in milk samples at place-2 (Fig. 4).
Cd and Cu Concentrations in Cow Hair
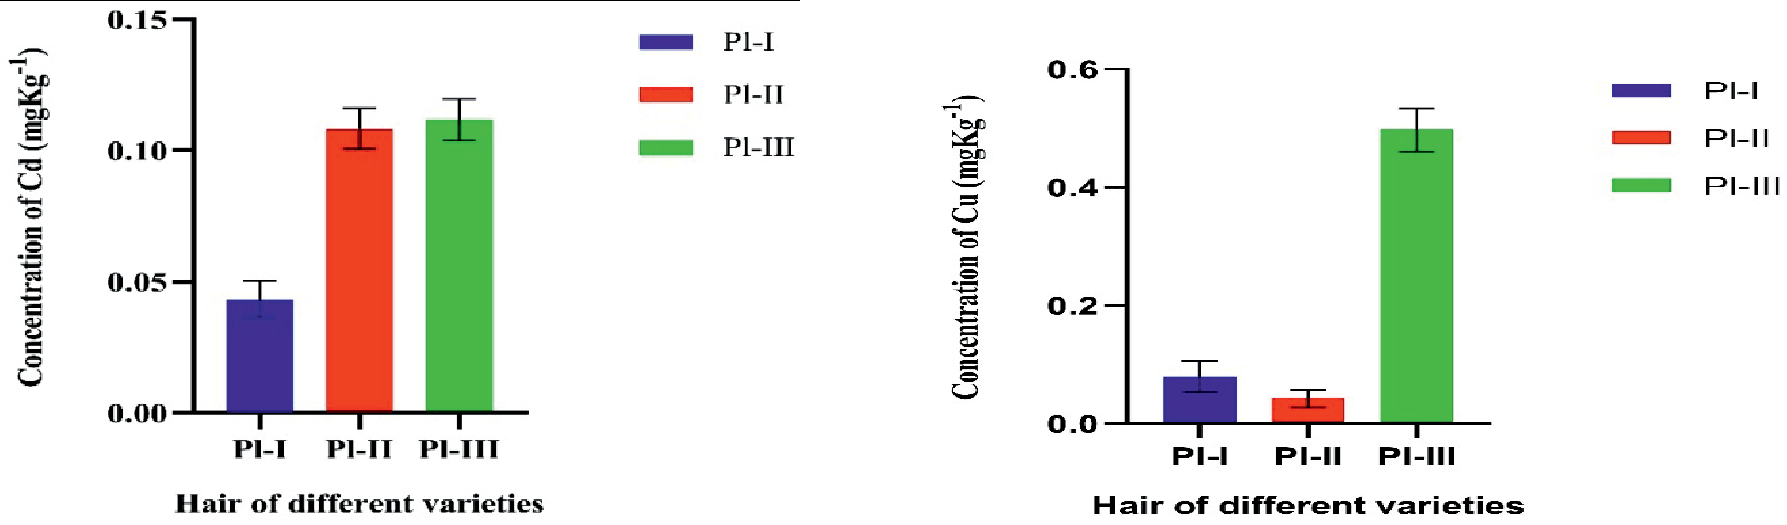
Fig. 5 illustrates the concentration of Cd and Cu ranged from 0.043 to 0.112 mg/kg and 0.0427 to 0.497 mg/kg, respectively. Table 6 illustrates the analysis of variance data in hair samples of cows. Cadmium amounts for hair were observed to be greater at Pl-III (0.112 mg/kg) and lower at Pl-I (0.043 mg/kg). For hair, a higher concentration of copper was found at location 3 (0.497 mg/kg) and lower at location 2 (0.0427 mg/kg).
Fig. 2.
Alteration of Cd and Cu in soil samples of fodder at selected sites, Joiya (Place-I), Talokar (Place-II) and Khushab (Place-III).
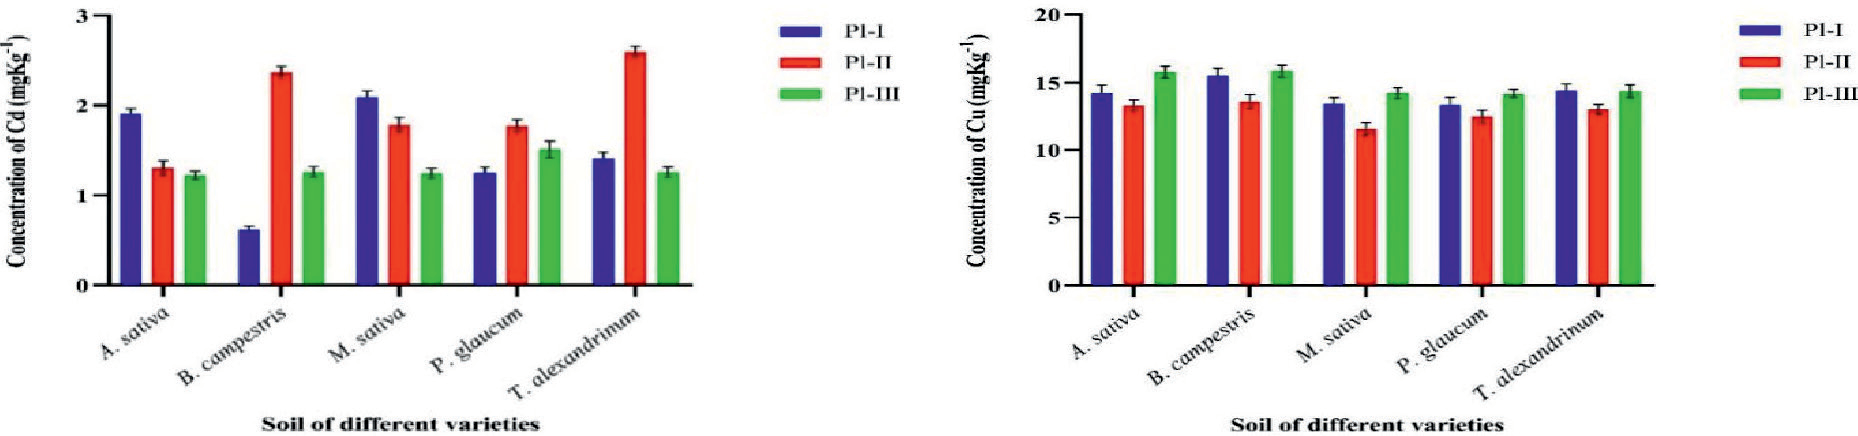
Fig. 3.
Alteration of Cd and Cu in fodder samples at selected sites, Joiya (Place-I), Talokar (Place-II) and Khushab (Place-III).
Correlation of Cd and Cu
The Pearson correlation matrices with the correlation coefficient (r) for the specimen were used in the study to correlate the impact of one metal uptake on the amount of another metal in a similar specimen. The strong positive correlation between the metals’ characteristics may be caused by shared manmade or biogenic as well as chemical similarities whereas the negative correlation suggests that the most recent intake of these metals may have an impact on the metals absorbed by the feed. Non-significant positive correlation appears due to edaphic factors whereas a non-significant negative correlation reveals a metal imbalance among variables.
The Pl-I, Pl-II and Pl-III presented negative non-significant correlation in cadmium and all the locations presented negative non-significant correlation for water-soil in copper. In the case of soil-fodder, the Pl-I and Pl-II revealed a positive significant correlation while Pl-III showed a negative significant correlation among cadmium whereas all sites revealed a positive non-significant correlation among copper. From fodder to milk for cadmium, a negative non-significant correlation was described by Pl-I and Pl-III, while Pl-II revealed a positive non-significant correlation whereas a negative non-significant correlation was described by Pl-III, while Pl-I and Pl-II showed positive non-significant correlation among copper. The Pl-I and Pl-III showed a positive non-significant correlation and Pl-II presented a negative significant correlation for fodder to hair among cadmium whereas the Pl-I and Pl-III revealed a positive non-significant correlation and Pl-II presented negative non-significant correlation for fodder to hair in copper (Table 7, Figs 6-13).
Table 5.
Analysis of variance data for Cd and Cu in collected milk samples.
| Source of variation (S.O.V) | Degree of Freedom | Mean square value of Cd milk | Mean square value of Cu milk |
|---|---|---|---|
| Site | 2 | 0.006301ns | 0.427887*** |
| Error | 6 | 0.002368 | 0.004473 |
| Total | 8 |
Table 6.
Analysis of variance data for Cd and Cu in collected hair samples.
| Source of variation (S.O.V) | Degree of Freedom | Mean square value of Cd hair | Mean square value of Cu hair |
|---|---|---|---|
| Site | 2 | 0.004453ns | 0.19101** |
| Error | 6 | 0.008083 | 0.01060 |
| Total | 8 |
Table 7.
Pearson correlation of Cd and Cu between water-soil, soil-fodder, fodder-milk and fodder-hair.
Pollution Load Index (PLI) of Cd and Cu
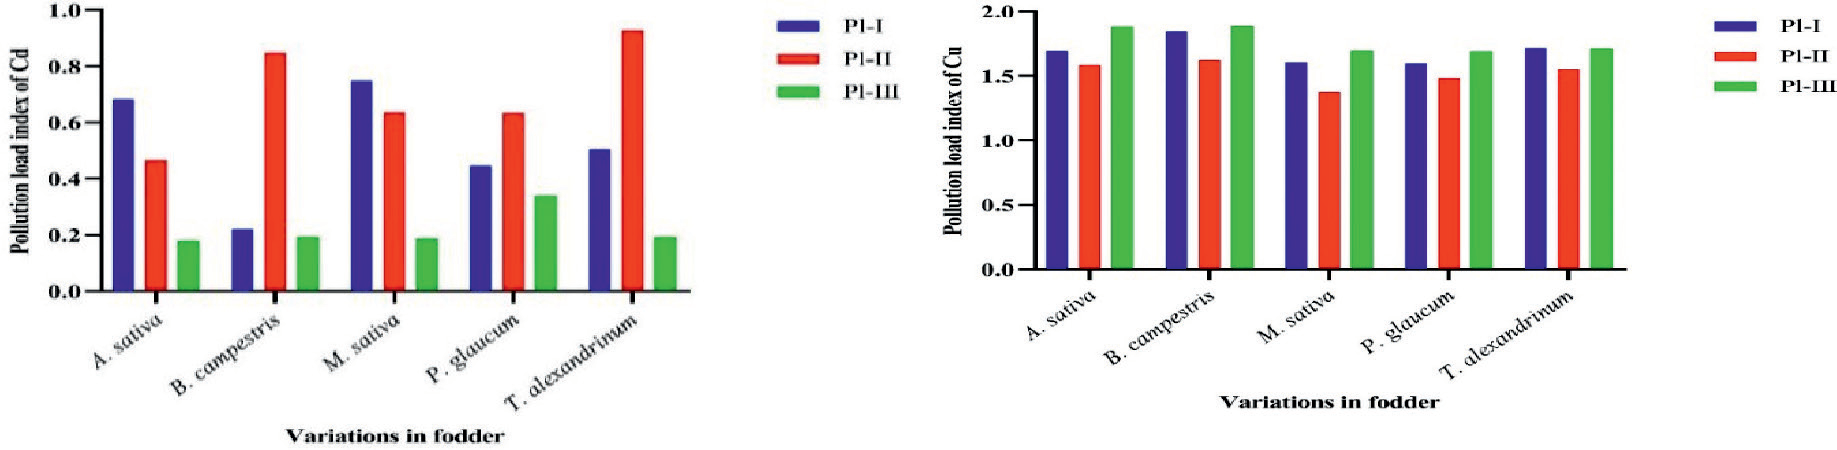
Figure 14 shows the PLI values for cadmium and copper. The pollution load index was used to calculate the degree of pollution in soil. The soil of T. alexandrinum of location-2 confirmed elevated PLI value (0.929) for Cd as compared to others while the lowest value (0.0796) was examined in the soil of A. sativa at location-3. On the other hand, the soil of B. campestris of Pl-III confirmed an elevated PLI value (1.8895) for Cu as compared to others while the lowest value (1.377) was determined in the soil of M. sativa at Pl-II.
Bioconcentration Factor (BCF) for Cd and Cu
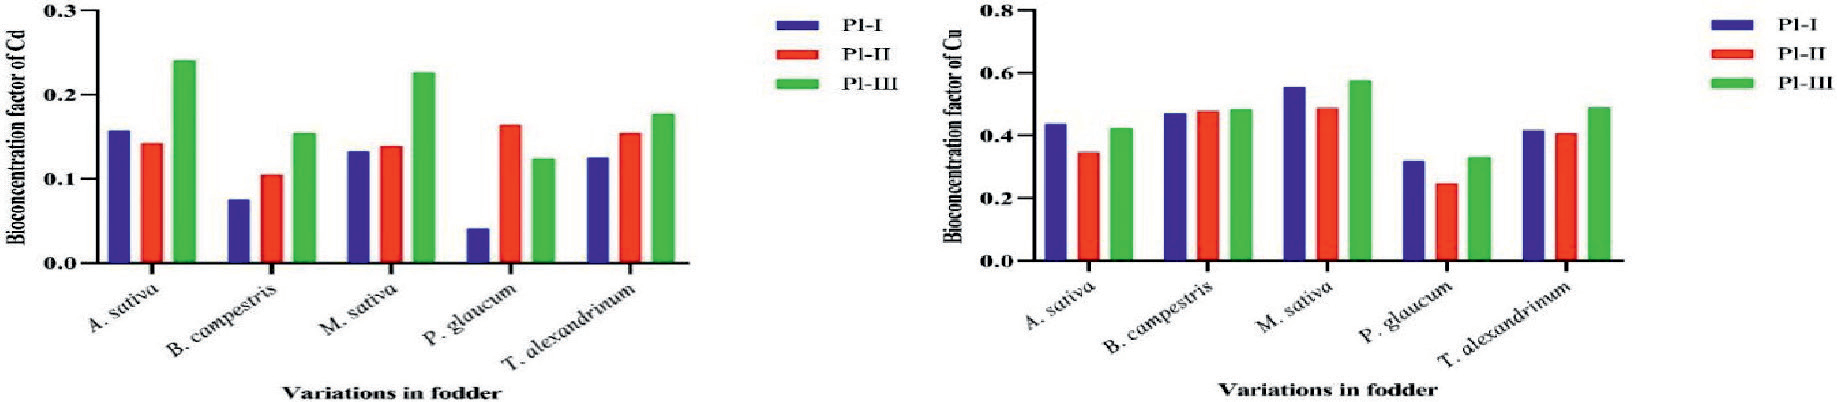
The bioconcentration factor for Cd and Cu varied between 0.0024-0.6968 and 0.2482 to 0.576 in fodder. Among Cd, the highest BCF value was discovered in M. sativa at Pl-III, while the least content of BCF was detected in Pennisetum glaucum at Pl-III whereas for Cu the utmost proportion of BCF was demonstrated at Pl-III in M. sativa, while least content of BCF was detected in P. glaucum at Pl-II (Fig. 15).
Enrichment Factor (EF) for Cd and Cu
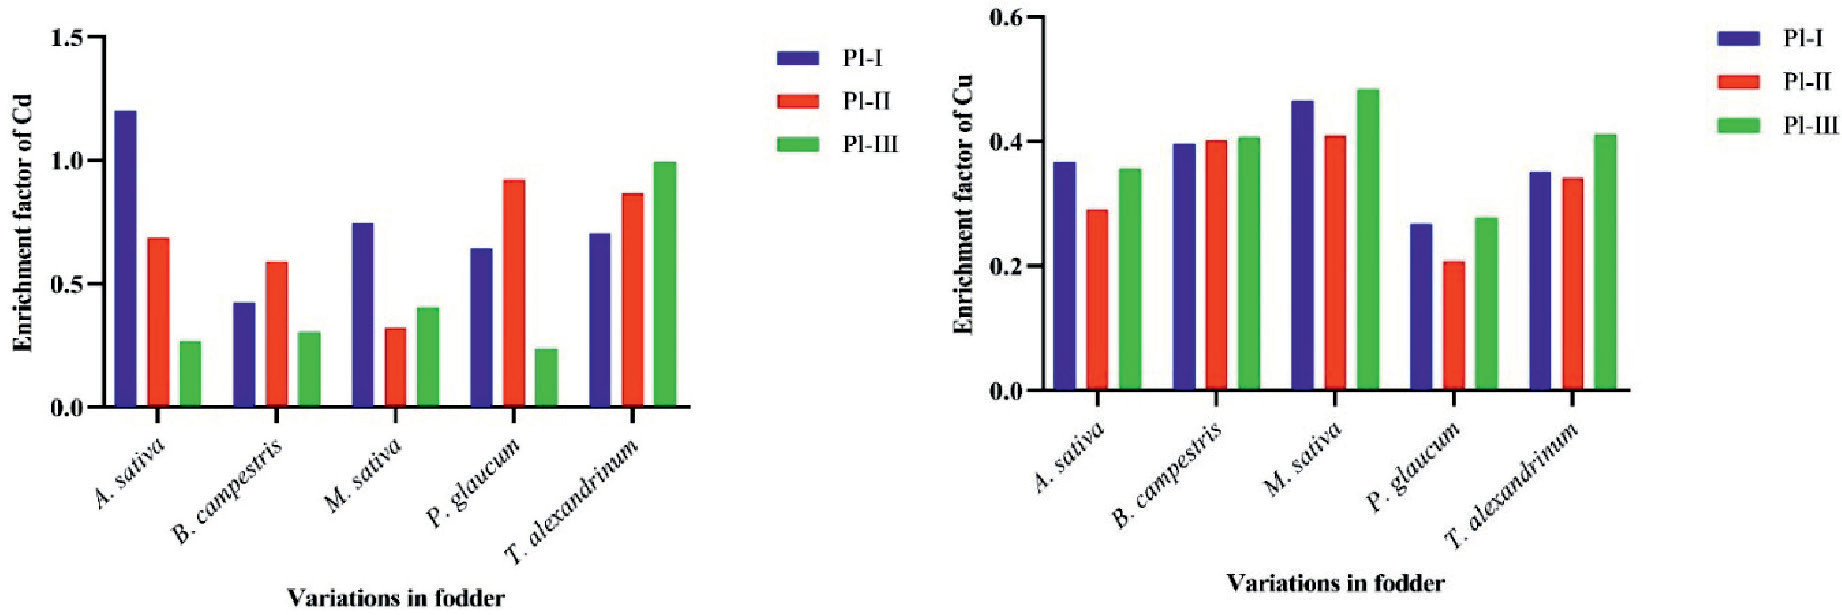
The EF values for Cd fluctuated from 0.0136 to 3.9019 and the EF values for Cu values fluctuated from 0.208 to 0.4831. The peak value of Cd was found in M. sativa (0.0136) at Pl-III and the lowest was also found at Pl-III in P. glaucum (3.9019) whereas the peak value of Cu was detected in M. sativa (0.4831) at location-3 and the lowest was found at location-2 in P. glaucum (0.208). ForCd, the order of EF in fodder at Pl-I was observed as A. sativa>M. sativa>T. alexandrinum>P. glaucum> B. campestris, at Pl-II the order of EF was seen as P. glaucum>T. alexandrinum>B. campestris> M. sativa>A. sativa and Pl-III showed the order of enrichment factor as M. sativa>A. sativa> T. alexandrinum>B. campestris>P. glaucum whereas for Cu, the order of EF in fodder at location-1 was observed as M. sativa>B. campestris>A. sativa> T. alexandrinum>P. glaucum. At location 2, the order of EF was seen as M. sativa>B. campestris> T. alexandrinum>A. sativa>P. glaucum whereas location-3 showed the order of EF as M. sativa> T. alexandrinum>B. campestris>A. sativa>P. glaucum (Fig. 16).
Fig. 6.
Pearson correlation of Cd between water and soil (A) Pearson correlation among levels of Cd in water & soil at Joiya (Place-I); (B) Pearson correlation among levels of Cd in water and soil at Talokar (Place-II); (C) Pearson correlation among levels of Cd in water and soil at Khushab (Place-III).
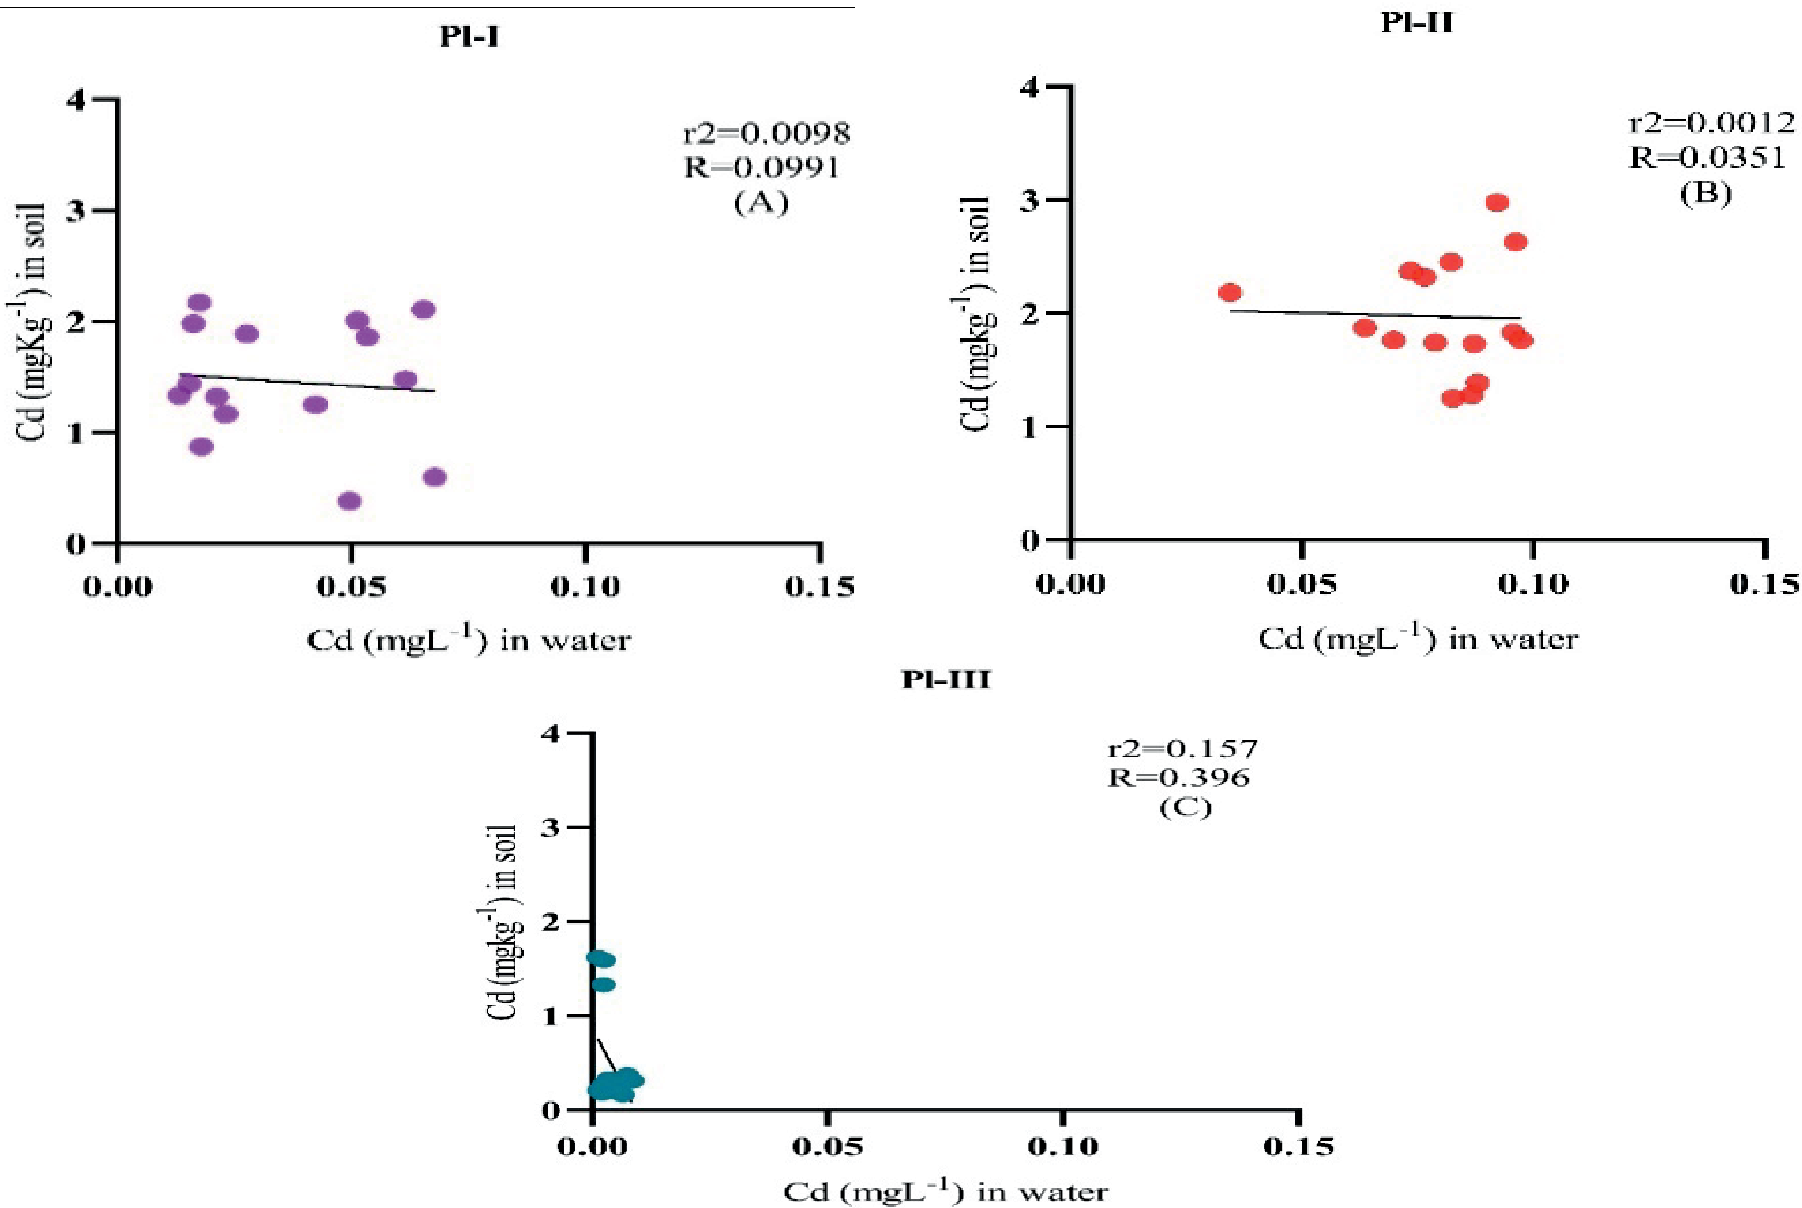
Fig. 7.
Pearson correlation of Cu between water and soil (A) Pearson correlation among levels of Cu in water and soil at Joiya (Place-I); (B) Pearson correlation among levels of Cu in water and soil at Talokar (Place-II); (C) Pearson correlation among levels of Cu in water and soil at Khushab (Place-III).
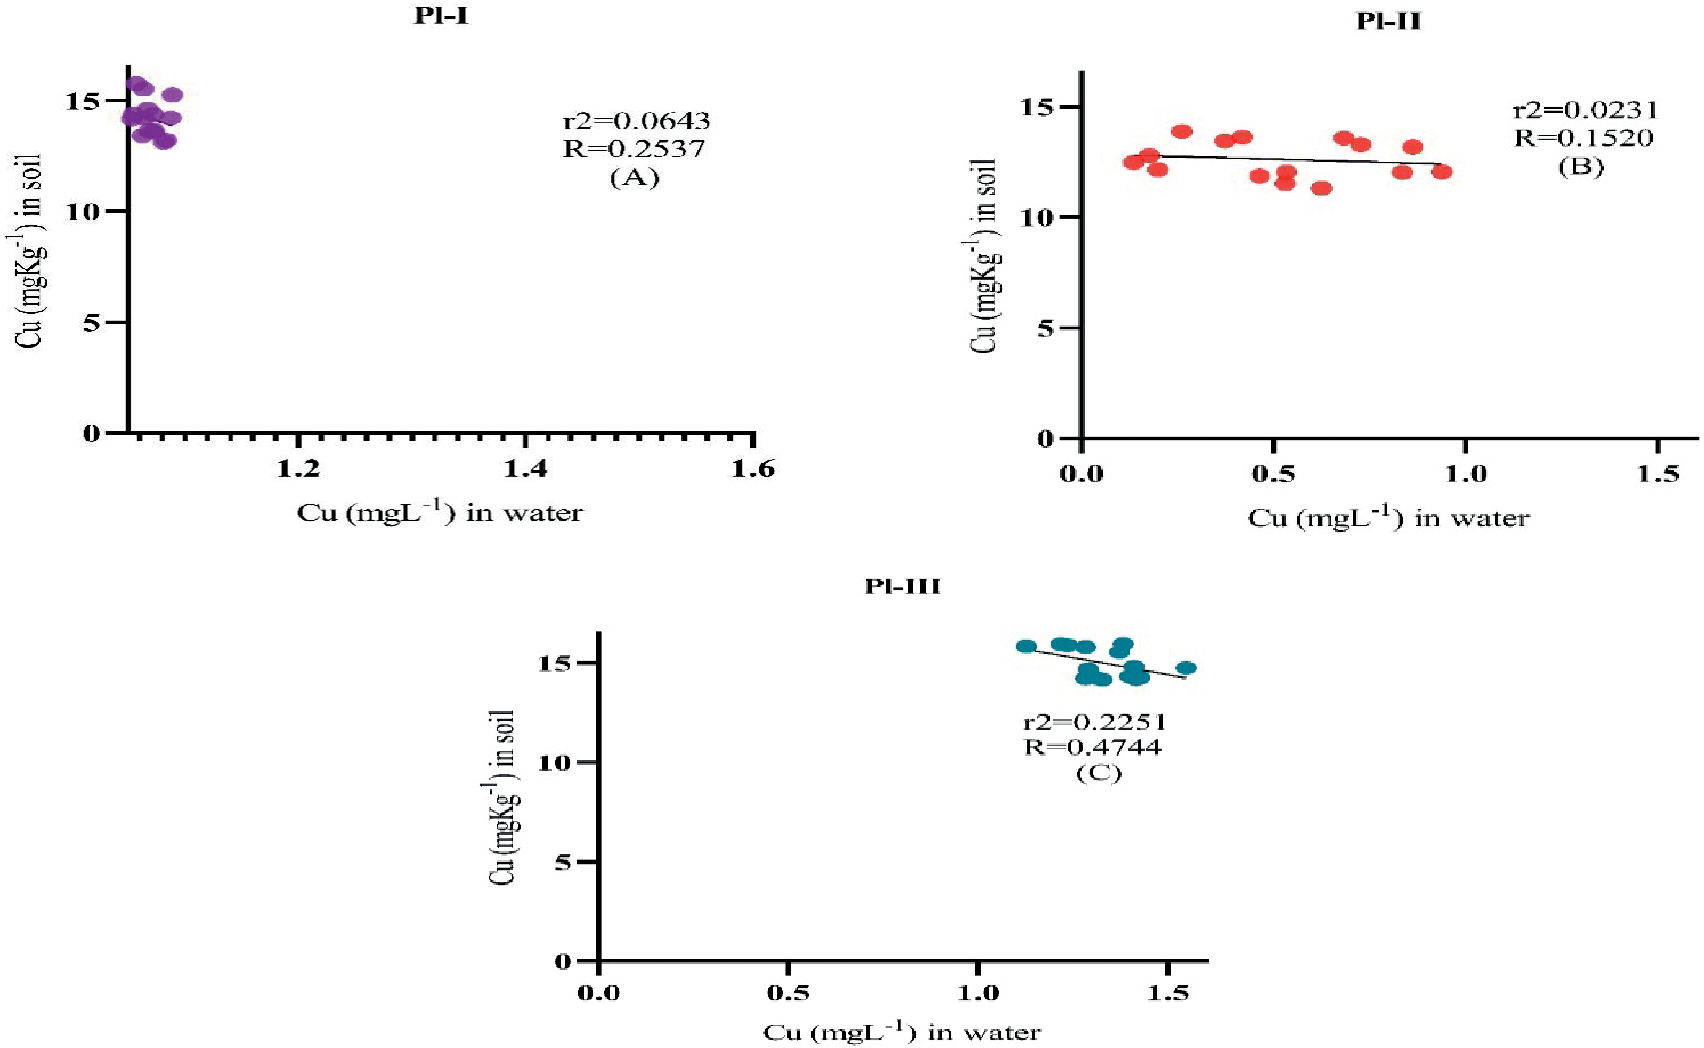
Fig. 8.
Pearson correlation among the amounts of cadmium in plants and soil (A) Pearson correlation among the amounts of cadmium in plants and soil at Joiya (Place-I); (B) Pearson correlation among the amounts of cadmium in plants and soil at Talokar (Place-II); (C) Pearson correlation among the amounts of cadmium in plants and soil at Khushab (Place-III).
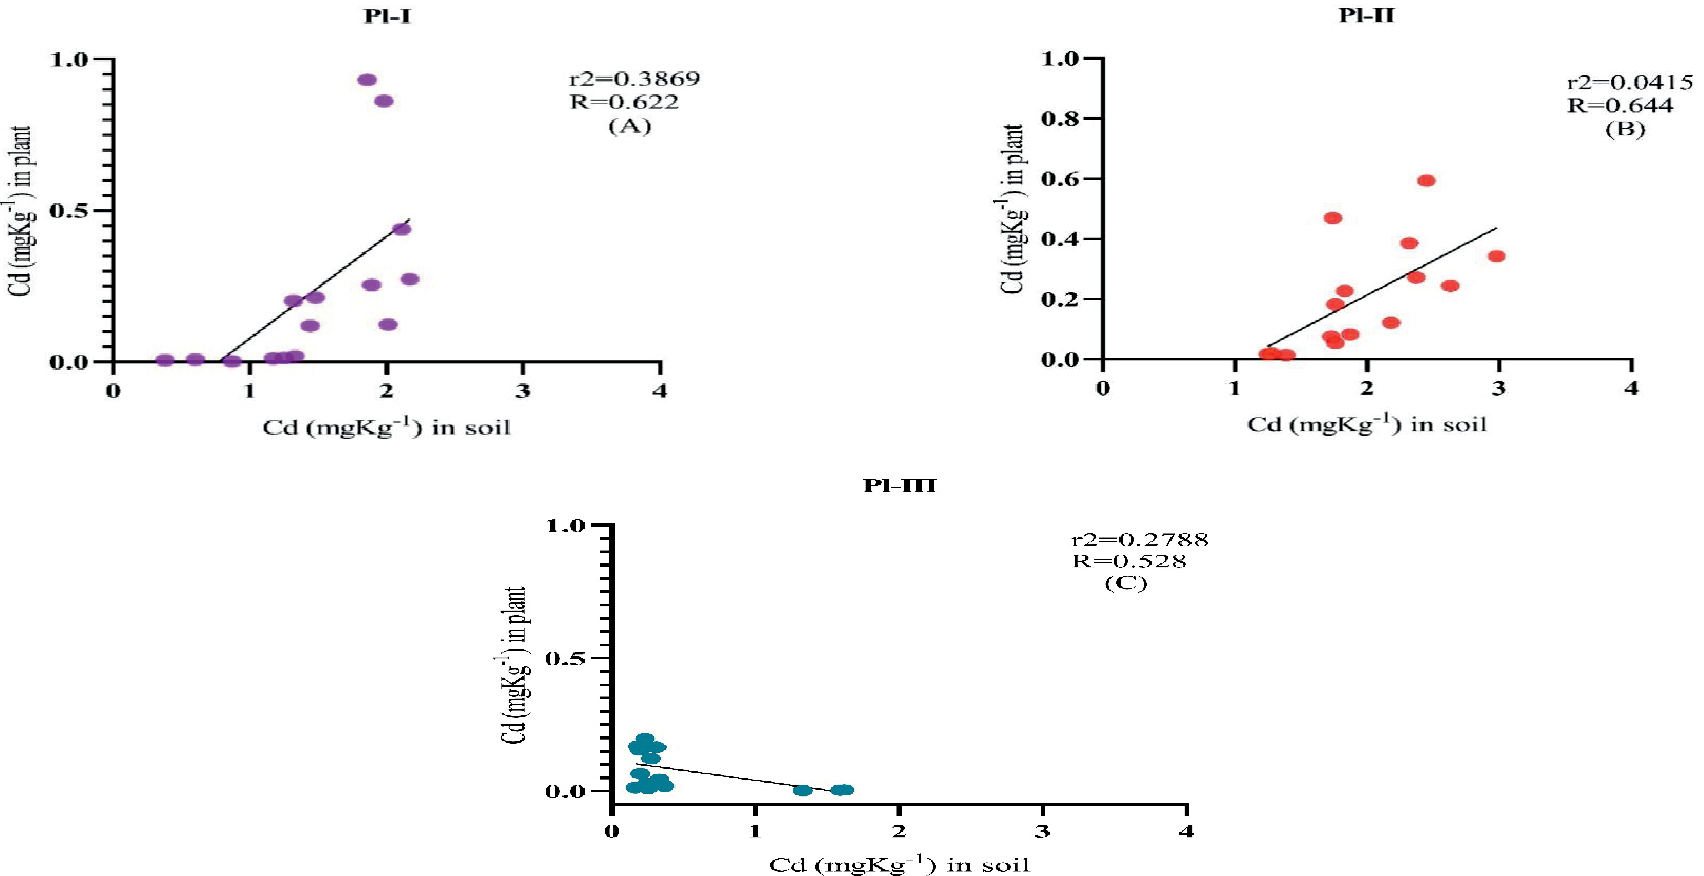
Fig. 9.
Pearson correlation among the amounts of Cu in plants and soil (A) Pearson correlation among the amounts of Cu in plants and soil at Joiya (Place-I); (B) Pearson correlation among the amounts of Cu in plants and soil at Talokar (Place-II); (C) Pearson correlation among the amounts of Cu in plants and soil at Khushab (Place-III).
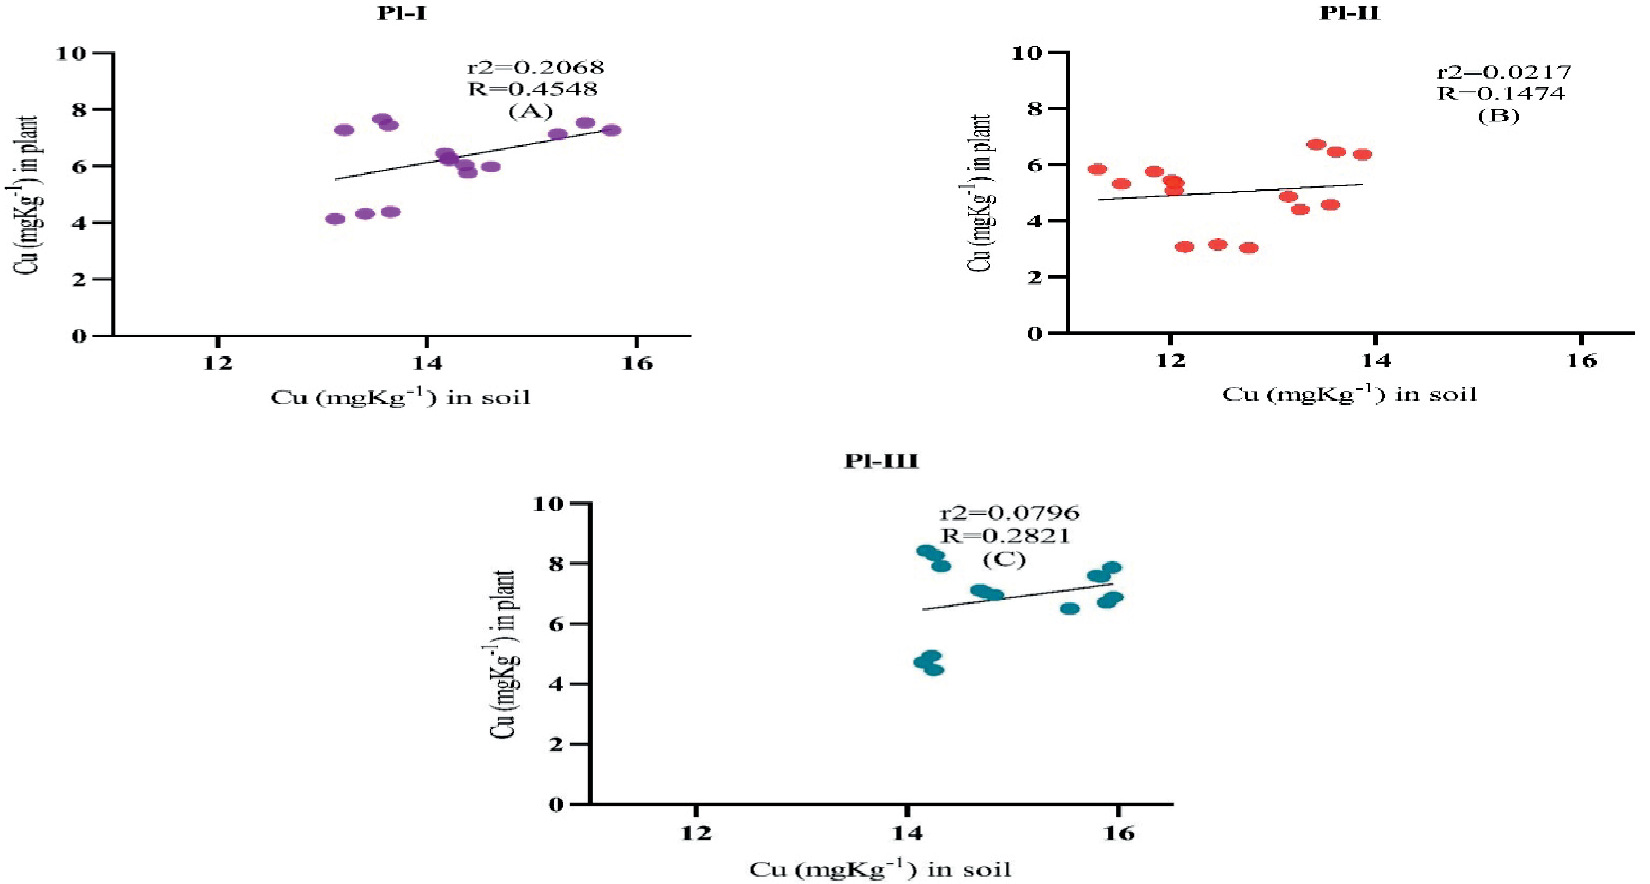
Fig. 10.
Pearson correlation among levels of Cd in plant and milk (A) Pearson correlation among levels of Cd in plant and milk at Joiya (Place-I); (B) Pearson correlation among levels of Cd in plant and milk at Talokar (Place-II); (C) Pearson correlation among levels of Cd in plant and milk at Khushab (Place-III).
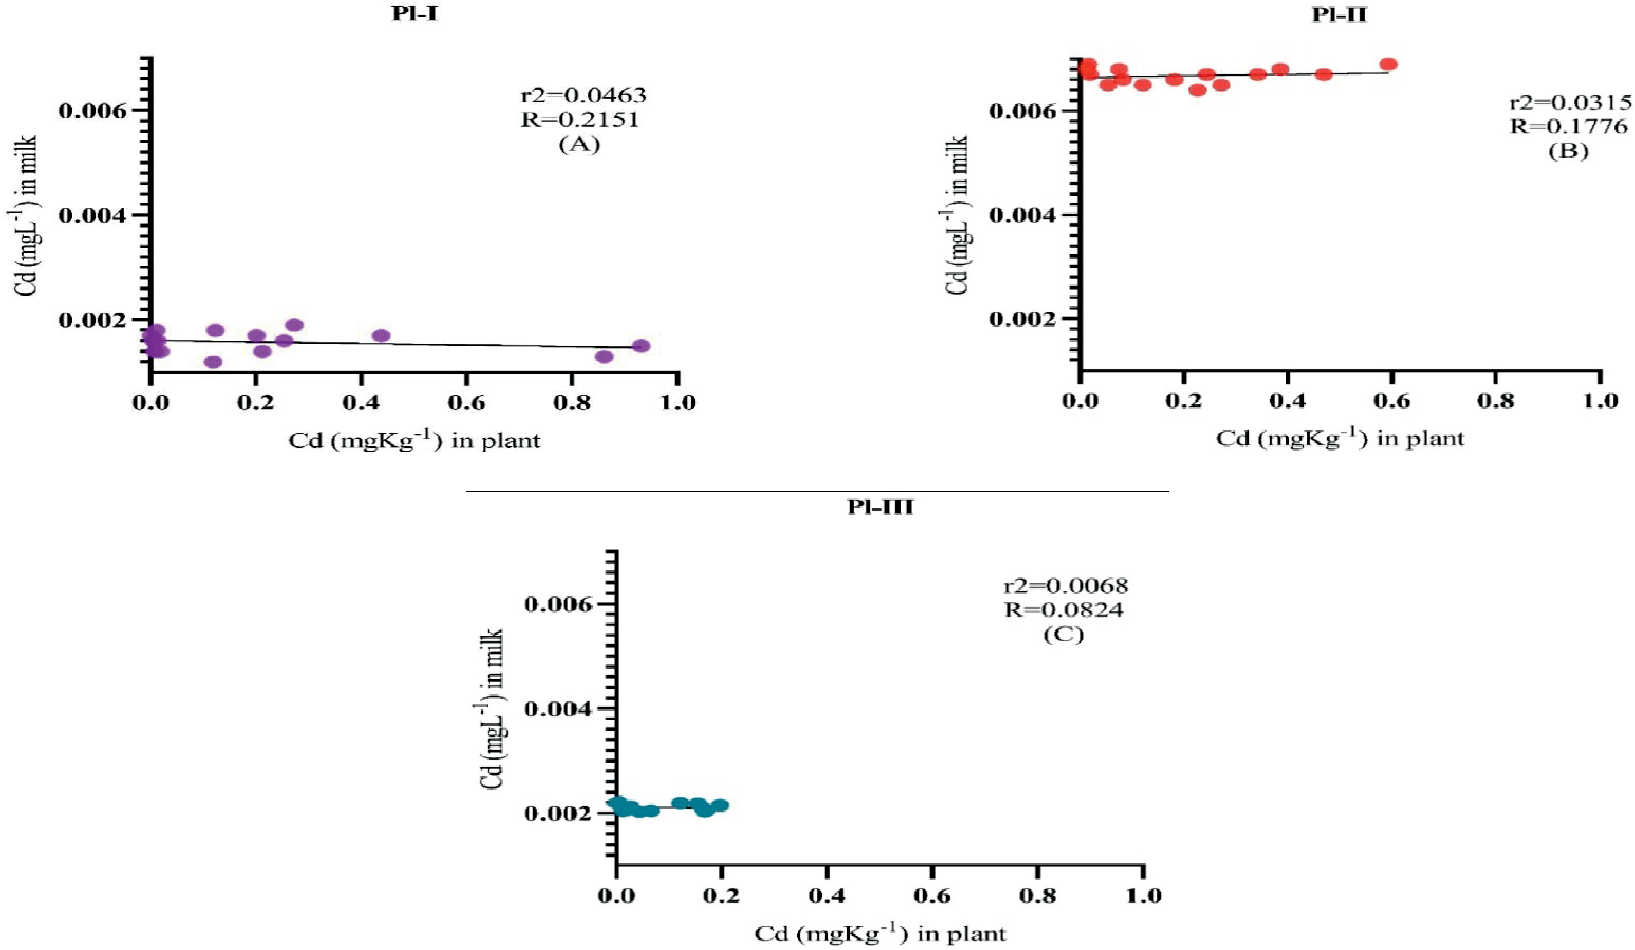
Fig. 11.
Pearson correlation among levels of Cu in plant and milk (A) Pearson correlation among levels of Cu in plant and milk at Joiya (Place-I); (B) Pearson correlation among levels of Cu in plant and milk at Talokar (Place-II); (C) Pearson correlation among levels of Cu in plant and milk at Khushab (Place-III).
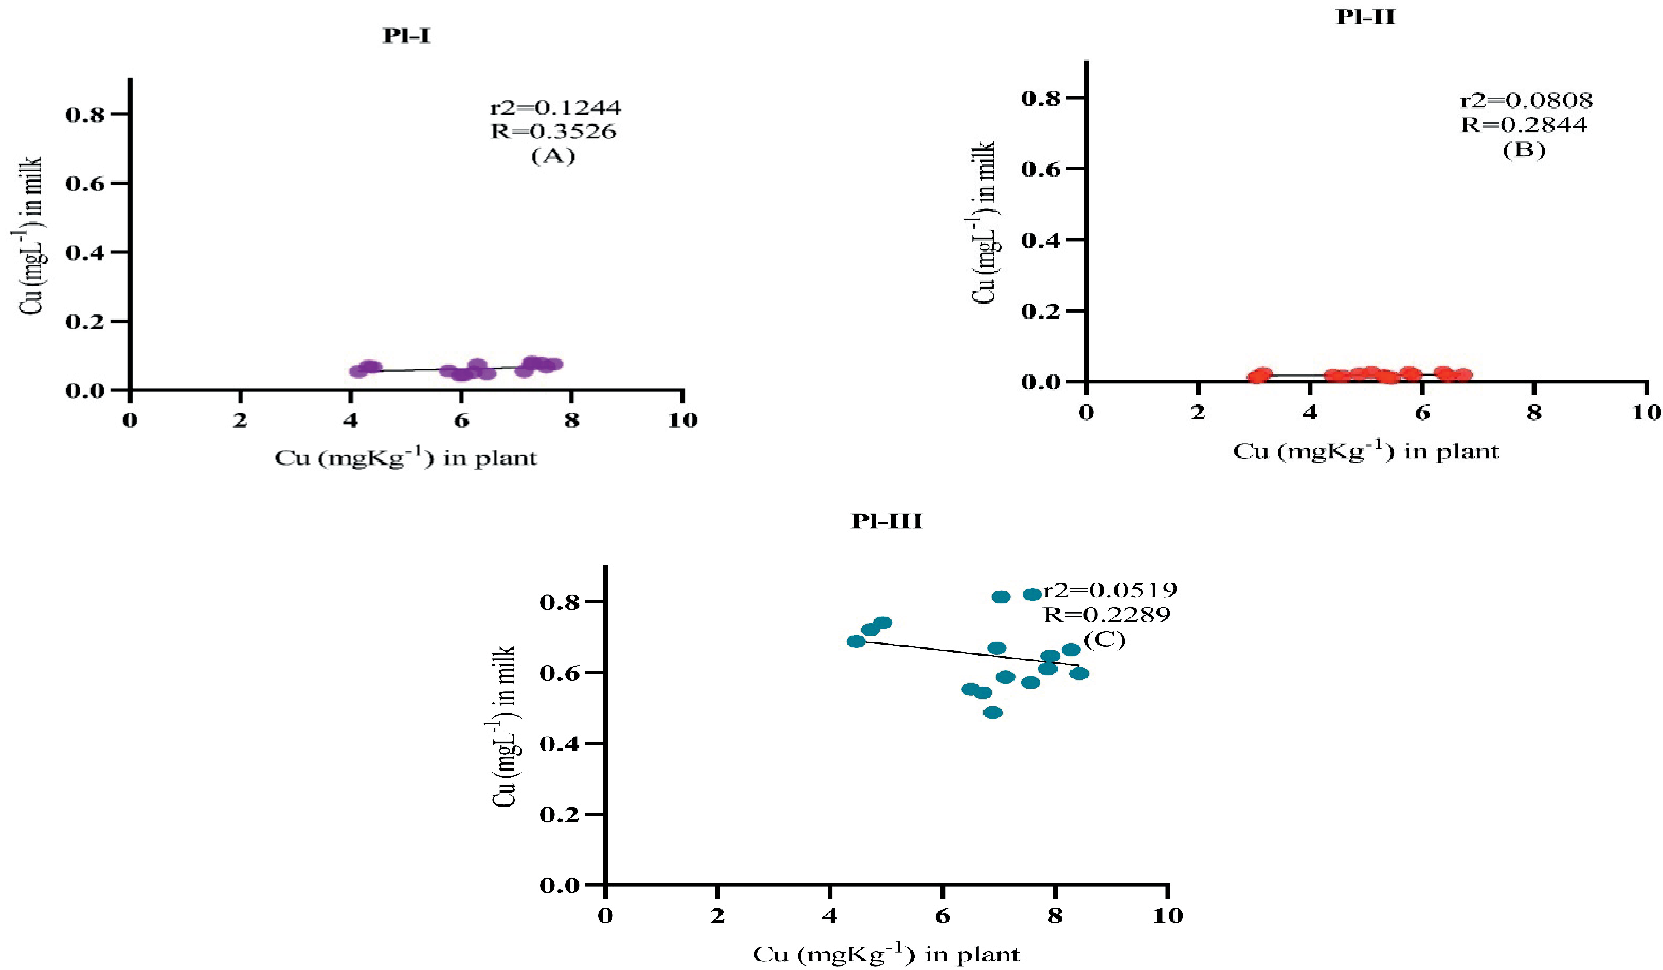
Fig. 12:
Pearson correlation of Cd between plant and hair (A) Pearson correlation among levels of Cd in plant and hair at Joiya (Place-I); (B) Pearson correlation among levels of Cd in plant and hair at Pl-II; (C) Pearson correlation among levels of Cd in plant and hair at Khushab (Place-III).
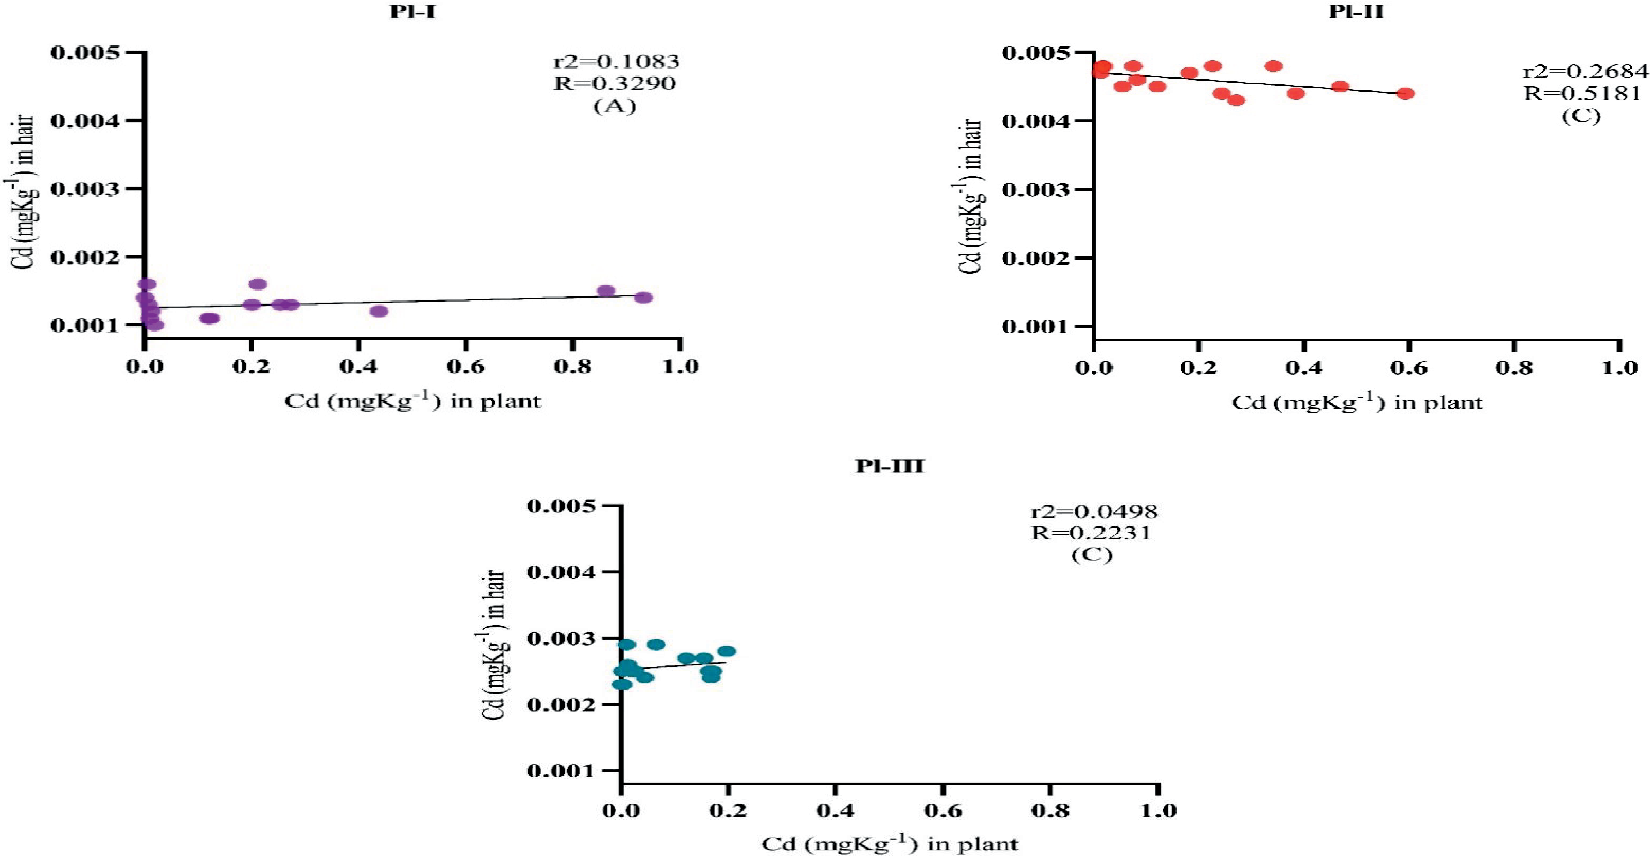
Fig. 13.
Pearson correlation of Cu between plant and hair (A) Pearson correlation among levels of Cu in plant and hair at Joiya (Place-I); (B) Pearson correlation among levels of Cu in plant and hair at Talokar (Place-II); (C) Pearson correlation among levels of Cu in plant and hair at Khushab (Place-III).
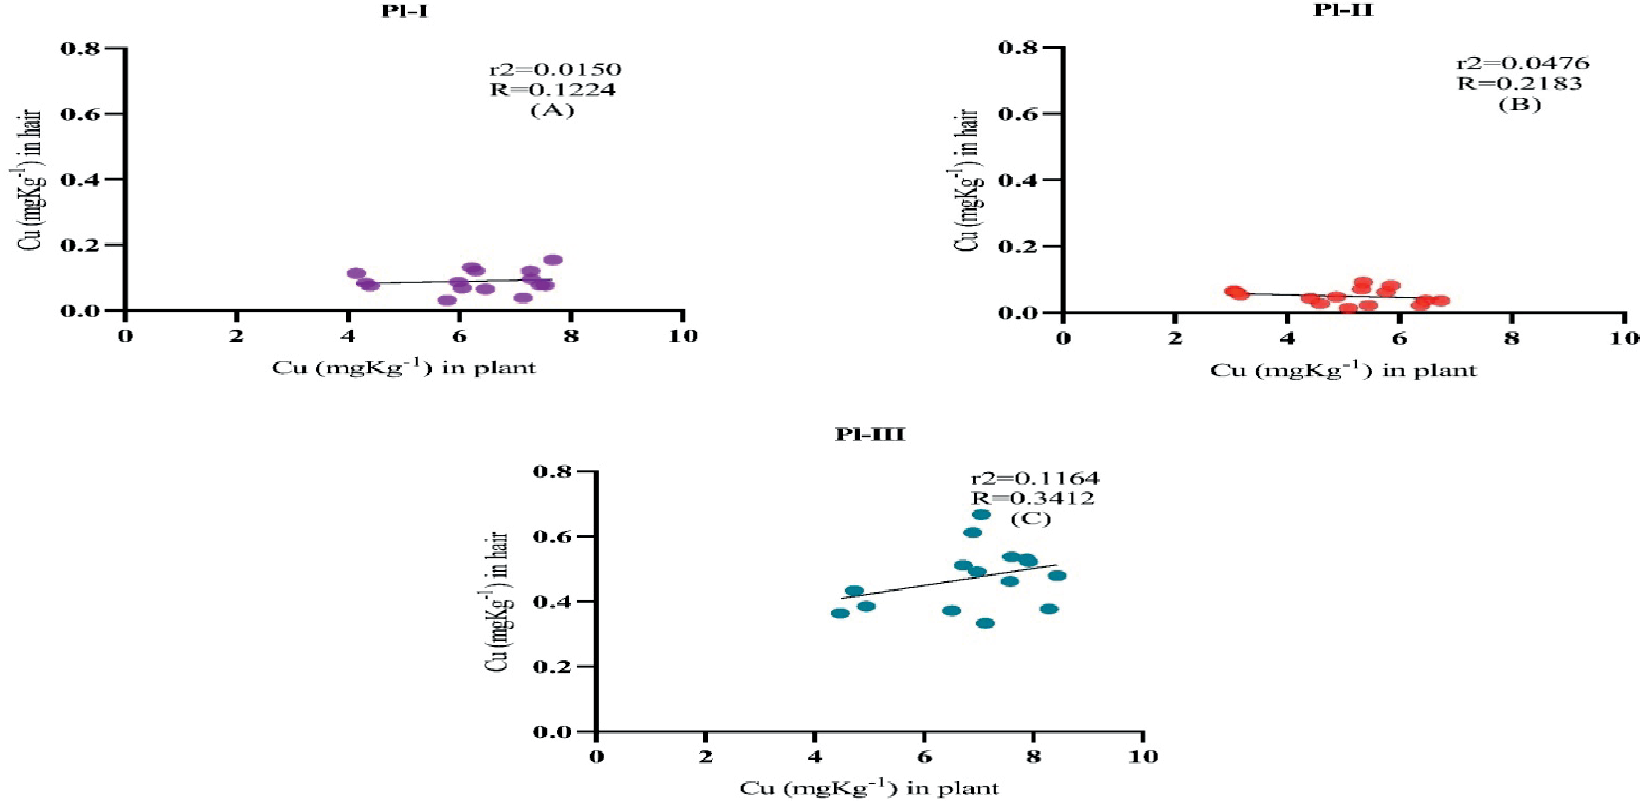
Fig. 14.
Alteration in the values of Pollution load index for Cd and Cu at selected sites, Joiya (Place-I), Talokar (Place-II) and Khushab (Place-III).
Daily Intake of Metal (DIM) for Cd and Cu
Fig. 17 shows that the DIM values for Cd and Cu varied between 0.0000062-0.0012 and 0.0053-0.0140. A.sativa showed an elevated intake of Cd (0.0012) at location 1 while P. glaucum has the lowest level of uptake (0.0000062) at location 3. A. sativa showed the maximum intake of Cu (0.0140) at Pl-III while P. glaucum showed the lowest level of uptake (0.0053) at Pl-II.
Health Risk Index (HRI) for Cd and Cu
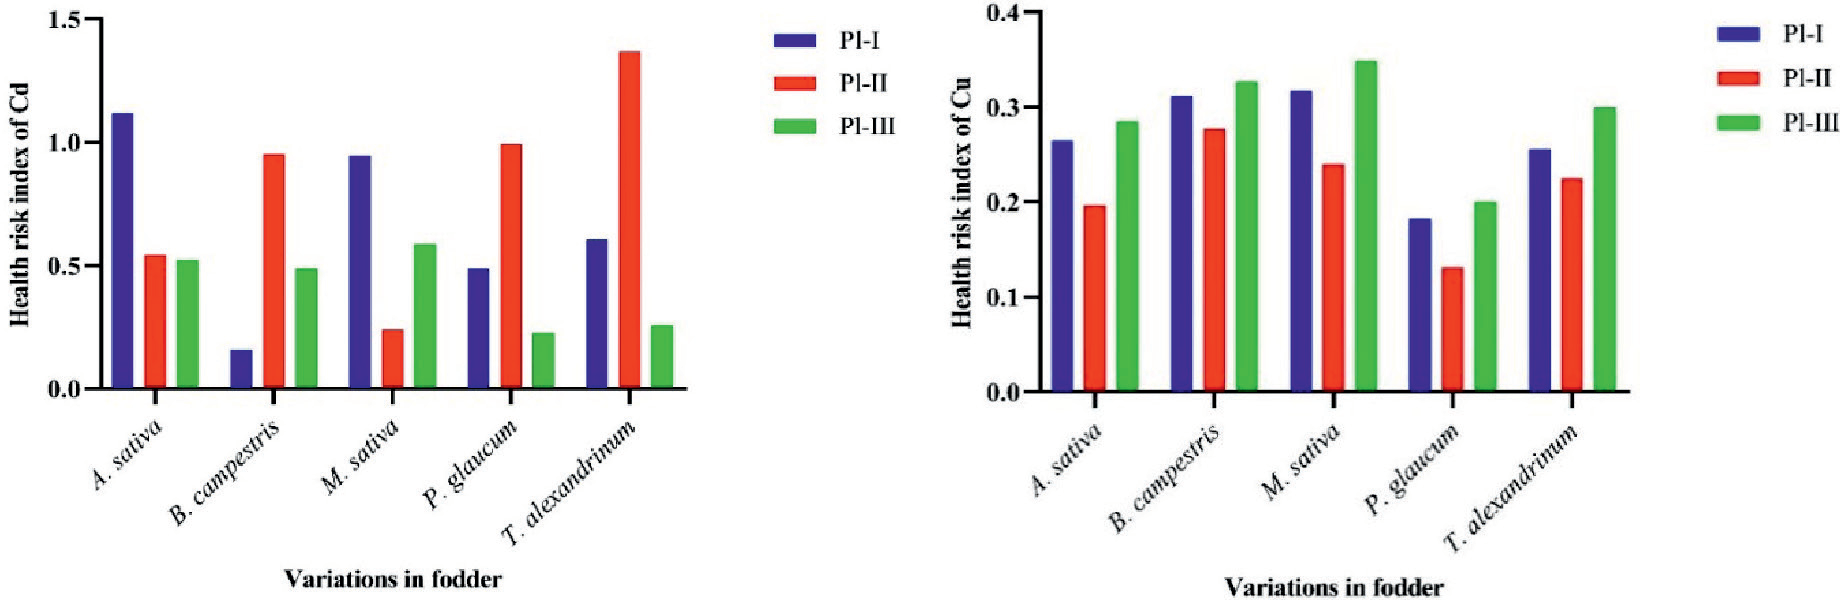
The amount of HRI ranged between 0.012-2.319 and 0.1312-0.3489 for Cd and Cu, respectively. The utmost HRI was observed in A. sativa at place-1 and the lowest in P. glaucumat place-3 for Cd while the uppermost HRI was noticed in M. sativa at place-3 and the lowest in P. glaucum at place-2 for Cu (Fig. 18).
Discussion
The present range of Cd concentrations in groundwater was 0.041-0.065 mg/L. Our measurements of Cd in groundwater were found to be comparable to those by Idrees et al. [22] when the two investigations were compared (0.04-0.07 mg/L). Sultana et al. [23] reported groundwater levels that were higher (0.42-0.71 mg/L) than our cadmium results. According to recent findings, copper concentrations in water differed from 0.585 to 1.341 mg/L. Ahmad et al. [24] predicted a Cu content range for water of 0.52-0.57 mg/L, which is consistent with our results. FAO, WHO and the European Standard Guidelines established that the maximum permissible levels of Cd and Cu in water are 0.01 and 0.2 mg/L, respectively [8]. The values determined for both metals in the present study are above the reported maximum values.
Fig. 17.
Alteration in the Daily intake of Cd and Cu from fodder at selected sites, Joiya (Place-I), Talokar (Place-II) and Khushab (Place-III).
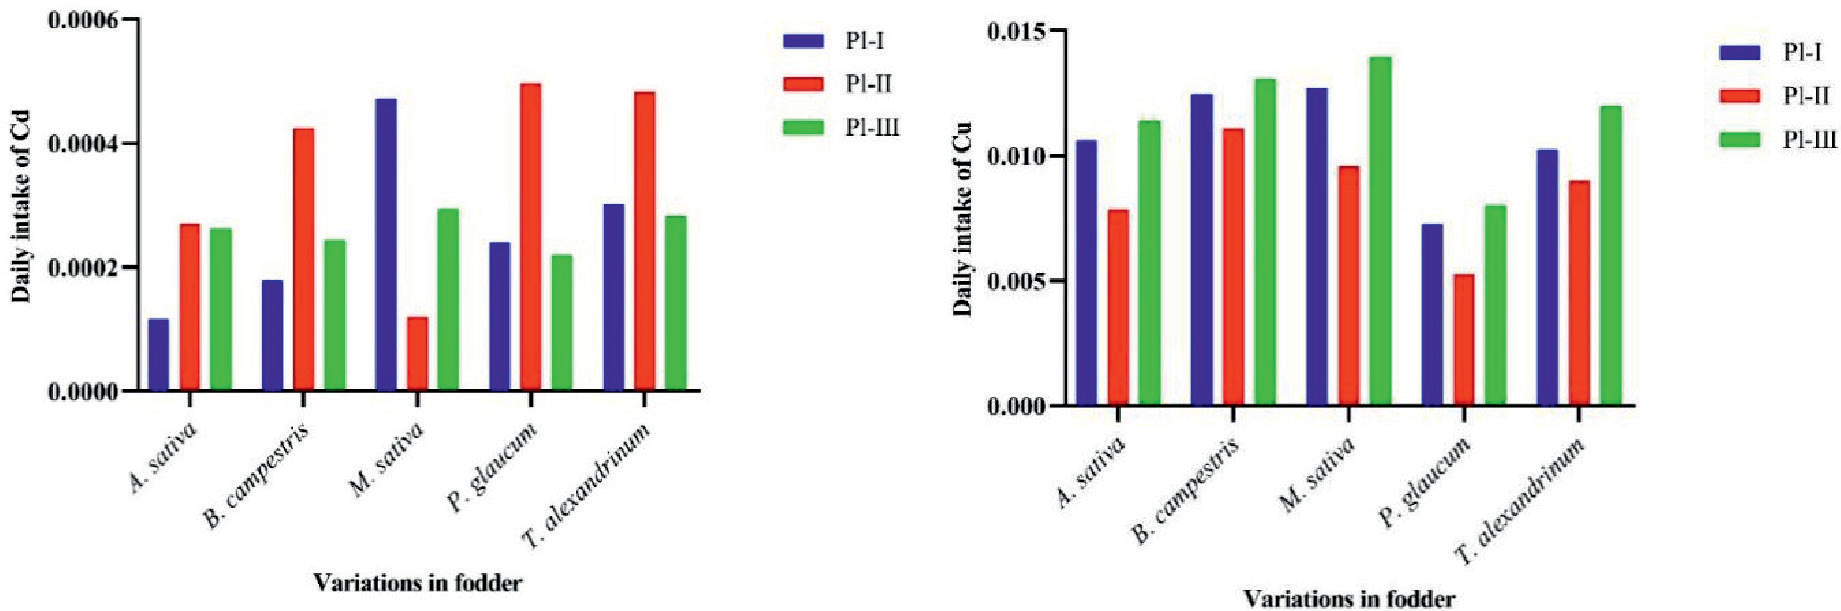
Fig. 18.
Alteration in the values of the Health risk index of Cd and Cu via intake of fodder at selected sites, Joiya (Place-I), Talokar (Place-II) and Khushab (Place-III).
The amount of Cd discovered in the soil during the current study fluctuated between 0.223 to 2.600 mg/kg. Less significant results for soil Cd were obtained from the present investigation than the concentrations reported by Fosu-Mensah et al. [25]. The lowest Cd level was examined in all soil specimens in contrast to the amount (11.22 mg/kg) revealed by Chaoua et al. [26]. Khan et al. [27] revealed a larger range of cadmium in soil than previous findings. The current value of copper in soil irrigated by groundwater showed a variation from 11.550 to 15.853 mg/kg. The present content of copper in soil was higher than the 1.3-4.8 mg/kg range provided by Hamid et al. [28] and lower than the indicated range (52.1-77.3 mg/kg) by Addis and Abebaw [29]. Lower figures for the amount of Cu in soil than this one were proposed by Patodkar [30]. Considering the maximum allowable Cd (1.49 mg/kg) and Cu (8.39 mg/kg) values in soil [8], it was determined that the Cd values in the soil samples of this study were below these values, but the Cu values were above the allowed values.
The Cd content in the fodder samples varied from 0.0037 to 0.682 mg/kg. The concentration detected by Yu et al. [31] is lesser than the current Cd results. Our estimates of the Cd content in fodder samples are lower than the values reported by Ghazzal et al. [32]. The Cu content of the feed varied in the current study, ranging from 3.0917 to 8.208 mg/kg. The latest research’s findings on Cu concentrations in forages were greater than the values of Ahmad et al. [33] and lesser than the concentration stated by Helmer et al. [34]. The Cu content in forages according to the investigation of Johnsen and Aaneby [21] is lower than what was actually seen.
The current study determined that cow’s milk contains 0.0457-0.137 mg/L of cadmium. The present readings are more than the concentration range of 0.0284-0.0723 mg/L reported by Munir et al. [35]. Toman et al. [36] noted that the quantity of Cd in cow’s milk was 0.002 mg/L, which is lower than the findings of a recently completed study, but higher than the previously reported value of Cd (0.02 mg/L) by Chirinos-Peinado and Castro-Bedriñana [37].
The mean level of Cu in the cow’s milk sample varied from 0.0167 to 0.690 mg/L. According to the National Research Council, milk should contain 0.15 to 0.20 milligrams of Cu per litre, however, some study findings show greater levels. The range of the current readings was found to be fewer than the Cu concentration values in cow’s milk published by Abeidi et al. [38], which were determined to be 0.02-0.06 mg/L. In comparison to the concentration of Cu detected in the current investigation, the range of Cu in cow’s milk samples (0.041-0.093 mg/L) reported by Ismail et al. [39] was likewise lower.
Hair is used as a helpful indication to determine the level of cadmium in ruminants. In the current investigation, the amount of Cd detected in cow hair fluctuated between 0.043-0.112 mg/kg. Our hair Cd readings were higher than the reported amount of 0.03 mg/kg for mean hair Cd levels in cows by Grushanska et al. [40]. For the current investigation, the level of copper in cow’s hair occurred between 0.0427-0.497 mg/kg. The results of Miroshnikov et al. [41] in cow’s hair were greater than those of the present study, ranging from 6.66 to 11.16 mg/kg. The outcomes of the present study were lower than the values of Perillo et al. [42].
The soil used in the current investigation had a Cd PLI value that fluctuated between 0.0796-0.929. The mean PLI value for Cd was less than 1, indicating that the soil is suitable for fodder development and that Cd cannot have any hazardous effects. Our results were less than the PLI range given by Jorfi et al. [43]. In another investigation performed by Siddique et al. [44], the value of PLI (1.11-3.317) for Cd was discovered to be greater than the recorded value in the current researched region. The range of the soil Cu PLI for the current study was 1.8895-1.377. PLI is harmful to humans if it is more than 1. PLI less than 1 indicates that there are no heavy metals present. The PLI values were higher than 1, as indicated by the findings, indicating that there was soil contamination with Cu. The PLI values for Cu shown by El-Aassar et al. [45] were lesser than those in the present investigation.
For the current investigation, the BCF content of the feed varied between 0.0024-0.6968. The BCF value recorded was 0.63-0.80, which was higher than the current values, according to Ahmad et al. [24]. The value of BCF for the current study was less than the Cd BCF value published by Siddique et al. [44]. The range of copper values for BCF was 0.2482 to 0.576, which is less than the conclusions of Amin et al. [46]. The high BCF value of heavy metals demonstrated their poor soil retention and facile metal transfer through forages.
For this particular study, the EF values varied from 0.0136-3.9019. The current Cd EF value was less than the average Cd EF (15.138) reported by Feska et al. [47]. Additionally, our EF values are lower than the findings reported by Muzerengi [48]. A higher EF value suggests less metal retention in the soil whereas a lower EF value indicates greater metal retention. The EF values for Cu varied from 0.208 to 0.4831 which was less than the EF value (1.08-2.17) obtained by Kouidri et al. [49].
The recent research revealed that the DIM content varied between 0.0000062-0.0012. The DIM values for Cd in the current study were discovered to be lower than 1, which finally demonstrates no harm to the health of animals in the study region from Cd. Our results were consistent with the DIM concentration for Cd (0.001) reported by Chaoua et al. [26]. Chen et al. [50] showed a range for Cd (0.0001-0.0029), which is greater than the current results but lower than DIM values for Cd in different feeds, which varied from 0.0000527 to 0.000149 found by Khan et al. [27]. According to the current study’s copper DIM concentration range of 0.0053 to 0.0140, which was lower than 1, there is no harm to animals’ health from forages grown in polluted soil. While a comparable range concentration of copper DIM to that found in the subsequent investigation by Akhtar et al. [51], Ahmad et al. [33] reported high Cu DIM (0.01-0.59) in comparison to the current study.
The current HRI values, which were fewer than the amounts determined by Ghazzal et al. [32] ranged from 0.012 to 2.319. When the HRI’s f value exceeds 1, there are health hazards associated with eating fodder. According to the Cd HRI result at this time, animals that consume forages growing in groundwater may become poisonous due to Cd. Polluted feed may be a source of pollution that the Health Risk Index measures [52-55]. Metals are not hazardous to animals if the HRI value is less than one, but cattle are in danger of toxicity when the HRI concentration is greater than 1. The results of the current study’s HRI measurements, which fluctuated between 0.1312- 0.3489 and were less than one, show that forages produced in groundwater soil are not poisonous in terms of copper.
Conclusion
Heavy metal contamination is currently the main global concern. Animals are exposed to a variety of health concerns as a result of the considerable natural and anthropogenic sources of heavy metals that enter the food chain. The water values determined for both metals are above the permissible maximum values. Also, the Cd values in the soil samples were below the permissible maximum values, but the Cu values were above the allowed values. Metals are not hazardous to animals if the HRI value is less than one, but cattle are in danger of toxicity when the HRI concentration is greater than 1. According to the HRI measurements, animals that consume forages growing in groundwater may become poisonous due to Cd.

