

Introduction
Soil is essential for human life, social progress, and sustainable development of resources [1]. However, as industrialization progresses globally, the challenges related to soil pollution have intensified, making its control a focal point of academic and environmental concern. [2-4]. Inorganic heavy metals are particularly impactful in soil pollution due to their high density (greater than 4.0 g·cm-³ for metal elements and 5.0 g·cm-³ for other elements) and are commonly found in elements like As, Cd, Cr, Cu, Hg, Ni, Pb, Zn, and so on [5, 6]. These metals are characterized by their extensive pollution range, persistence, covert nature, high biological toxicity, and resistance to degradation, complicating the remediation of affected areas [7, 8]. Furthermore, heavy metal pollution can adversely affect both the ecological environment and human health, making pollution evaluation and health risk assessments critically necessary [9-11].
At present, soil heavy metal pollution has become a global research hotspot, and many scholars have conducted relevant research on different research areas, analytical methods, and model constructions. For example, Jiang et al. [12] conducted a soil heavy metal source analysis and health risk evaluation in a township in Jiangsu Province, and the results showed that the total carcinogenicity risk of the soil in the study area was about 10 times the acceptable risk limit. Ihedioha et al. [13] evaluated the levels of some heavy metals in soils near a solid waste dumping site in Uyo, Nigeria, and made a human health risk assessment. Gupta et al. [14] conducted a study on heavy metal pollution and health risk assessment in agricultural soil in Jansi, India, dividing the research subjects into two groups: adults and children. This is also the most common grouping method that applies to various situations. For some regions, different scholars have also carried out more rigorous grouping, such as Yang et al. [15] and Jiang et al. [16]. In their studies, the population was categorized into three groups: adult males, adult females, and children, in order to estimate the risk more accurately. Wu et al. [17] calculated the chronic daily intake (CDI) to finally derive the corresponding non-carcinogenic risk (HI) and carcinogenic risk (CR) in Dongguan City, Guangdong Province, China. Mehr et al. [18] conducted a comprehensive evaluation of heavy metal health risks in urban areas of Isfahan province, Iran, by calculating the average daily intake (ADD) and lifetime average potential daily dose (LADD) of heavy metals by different routes.
China is at the forefront of the world, and many agricultural cities are gradually putting industrialization on the agenda, one of which is Xuancheng City in Anhui Province, the study area of this paper. Xuancheng City is not only the center of the Yangtze River Delta but also an important part of the Anhui River Economic Zone. In recent years, the industrial development of the region has been very rapid; the pollution caused by the soil should not be underestimated, but through the relevant survey, it was found that many scholars of the region’s research focus on agricultural economic development and air pollution problems [19, 20], while previous studies have paid less attention to heavy metals in the soil of the research area, which is not conducive to the protection of the region’s natural environment and the health of the residents.
Based on this, this article intends to take the surface soil heavy metals in Xuancheng City, Anhui Province, China, as the research object and conduct a systematic study on the characteristics, distribution, pollution level, and health risks of soil heavy metal content by measuring typical heavy metal content, including As, Cd, Cr, Cu, Hg, Ni, Pb, and Zn. The specific goals of this study were: 1) to screen for the optimal control pollutants of heavy metals in the soil of the study area through content analysis and standard comparison;
2) to understand the high-value areas of heavy metals through spatial distribution and analyze the possible reasons; 3) to analyze the pollution level of heavy metals measured; 4) to assess the health risks of heavy metals measured to adults and children. The present research helps to comprehensively reveal the level of heavy metal pollution in the soil of the study area, clarify the optimal types of pollutants to be controlled, and identify important target areas for pollution prevention and control. It is of great significance for the prevention and control of heavy metal pollution in the soil of the study area and environmental management.
Materials and Methods
Study Area
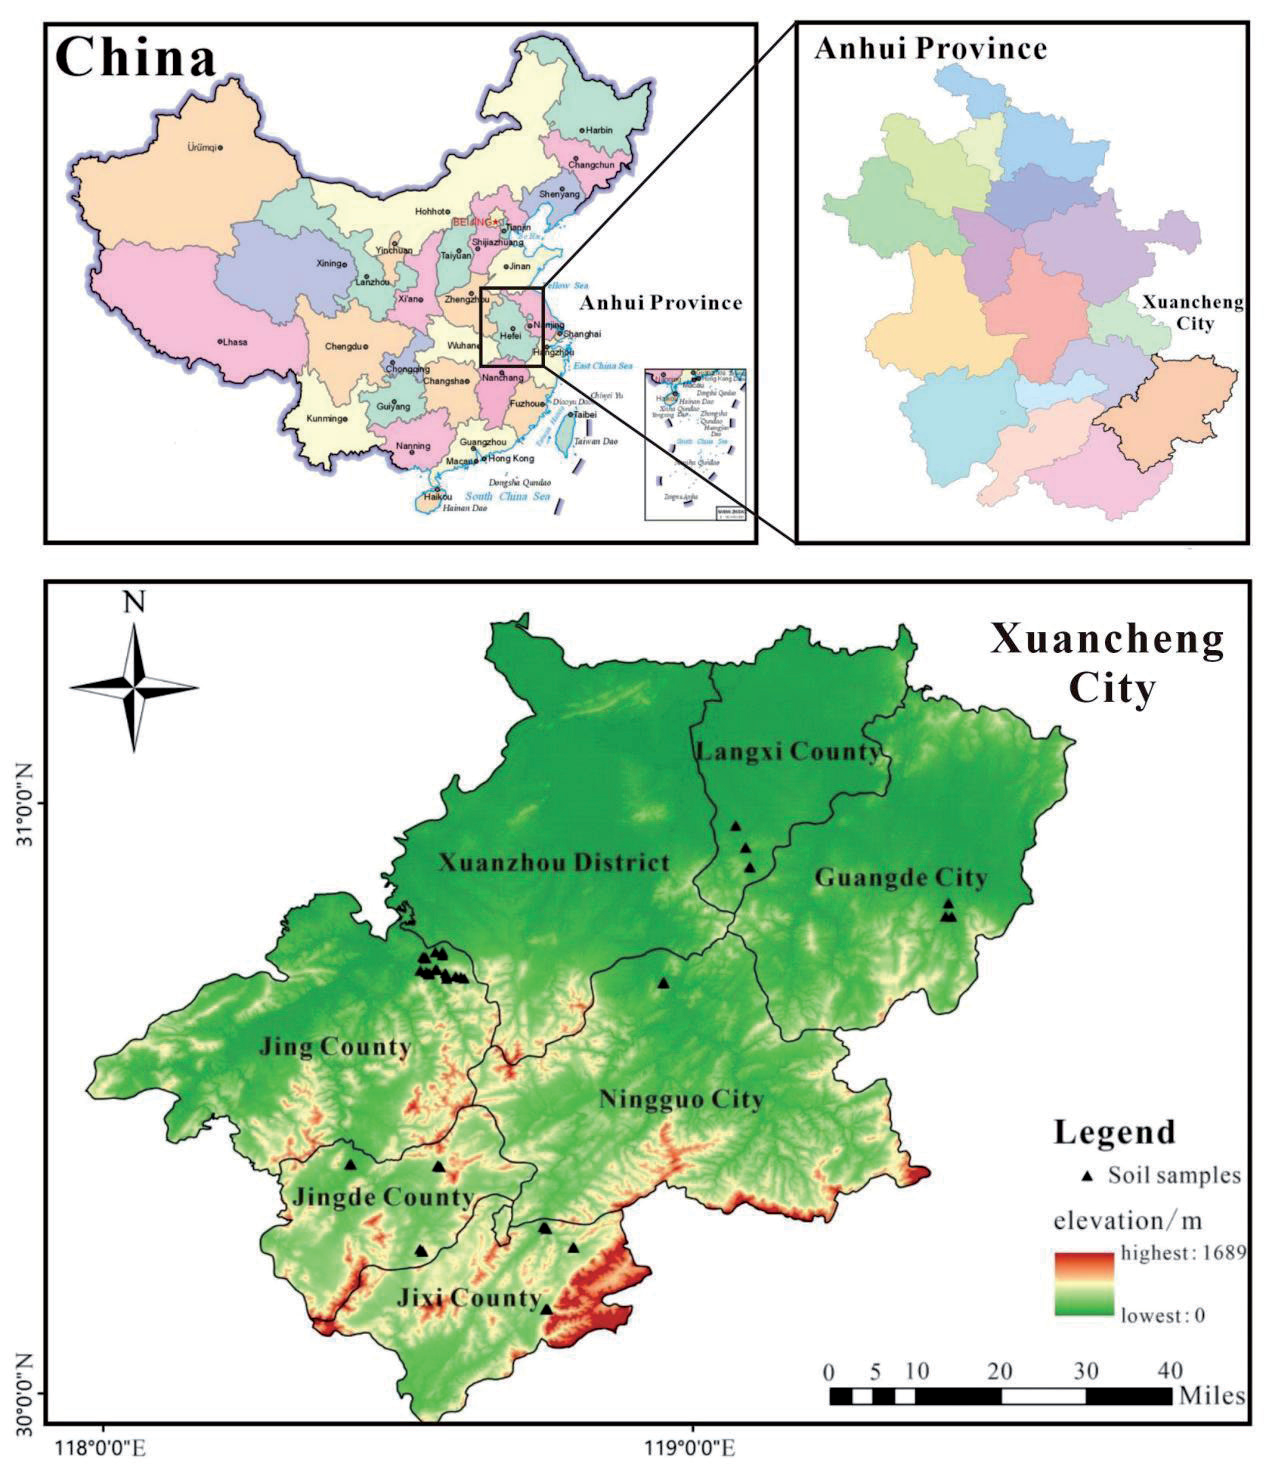
Xuancheng City is located in the southeast of Anhui Province (117°58′ ~ 119°40′ E, 29°57′ ~ 31°19′ N). The city covers a total area of 12,340 square kilometers and has a resident population of approximately 2,495,000 people. It is located in a combination of mountainous areas in southern Anhui Province and the plains along the river, with many low hills that belong to the subtropical monsoon climate. The terrain is high in the southeast and low in the northwest. The average annual temperature is 15.6℃, and the annual precipitation is between 1,200 and 1,500 millimeters. Rainfall is concentrated from May to October every year, creating a variety of landforms and a developed agriculture industry. Meanwhile, Xuancheng City is the only provincial ecological city in Anhui Province with rich tourism resources. The location of the study area and the distribution of sampling sites are depicted in Fig. 1.
Sampling and Analysis
According to the Technical Specification for Soil Environmental Monitoring (HJ/T 166-2004) and Soil Testing Part 1: Soil Sampling, Processing, and Reposition (NY/T 1121.1-2006), sixty-eight soil (0- 20 cm) samples were randomly collected from the periphery of agricultural fields within six counties of Xuancheng City in August 2022 (Fig. 1). The collected soil samples were first subjected to pre-treatment such as air drying, crushing, shrinkage, and sieving. Then, after wet digestion, the content of heavy metals was measured. Mercury and As were determined by atomic fluorescence spectrometry (AFS-8220, Beijing Jitian), while Cu, Zn, Ni, Cr, Cd, and Pb were measured by atomic absorption spectrophotometry (AA-6300C, Shimadzu). The specific standards for the digestion and determination processes of the selected heavy metals are detailed in Table 1.
Research Methods
Evaluation Methods for Soil Heavy Metal Pollution
In this study, the geo-accumulation index (Igeo) was chosen for evaluating heavy metal pollution in soil, which was first proposed by the German scientist Müller [21] in 1969. It takes into account the influence of the geological background of the natural soil formation process as well as the influence of anthropogenic activities on the pollution of heavy metals. It is commonly used to reflect the degree of heavy metal enrichment [22], and it is also used as the quantitative index for studying the degree of heavy metal contamination of sediments and other media [23]. The formula is:
Where Cn represents the measured value of soil heavy metal n (mg·kg-1); K is the background matrix correction factor (K = 1.5), introduced to take care of possible variations of the background values that are due to lithologic variations [24]. Bn represents the element’s geo-chemical background value, using the background value of the soil in the Wanjiang Economic Zone (see Table 2) [25]. The grading criteria based on the geoaccumulation index are shown in Table 3.
Health Risk Assessment Methods for Heavy Metals in Soil
As, Cd, Cr, Cu, Hg, Ni, Pb, and Zn all pose chronic non-carcinogenic health risks, with As, Cd, Cr, and Ni also posing carcinogenic risks. As, Cd, Cr, Cu, Hg, Ni, Pb, and Zn all pose chronic non-carcinogenic health risks, with As, Cd, Cr, and Ni also posing carcinogenic risks. These heavy metals in soil can enter the human body through three exposure pathways: hand-oral ingestion, dermal contact, and inhalation, and the average daily exposure to carcinogenic (adults) and non-carcinogenic (adults and children) heavy metals from the three exposure pathways was calculated using the following equations (2) - (4). Lifetime average daily exposures for different routes of exposure to carcinogenic heavy metals in children were calculated according to the following formulas (5) - (7) [26]:
Table 1.
Test methods of heavy metals in soil samples.
Table 2.
Background values of soil elements in the Anhui River economic zone (mg·kg-1).
| Metals | As | Cd | Cr | Cu | Hg | Ni | Pb | Zn |
|---|---|---|---|---|---|---|---|---|
| Background | 8.81 | 0.157 | 64.7 | 24.9 | 0.059 | 25.7 | 28.1 | 71.1 |
Table 3.
Where ADDing, ADDinh, and ADDderm are the average daily exposure to heavy metals by ingestion, inhalation, and dermal contact routes, mg·(kg·d)-1, respectively; c is the heavy metal content of the soil, mg·kg-1; IngR is the frequency of ingestion into the soil, mg·d-1; InhR is the respiration frequency, m3·d-1; CF is the conversion factor, kg·mg-1; EF is the exposure frequency, d·a-1; ED is the exposure duration, a; BW is the average body weight, kg; AT is the average exposure time to heavy metals, d; PEF is the dust emission factor, m3·kg-1; SA is the surface area of exposed skin, cm2; SL is the skin adhesion, mg·(cm2·d)-1; ABS is the dermal absorption factor, dimensionless. LADDing, LADDinh, and LADDderm are the lifetime average daily values of heavy metals based on the life cycle of the human body for the exposure pathways of ingestion, inhalation, and dermal exposure, mg·(kg·d)-1, respectively; InhRchild and InhRadult are the respiratory rates of children and adults, m3·d-1, respectively; EDchild and EDadult are the number of years of exposure, a, for children and adults, respectively; BWchild and BWadult are the average body weights, kg, for children and adults, respectively.
Referring to China’s site environmental evaluation guidelines (DB 11/T 656-2009) and relevant research results at home and abroad, the parameter values in the above equations were obtained. In the exposure calculation, different values of AT were taken for carcinogenic and non-carcinogenic heavy metals. When calculating the exposure to non-carcinogenic heavy metals, the average ED values of adults and children were set to 24 and 6 a, so their AT values were 8760 (24×365) and 2190 (6×365) d, respectively. On the other hand, the average ED value for adults was set at 24 for calculating the exposure to carcinogenic heavy metals. The average ED values for children and adults were first weighted and averaged. The maximum average ED value was calculated at 30 a, including 6 and 24 a for children and adults, respectively, and then the exposure was equally distributed over the entire life span (70 a). The average AT of adults and children to carcinogenic heavy metals was estimated at 70×365 d. The values of various parameters are shown in Table 4. Based on the heavy metal quantities and exposure pathways in this study, the health risk characterization model for non-carcinogenic and carcinogenic heavy metals in soil heavy metals is as follows [26]:
Where HQi is the individual health risk index of non-carcinogenic heavy metal (i); ADDij is the average daily exposure of the jth exposure pathway of non-carcinogenic heavy metal (i), mg·(kg·d)-1; RfDij is the reference dose of the jth exposure pathway of non-carcinogenic heavy metal (i), mg·(kg·d)-1; HI is the total non-carcinogenic risk index of the eight heavy metals through three exposure pathways; CRi is the individual health risk index of carcinogenic heavy metal (i); SFij is the slope factor of the jth exposure pathway of carcinogenic heavy metal (i), (kg·d)·mg-1; and TCR is the total carcinogenicity risk index of As, Cd, etc. through three exposure pathways. Referring to the environmental evaluation guidelines for sites in China (DB 11/T 656-2009) and relevant research results at home and abroad, the RfD and SF of various exposure pathways are shown in Table 5. When HQi or HI<1, it indicates a negligible non-carcinogenic health risk, and when it is >1, it indicates the presence of a non-carcinogenic health risk [27]; US EPA’s recommended soil management standard for CR and TCR is 10-6 [28], see Table 6.
Data Treatment
The processing and analysis of the experimental data (soil heavy metal content statistics) were completed by Excel 2016 and IBM SPSS Statistics 27 software; the distribution map of the sampling points and the spatial distribution map of the heavy metal-related calculation indexes were mainly completed by ArcGIS 10.8 and Surfer 15, and the contour maps of the heavy metal health risk elements and the contribution rate maps were prepared by Origin 2021 and CorelDRAW 2019.
Results and Discussion
Heavy Metal Concentrations
The results of descriptive statistics of heavy metal contents in soils in the study area are presented in Table 7. The soil pH ranged from 4.90 to 8.74, with a mean value of 6.84. The mean contents of As, Cd, Cr, Cu, Hg, Ni, Pb, and Zn in the soils of the study area were 7.41, 0.15, 63.51, 19.90, 0.19, 14.07, 49.35, and 65.12 mg·kg-1. The average contents of Zn>Cr>Pb >Cu>Ni>As>Hg>Cd were in descending order. Compared with the background values, the average contents of Hg and Pb in the soils in the study area exceeded the corresponding background values, which were 3.25 and 1.76 times, respectively. However, the average contents of other elements did not exceed the corresponding background values, and the average contents of Cd and Cr were extremely close to the relevant background values. In addition, the number of sample sites with Cd, Cr, and Pb contents exceeding the background values was relatively high, with 17 (25.0%), 16 (23.5%), and 22 (32.3%), respectively. Although the average content of the measured elements in the samples was lower than the corresponding risk screening values and risk control values compared to the “Soil Environmental Quality and Soil Pollution Risk Control Standards for Agricultural Land” (GB 15618-2018, in China.), based on the above results, it can be concluded that the content of heavy metals Cd, Cr, and Pb in the soil in the study area is relatively high, which is similar to the conclusion of Xing et al. [29] that the surface soil in the southern part of Xuancheng City has a high degree of enrichment of Cd and Pb elements.
Table 4.
Basic parameters of heavy metal exposure.
Table 5.
RfD and SF of different exposure pathways of soil heavy metals.
Table 6.
Health risk criteria.
The coefficient of variation (CV) reflects the average degree of variation of soil heavy metal elements at each sampling point in the overall sample and is mainly used to evaluate the magnitude of the external influence of a certain element [30]. Generally, CV<0.2 is considered a weak variation, 0.2≤CV<0.5 is a moderately strong variation, 0.5≤CV<1.0 is a strong variation, and CV≥1.0 is an abnormally strong variation. The results showed that the average degree of variation of soil heavy metals in the study area was Hg>Ni>Cr>Zn>Cu>Cd> Pb>As, and the coefficients of variation of all elements in the study area exceeded 0.5, which reached the degree of strong variation, and the CV of Hg reached 1.05, which was abnormally strong. This means that all the studied elements in the region have strong intensity variations with spatial heterogeneity. Therefore, it can be preliminarily judged that the eight elements contained in the soils of the study area may have been polluted by point sources and significantly affected by local pollution sources and anthropogenic disturbances, among which Hg was most seriously affected.
Table 7.
Descriptive statistics of heavy metal content in soil (mg·kg-1).
Spatial Distributions
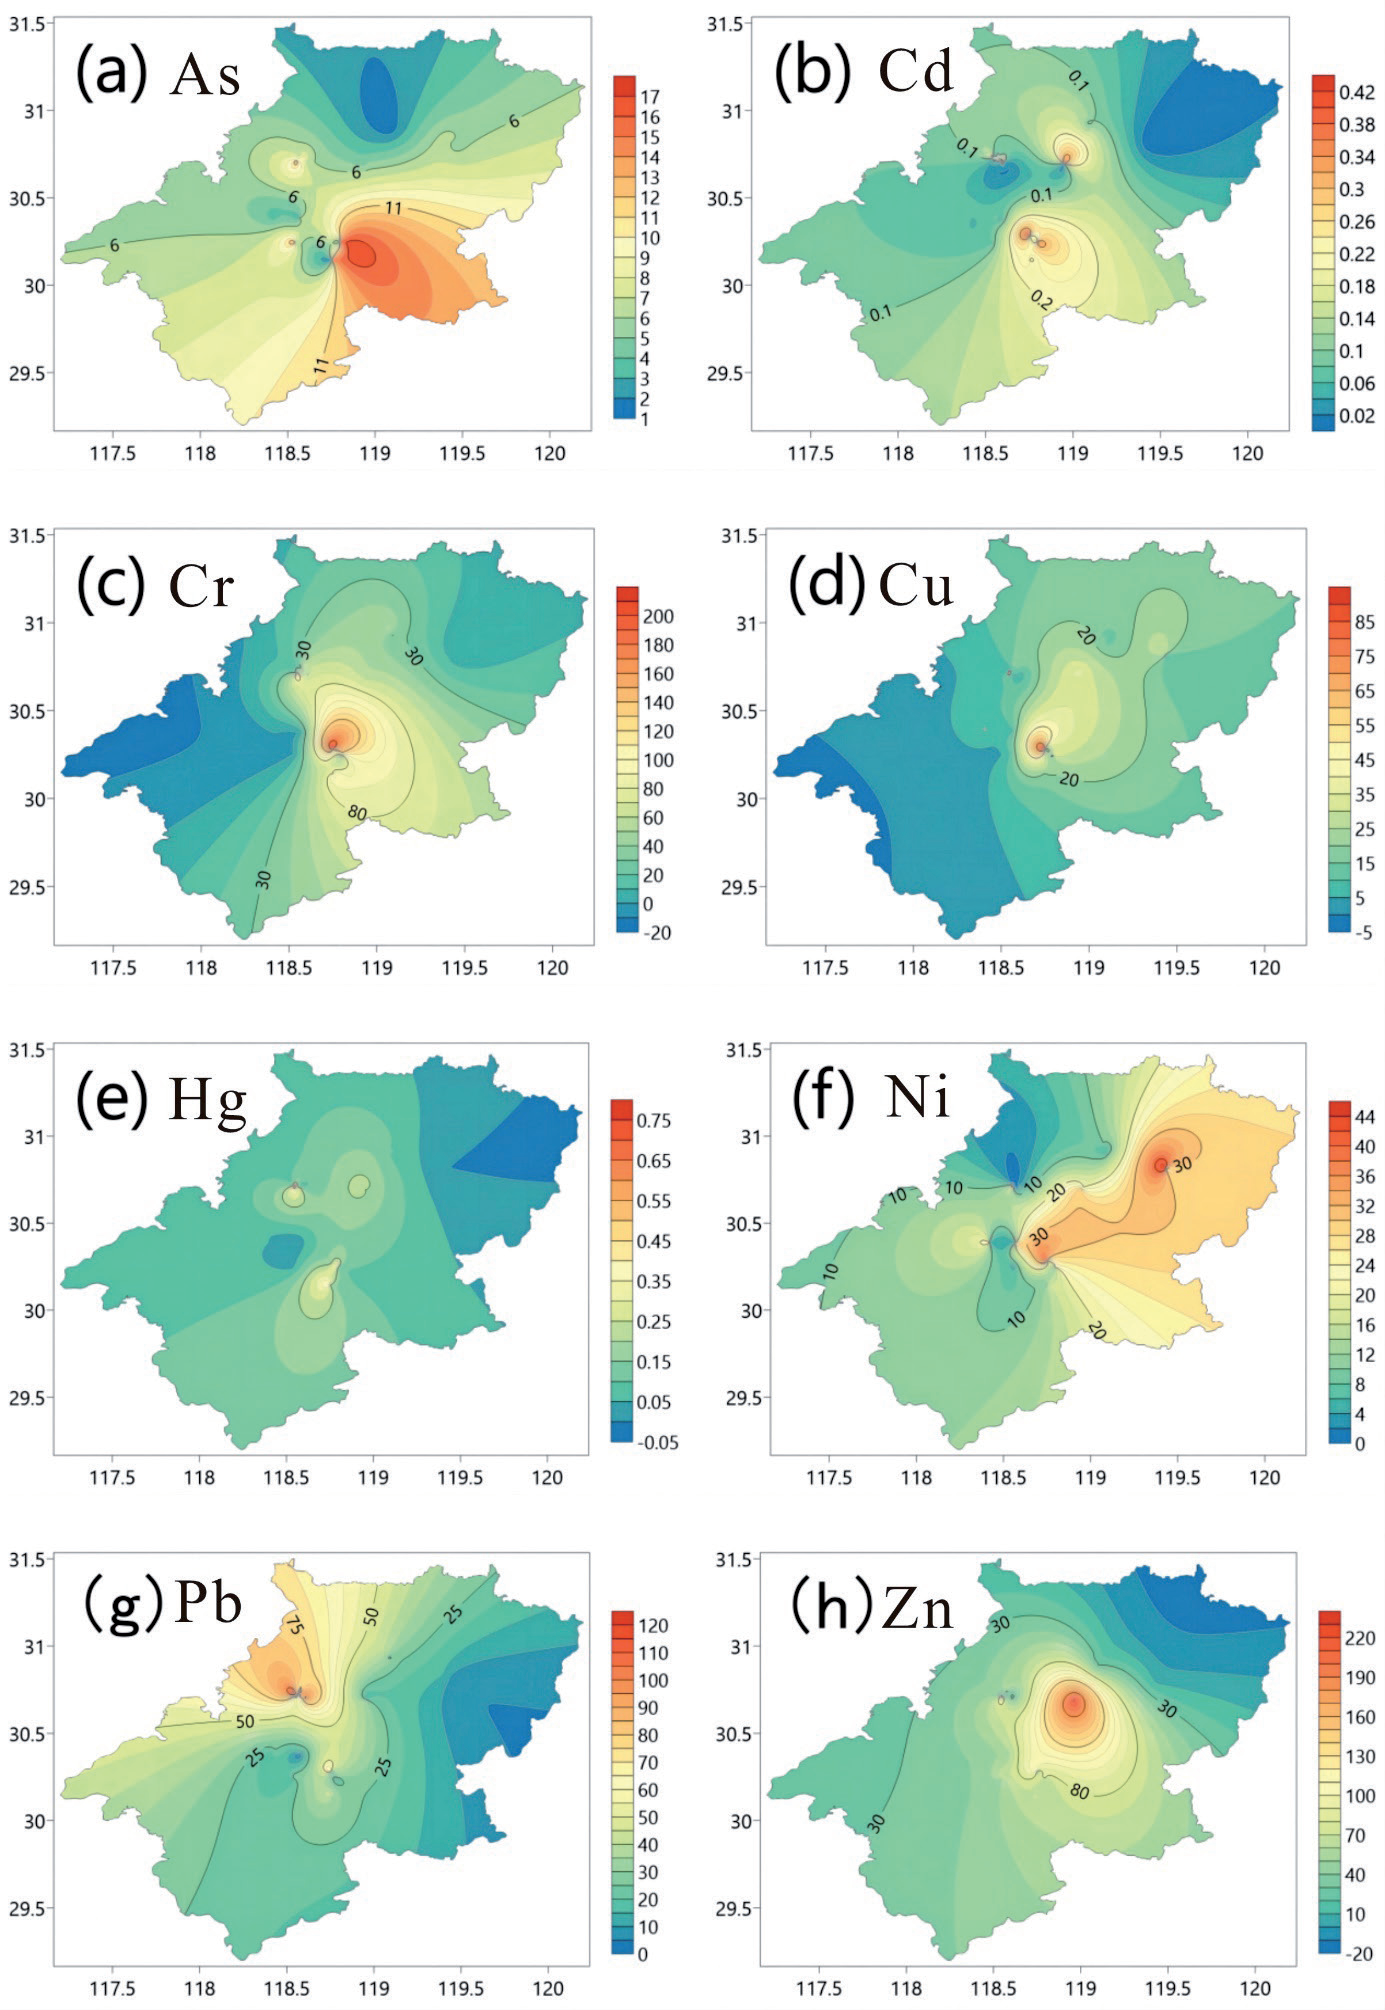
In this paper, based on the specific information from the geographic coordinates of the sampling points in the study area, Surfer 15 software was used to analyze the spatial distribution of soil heavy metals, and Kriging interpolation was selected to obtain the results (see Fig. 2). Compared with other elements, the high-value areas of As (Fig. 2a), Ni (Fig. 2f), and Zn (Fig. 2h) in the soils of the study area were characterized by more obvious block or band distribution, which were mainly concentrated in the southeastern and northwestern regions of the study area. Meanwhile, the spatial distribution of Cd (Fig. 2b), Cr (Fig. 2c), Cu (Fig. 2d), Hg (Fig. 2e), and Pb (Fig. 2g) has similar elemental content, and the point-like distribution of high-value zones is obvious, mainly concentrated in the center of the study area. High changes are found in the central part of the study area, whereas low changes are found around the central part of the study area. The study area is an agricultural planting area with obvious human activities. CV analysis results further show that the CV of all elements in the study area is greater than 0.5. This is a strong variation, indicating that the changes in soil heavy metal content in the study area are obviously affected by human activities.
Evaluating Soil Pollution
According to the geo-accumulation index formula, the geo-accumulation index of eight heavy metals was calculated (Table 8). The mean values of Igeo in the study area were in descending order: Hg Pb>Zn>As>Cd >Cu>Cr>Ni. Hg was the most polluted, and most of the sampling sites (63.2%) had soil heavy metal contamination between no or mild contamination, whereas Cr, Cu, Hg, Pb, and Zn had a certain proportion of moderate contamination. The proportions of Cr, Cu, Hg, Pb, and Zn were biased towards moderately polluted (1.5%, 1.5%, 23.5%, 22.1%, and 4.4%, respectively), and 8.8% and 4.4% of the soil sites were moderately polluted, while biased towards heavily polluted, respectively, which indicated that the Hg contamination in the study area was relatively serious. This is consistent with the results of “content characterization” in the previous text and similar to the results of the study by Xing et al. [29].
Assessing Soil Health Risks
Assessing Adult Health Risks
The single non-carcinogenic health risk index (HQ), total non-carcinogenic health risk index (HI), single carcinogenic health risk index (CR), and total carcinogenic health risk index (TCR) of heavy metals for adults via ingestion, inhalation, and dermal routes of exposure can be calculated according to Eqs. (2)~(4) and (8)~(11). As shown in Table 9, the HQ and HI of the eight heavy metals contained in the soils of the study area were less than 1 for adults, indicating no non-carcinogenic health risk for soil heavy metals for adults in the area. However, the CR and TCR of soil As in the study area exceeded the soil management standards recommended by the US EPA (10-6), so the carcinogenic risk to adults in this area has reached a high level. In Zhang et al.’s [31] study, the average carcinogenic risk of soil As in their study area (a coal chemical plant in Ningxia, China) was found to have exceeded the acceptable limits of carcinogenic risk, which is consistent with the situation in the present study area. From Fig. 3, it can be seen that the contamination points of soil heavy metals for HI and TCR in adults in the study area are the same.
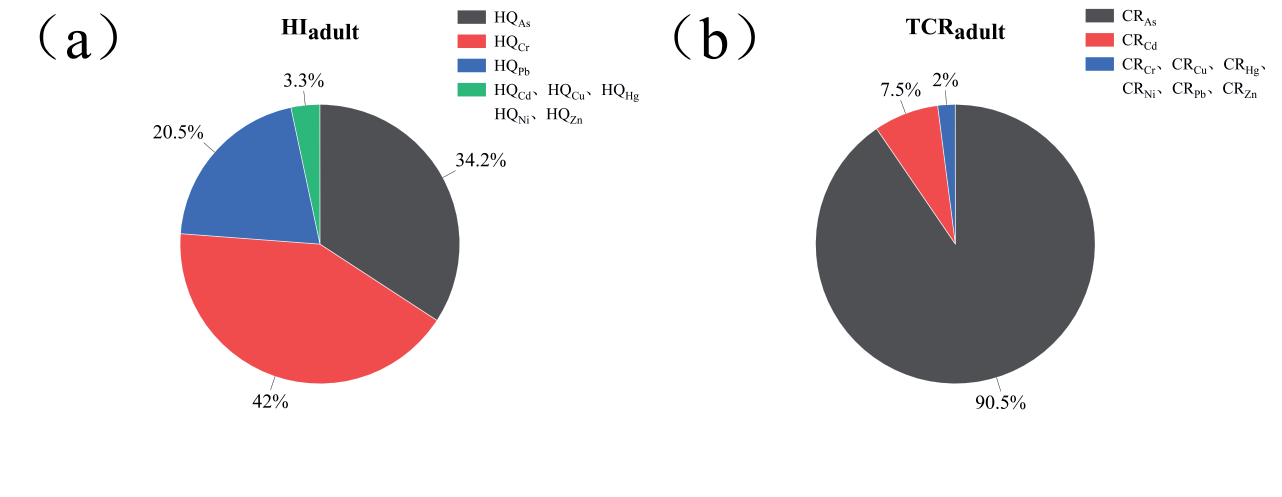
The total adult non-carcinogenic risk (HI), HQAs, HQCr, and HQPb in the study area contributed 34.2%, 42.0%, and 20.5%, respectively, and their sum was more than 90%, which were the three largest contributors to non-carcinogenic risk in the study area. For the total cancer risk (TCR) of adults, the contribution rates of CRAs and CRCd in the study area were 90.5% and 7.5%, respectively, and their sum also exceeded 90%, which were the two largest contributors to the cancer risk in the study area, as shown in Fig. 4.
Assessing Child Health Risks
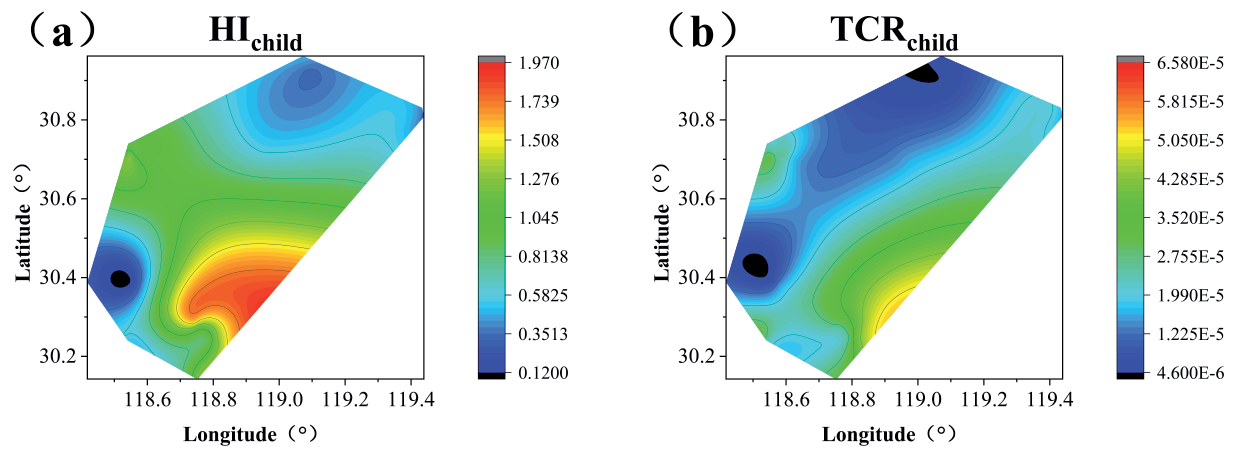
According to Eqs. (2)~(11), the single non-carcinogenic health risk index (HQ), the total non-carcinogenic health risk index (HI), the single carcinogenic health risk index (CR), and the total carcinogenic health risk index (TCR) of the heavy metals for children via the routes of ingestion, inhalation, and dermal exposure can be calculated. As can be seen from Table 10, the HQ and HI of the eight heavy metals in the study area for children are also less than 1, so there is no non-carcinogenic health risk for children, but the value of HI has been very close to the relevant standards, so the non-carcinogenic health risk for children in this area still needs to be concerned. Meanwhile, the CR and TCR of As and Cd in the soil in the study area also exceeded the soil management standards recommended by the US EPA, and the carcinogenic risk to children reached a high level. From Fig. 5, it can be seen that the contamination points of HI and TCR of heavy metals in soil for children in the study area are also the same. Meanwhile, by comparing the data in Tables 9~10, it can be seen that children are more likely to have non-carcinogenic and carcinogenic health risks compared with adults. The HI of children is 6.23 times higher than that of adults, and the TCR is 2.73 times higher than that of adults. This is in line with Yang et al.’s [32] study that children were more vulnerable to heavy metal pollution than adults.
Table 8.
Calculation results of soil heavy metal geo-accumulation index (mg·kg-1).
Table 9.
Non-carcinogenic and carcinogenic risk indices of soil heavy metals for adults.
| Metals | As | Cd | Cr | Cu | Hg | Ni | Pb | Zn |
|---|---|---|---|---|---|---|---|---|
| HQ | 4.69E-02 | 5.32E-04 | 5.76E-02 | 9.19E-04 | 1.33E-03 | 1.37E-03 | 2.81E-02 | 4.27E-04 |
| HI | 1.37E-01 | |||||||
| CR | 7.24E-06 | 6.00E-07 | 1.61E-07 | - | - | 7.16E-10 | - | - |
| TCR | 8.00E-06 |
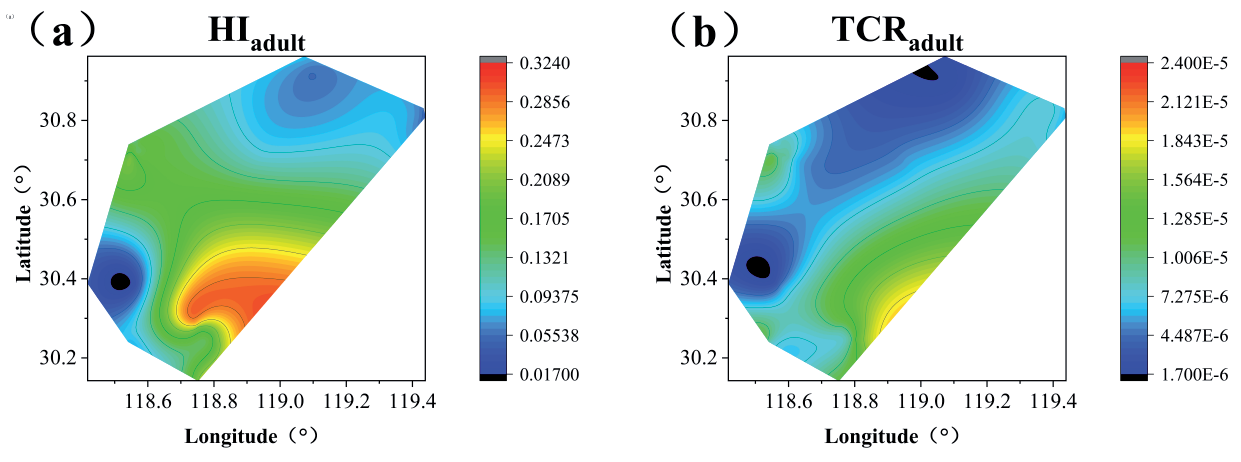
Fig. 4.
HQ contribution to total non-carcinogenic risk in adults a) CR contribution to total carcinogenic risk b).
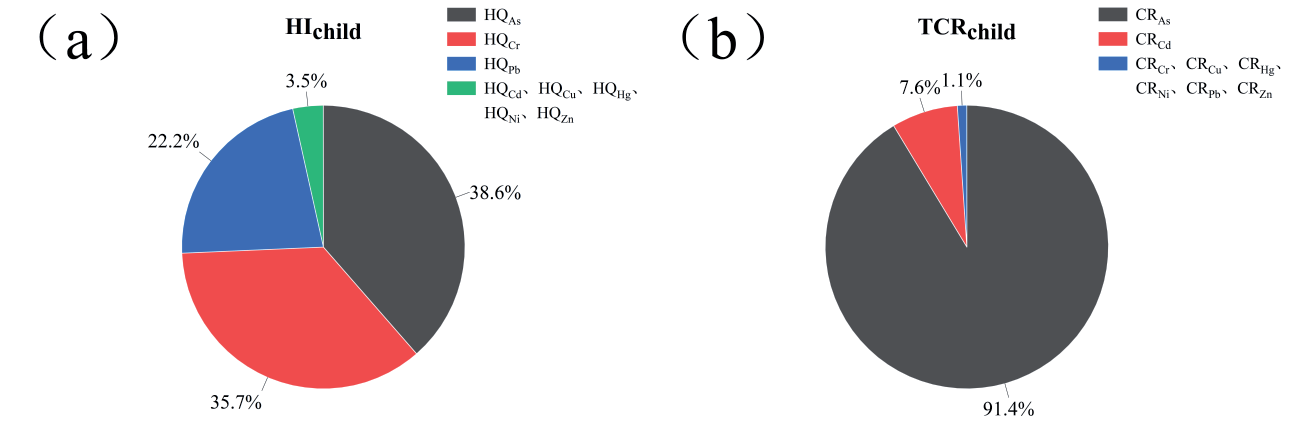
The total pediatric non-carcinogenic risk (HI), HQAs, HQCr, and HQPb contributed 38.6%, 35.7%, and 22.2%, respectively, with the same sum being greater than 90%, and were the three largest contributors to non-carcinogenic risk in the study area. The total childhood cancer risk (TCR), CRAs, and CRCd contributed 91.4% and 7.6%, respectively, with a sum of more than 90%, and were the two largest contributors to cancer risk in the study area, as shown in Fig. 6.
Conclusions
Based on the analysis of the concentrations of eight kinds of heavy metals in the surface soil in Xuancheng City, Anhui Province, China, we reached the following conclusions:
(1) The average contents of Hg and Pb were 3.25 and 1.76 times higher than their background value, respectively. The average contents of the other elements did not exceed the corresponding background values, but the average contents of Cd and Cr were extremely close to the relevant background values. The number of samples with Cd, Cr, and Pb contents exceeding background values was relatively high at 17 (25.0%), 16 (23.5%), and 22 (32.3%), respectively.
(2) The coefficients of variation of all elements in the study area exceeded 0.5, which reached a strong degree of variation, and the coefficient of variation of Hg even reached 1.05, which is an unusually strong variation, which means that all the elements studied in this area have spatially heterogeneous and strong intensity variations.
(3) In the study area, the average Igeo values ranked as Hg>Pb>Zn>As>Cd>Cu>Cr>Ni. Hg showed the highest contamination level, with 63.2% of sampling points experiencing no to mild contamination. Cr, Cu, Hg, Pb, and Zn had varying proportions of partial to moderate pollution (1.5%, 1.5%, 23.5%, 22.1%, and 4.4%, respectively). Additionally, 8.8% and 4.4% of Hg soil sites fell into the medium and heavy pollution levels, respectively.
(4) The eight heavy metals in the study area’s soil posed no non-carcinogenic risk to adults or children. However, children’s HQ and HI values for these metals were higher than adults’, with children’s HI being 6.23 times that of adults. As, Cr, and Pb were the main contributors to non-carcinogenic risk. All soils in the area had carcinogenic risk, with children facing higher CR and TCR for As, Cr, Cd, and Ni than adults. Children’s TCR was 2.73 times higher than adults’, and As and Cd were the primary carcinogenic risk factors.

