

Introduction
The ecosystem’s primary component, water is a significant natural source and a priceless national origin. Rivers, lakes, glaciers, groundwater, and rainfall are some of the most common water sources. Water resources are essential for many economic sectors, including agriculture, forestry, industrial processes, the production of hydroelectric power, fisheries, and other creative endeavors, in addition to providing drinking water [1]. Air pollution comes from undesirable air matter that can harm human, animal, and plant health. Factories, electric generators, and trains are the main sources of air contaminants. Some of these pollutants may interact with other elements in the atmosphere, affecting the air quality. Approximately one-third of greenhouse gas emissions are caused by traffic. The biggest contributor to climate change are greenhouse gases in the atmosphere [2]. Agriculture emits contaminants like methane (CH4) and dioxide nitrous (NO2) and is deemed as greenhouse gases too.
Industrial processes also produce and emit numerous additional chemical wastes, including methane, ammonia, carbon dioxide, nitrogen dioxide, and tiny dust particles [2]. Rain is an important resource of fresh water on Earth, supplied by the long water cycle; nevertheless, it can also be a resource of natural catastrophes, like urban floods [3]. Rainfall is one of the Vitality climatic agents that can indicate a change in the climate. Temporal and spatial agents of rainfall would impact soil moisture, runoff, and groundwater reserves. The analysis of rainfall directions is important in studying the impacts of climate variations on water source management and planning [4]. In both the gaseous and particle phases, rainwater is a significant tool for removing pollutants from the atmosphere. Rain’s makeup provides insight into how the atmosphere it falls from was formed [5]. Wet precipitation is the main purification technique for eliminating pollutants from the air, separating more than 90% of the total amount of contaminants found in the atmosphere. Therefore, precipitation has the potential to reduce the amount of pollutants in the atmosphere and pollute soil, water, and terrestrial plants [6, 7]. Air composition contaminants may occur in various ways like through anthropogenic activities. The weather parameter plays an important role in the formation or elimination of air contaminants, such as, wind can transport contaminants from one area to another, and rain transports contaminants from the earth’s atmosphere to the water and soil [2]. Arsenic, cadmium, lead, chromium, nickel, and mercury are examples of trace heavy metals that are significant environmental contaminants, especially in regions with high in anthropogenic pressure. Copper, manganese, iron, and zinc are other significant trace micronutrients in addition to these metals. The widespread bioavailability of these heavy metals can result in bioaccumulation in the food chain, which is particularly risky to human health. The presence of trace heavy metals in the atmosphere, soil, and water can pose major issues for all organisms. The drinking water quality, ecological environment, and food chain are all impacted by the contaminations described. In addition, the toxicity brought on by tainted water, soil, and produce poses a major hazard to human health [8].
This study’s goal is to assess the chemical factors of rainwater in some sites around the oil refinery region within Erbil province. The current study makes use of the WQI, IWQI, and HPI to assess the quality of rainwater for irrigation and drinking, as well as the effects of dynamic weather on contaminants and to identify the source, whether domestic or from a nearby region of our country.
Materials and Methods
Describing the Study Area
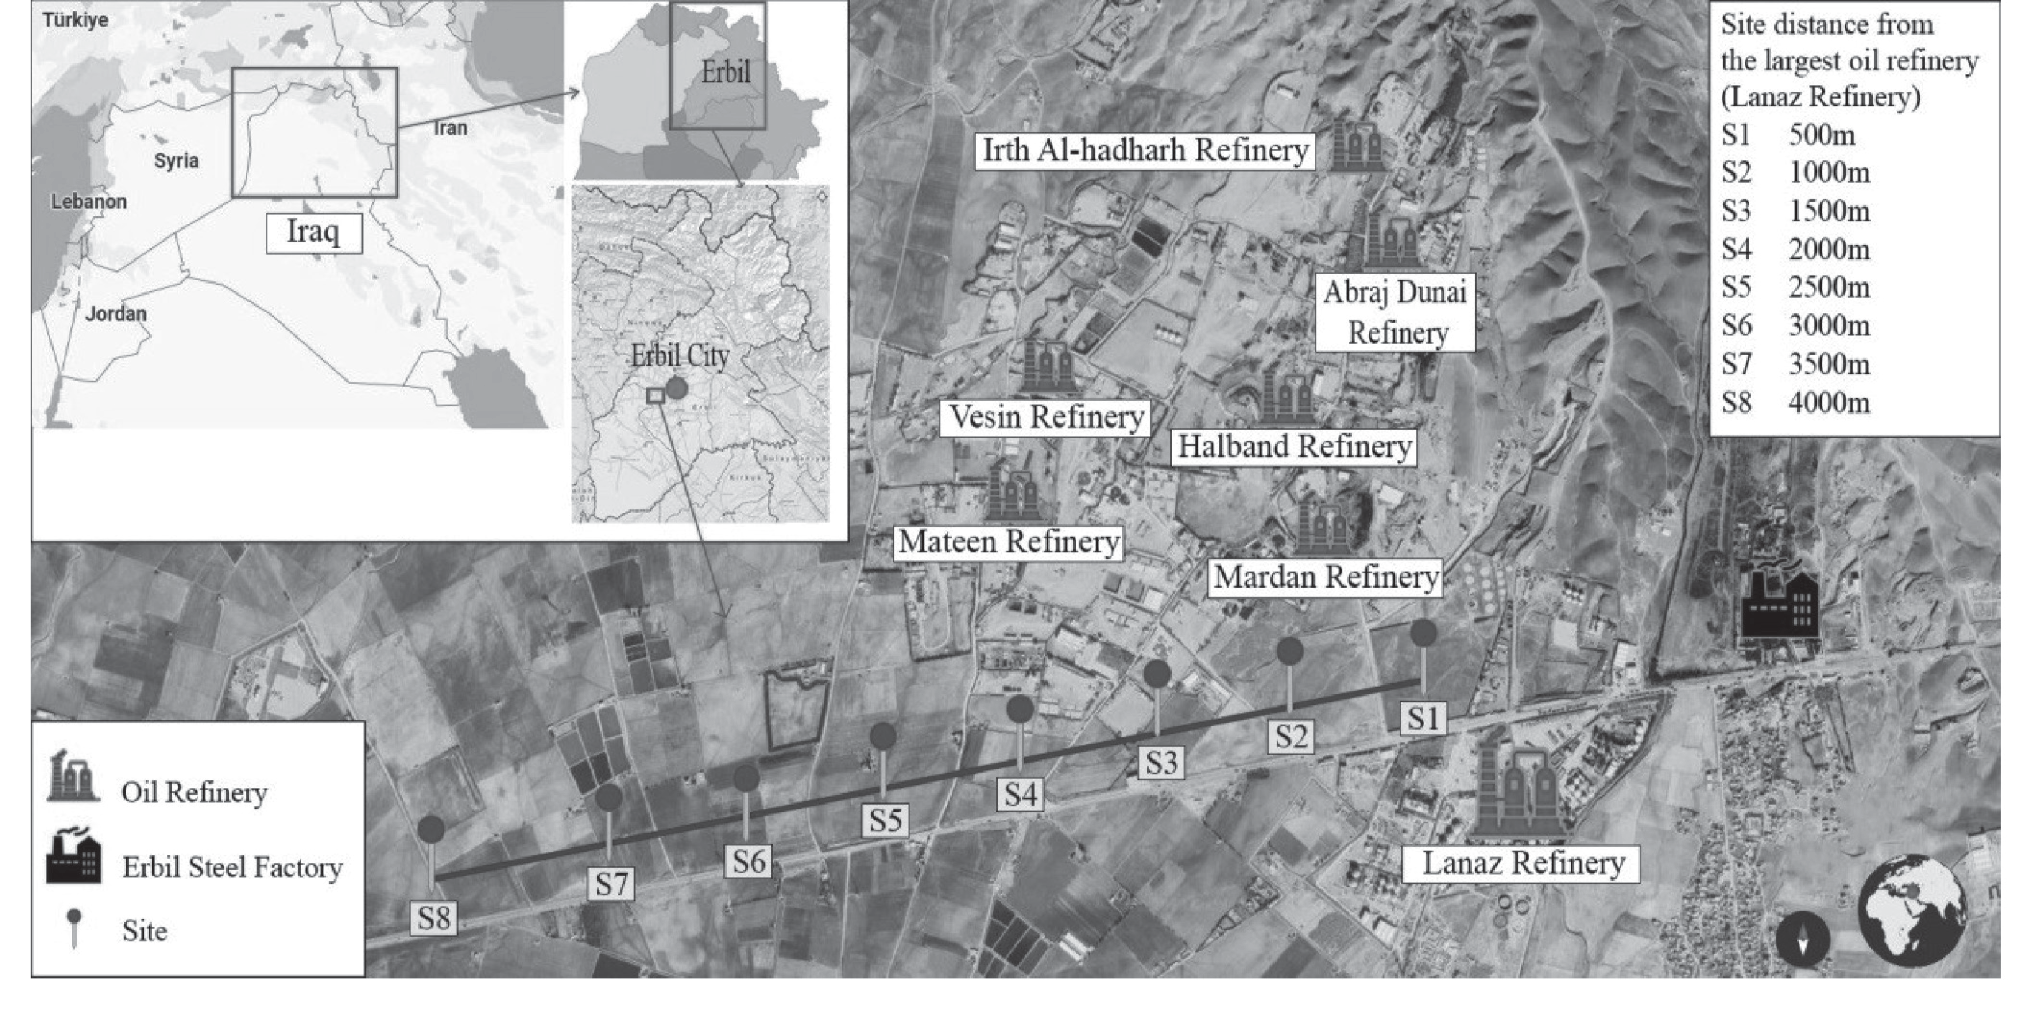
Erbil is situated 414 meters above sea level, at longitude 43o15 East and latitude 35o11 North, in the Kurdistan region of Iraq. Winters in Erbil are cold, springs are mild, and summers are scorching, similar to the Irano-Turanian type of semi-arid zones [9]. The oil refinery was located near Lajan and Turjan village on the main Erbil-Gwer road, 22 kilometers to the southwest of Erbil at a high 347 meters over sea level [10], Fig. 1.
Collection of Samples
During the first wave of rain on 21/10/ 2022, the specimen of rainwater in eight sites (site 1, 500 m, site 2, 1000 m, site 3, 1500 m, site 4, 2000 m, site 5, 2500 m, site 6, 3000 m, site 7, 3500 m and site 8, 4000 m distance away from the oil refinery) were collected in the study and put in clean plastic containers. Each container was attached to a stand that is 100-200 cm high above the ground, the collected rainwater was then stored in polyethylene bags. Rainwater sample analysis was performed after the samples were collected and stored in the refrigerator at 4ºC. Standard methods were [11] utilized to analyze various physicochemical parameters: Turbidity, pH, electrical conductivity (EC), Total Dissolved Solids (TDS), alkalinity, Total Hardness, Ca+2, Mg+2, Na+1, K+1, SO4-2, Cl-1, NO3-2, and PO4-3, as well as heavy metals: Iron (Fe), Manganese (Mn), Lead (Pb), Cobalt (Co), Arsenic (As), Mercury (Hg), and Cadmium (Cd).
Quality Index for Drinking Water
The aim of the index for water quality calculation is to simplify complex data for the quality of water into information that the general people can utilize. In light of this, the WQI is a very utilized and effective tool that can supply straightforward indicators of water quality and is dependent on some key factors. Information is provided by WQI on a scale from 0 to 100. Fourteen criteria were chosen to develop the water quality index. In the current study, WQI was calculated in three steps. In the first step, a weight (wi) was assigned to each of the fourteen parameters (Turbidity, pH, EC, TDS, Alkalinity, Total Hardness, Ca+2, Mg+2, Na+1, K+1, SO4-2, Cl-1, NO3-2, and PO4-3), based on their proportional weights in the total drinking water quality in Table 1. These parameters were used according to the Guidelines of WHO for drinking-water quality [12]. The maximum weight of five was determined for the nitrate parameter due to its major importance in assessing water quality [13]. As it has little bearing on determining the quality of the water, alkalinity is given a minimal weight of 1. Other factors, such as calcium, pH, EC, and TDS, were weighted between 1 and 5 according to how crucial they were in determining the quality of the water. The second stage involves calculating the relative weight (Wi) using the equations below:
wi and Wi are the weight and relative weight of each variable, consecutively, and n is the count of variables.
The third stage involves assigning a quality rating scale (Qi) for every variable by dividing its concentration in each water sample by its standard following the standards set by [12] and the result is the same multiplied by 100 (Equation 2). Vi = the ideal value which is considered to be 7.0 for pH.
Ci is the concentration of each parameter Si is the standard value of each parameter
Table 1.
Chemical characteristics with their given relative weights and weights in compliance with drinking water standards (WHO, 2004).
Equations (2) and (3) include that Qi = 0 when the polluter is away in the samples of water and Qi = 100 when the value of this parameter is exactly equal to its permissible value. Thus, the more the Qi value, the more polluted the water.
At last, for an account, the WQI, the sub-indicators (SIi) were first accounted each variable, and then utilized to account for the WQI as in the next equations:
where SIi is the sub-indicators of the ith variable, Qi is the rating depending on the concentration of the ith variable, and n is the count of variables. The account WQI values are classified into five kinds “excellent water” to “water, Not suitable for drinking”. The range for WQI for drinking purposes has been scheduled in Table 2 according to [13].
The Index for Irrigation Purposes
A sample (IWQI) is developed by [14] on the observed data depending on the following stages:
Stage 1: The computed variables were considered more closely related to use for irrigation purposes; EC, Na+1, HCO3-1, Cl-1, SAR°. Stage 2: Mentioned in the Table 3. The calculated quality values (quality rating) (Qi) were measured for each factor utilizing Equation (1), depending on the border of tolerance shown in (Table 3), and the results for water quality are explained. Based on the irrigation water quality factors and independence with the standard specified by [15].
Since Xij is the observed value of the parameter, Qimax is the highest value of a quality rating scale (qi) for a class, and Xinf is the value corresponding to the minimum value of the class to which the parameter belongs; Qiamp is the class capacity; Xamp is the capacity of the class to which the parameter belongs. Stage 3: The weight of each variable was determined based on its relative importance in the overall irrigation water quality, as shown in Table 4. Stage 4: The water quality index was estimated as follows:
Restrictions for water use categories are described as shown in Table 5.
Determination of Heavy Metals
Complex substances present in the inland water samples were analyzed monthly. Initially, acid digestion was performed as described by [11]. Filtration was performed after digestion and these samples were then analyzed by an atomic absorption spectrophotometer (A 700 Perkin Elmer USA).
Table 3.
Factors limiting values for (Qi) calculation.
Table 2.
Water quality index range for drinking water.
| WQI range Water quality | WQI range Water quality |
|---|---|
| Excellent water | <50 |
| Good water | 50-100 |
| Poor water | 100-200 |
| Very poor water | 200-300 |
| Water unsuitable for drinking purpose | >300 |
Indicators of Heavy Metal Contamination
Heavy metal pollution indices (HPI) are a mechanism for assessing the availability of the combined effect of each heavy metal on all water quality. The rating is a value between 0 and 100 that reflects the significance of individual quality regard. Wi is in reverse fit to the allowed limit value given in the standard. Considerations are inversely proportional to the recommended standard (Si) for each variable [16]. HPI estimation includes the following steps:
1. Estimate the unit weight of each variable.
2. Determine the values of the sub-indicators.
3. Total sub-indicators.
The weight of each variable can be determined using Equation (1):
Where Wi is the unit of weight Si is the permissible value found in the standard for each variable and k is the stability of proportionality. Singles quality rating is given by the expression
Where Qi is the sub-index of the ith variable, Vi is the observation value of the ith parameter and Si is the standard or permissible limit of the ith variable. Then the Heavy Metal Indices (HPI) are determined as follows:
The Critical Pollution Indice (CPI) value is 100. For this study, the Si value has been taken from the guideline for drinking purposes recommended by WHO.
Statistical Analysis
SPSS was used to analyze the data. Results are presented as means of standard deviation. The comparison of the physical and chemical composition parameters between the distances was done using analysis of variance (ANOVA) and Tukey’s test. A p-value equal to or less than 0.05 was considered to be statistically significant.
Results and Discussion
The physical, chemical, and statistical analysis of the rainfall statements appears in Table 6. During the study period, the rainwater sample pH values had a range (of 5.85 to 6.90). pH values are impacted by many variables like biological activity, nature, decomposition of gases such as carbon dioxide, sulfur dioxide, nitrogen dioxide, and molecules during droplet development, amount and time of condensation, exposure time, and levels of environmental pollutants. Thus, low pH values in rainwater are caused by high concentrations of dissolved CO22-, SO42−, NO, and H2S, which are generated by some household or industrial pollutants and may cause acid rain [17]. EC and TDS of rainwater through a period of sampling varied between 397-637 μs/cm and 254.08-408.05 mg/L respectively. These values are almost lower than the standard value (1000 μs/cm and 1000 mg/L) for drinking water as guidelines recommended by the World Health Organization [18].
Turbidity of rainwater varied between (5.2-9.9 NTU), with the lower value calculated in site 8 the furthest location from the contaminated area while the higher values were recorded in site 2 near from contaminated area about 1000 m. The value of turbidity in rainwater is considered higher than recommended by WHO according to drinking purposes [18]. It’s also possible that the overall amount of suspended solids in precipitation is caused by gas flaring, air pollution from other sources, and other factors. Particularly after lengthy droughts, modest rain events also contribute to an increase in turbidity concentration. The sampling sites inside pure urban rainwater points that often have the highest solids concentration are those that are closest to the industrial area [19].
Alkalinity valuables varied from 62 to 126.6 mg CaCO3/L throughout the study, these results are located within the guideline recommended by WHO for potable purposes [18]. The values of hardness, calcium, and magnesium which vary between (225-369 mg CaCO3/L), (31.0-51.1 mg/L) and (38.62-61.20 mg/L) respectively which are considered higher than recommended by WHO guidelines for drinking purposes for both total hardness and magnesium while the concentration of calcium considered suitable for drinking purposes [18], this variance may be attributed to the effects of urban and industrial effluents, incinerator gases, runoff from nearby areas, and human activity [20].
The majority of the potential pollutants are emitted by anthropogenic resources, which might result in a wide variety of compounds being present in the air. The burning of fossil fuels, the use, and production of pesticides and biocides, mining operations, and incorrect handling of industrial effluents set apart these sources of contaminants as the main contributors to the increase in particulate matter levels in the atmosphere [20]. The concentrations of sulfate, chloride, nitrate, and sodium in the samples collected in eight studied sites ranged between (119-189 mg/L), (27.00 to 35.65 mg/L), (17.0 to 22.5 mg/L) and (21.05 to 25.95) respectively. values levels mentioned above in all rainwater sample sites were within the permissible limit for drinking uses depending on [18]. Higher concentrations of potassium 23.4 mg/L and phosphate 5.47 mg/L were observed in sites 2 and 1 while the lower values were calculated in sites 7 and 8 for both phosphate and potassium respectively, these concentrations were located higher than recommended by WHO guidelines for drinking use. There are significant differences observed in physical and chemical characteristics between studied sites.
Table 6.
Some physical properties and chemical composition of the rainfall in the polluted oil refinery region.
The WQI calculation displays the combined effect of specific rainwater parameters on the overall quality of water used for human consumption. For this aim, thirteen rainwater quality parameters were considered, including pH, electrical conductivity, total dissolved solids, turbidity, alkalinity, total hardness, calcium, magnesium, sodium, potassium, sulfate, nitrate, and phosphates. The WQI of rainwater was studied in the Oil Refinery area within Erbil Governorate. This research aims to implement WQI for human use. WQI calculations are available based on the limits previously proposed [18]. The WQI calculated at the study sites is shown in Fig. 2. In the study area, the WQI varies from 128.91 (poor quality) at site 1 to 80.81 (good quality) at site 8, which means a higher value of WQI was observed in the nearest sites to the Oil Refinery area while lower values were recorded in remote sites from refinery area. In this area, WQI appeared that only three sites indicated good quality among the eight sites analyzed while the remaining sites presented poor water quality among the total analyzed samples.
Based on the calculated WQI, 62.5% of sample sites are poor for drinking, and 37.5% of samples are good for drinking. The class of poor water quality is caused by the high values of WQI in turbidity, pH, potassium, and hardness parameters. The inadequate water quality is a consequence of the very high values of the WQI and in all criteria. These high values of WQI reveal that industrial activities in the study area tend to influence rainwater quality [21]. Also may be related to the contamination sources mainly characterized by fossil fuel combustion. The increase in particulate matter in the atmosphere is mostly caused by the usage and production of biocides and pesticides, mining operations, and incorrect handling of industrial effluents [22, 23]. Values of the Irrigation water quality index in the current study varied between 55.104 (medium constriction) in site 4 to 74.066 (low restriction) in site 2 as seen in Fig. 3.
In general, rainwater within Erbil province utilized these sources for irrigation in normal conditions. These fluctuations of IWQI in the studied sites may be due to impacts by anthropogenic activities, air quality, industrial activities, and climate changes [24]. The effects of salt concentration on plants decide whether irrigation water is suitable. Numerous issues came up when using water for irrigation, particularly several factors including salinity, permeability, infiltration trace element toxicity, specific ion toxicity, and dangers owing to other factors sensitive to crops. As a result, water with a high salinity would affect crop growth [25]. [26] showed that the quality of rainwater reflects the combined effects of natural and anthropogenic factors.
Due to the rapid development of petroleum production, oil refineries, steel mills, electric power plants, and an increasing number of automobiles in the area results in an increase in the levels of HMs in the atmosphere. Heavy metals concentration in studied sites is shown in Table 7. Concentrations of heavy metals approximately did not change or only very low fluctuated from site 1 to 4 which means remained stable in site 5 stated the concentrations to reduced till site 8. Iron concentrations in this study varied from 0.181 to 0.116 mg/L where the higher values were recorded in site 1 nearest to the oil refinery while the lowest value was calculated in site 8 which is remote from the oil refinery. Iron in drinking water according to the guideline [18] was 0.3 mg/L, thus, all studied sites were considered safe for drinking purposes depending on iron levels. Concentrations of Magnesium in studied sites were higher than recommended by WHO guidelines for drinking uses, where the higher and lower ones were 4.99 and 0.89 mg/L in site 2 and 8 respectively. This variation in manganese concentration may be due to the effect of anthropogenic activities and gas emissions from cars and factories [27].
Fig. 2.
Water Quality Index (WQI) recorded in the studied sites on 21 October 2022. WQI >300 is considered that the water is unsuitable for drinking purposes. WQI 200-300 (very poor water), WQI 100-200 (poor water), WQI 50-100 (good water), WQI <50 (excellent water).
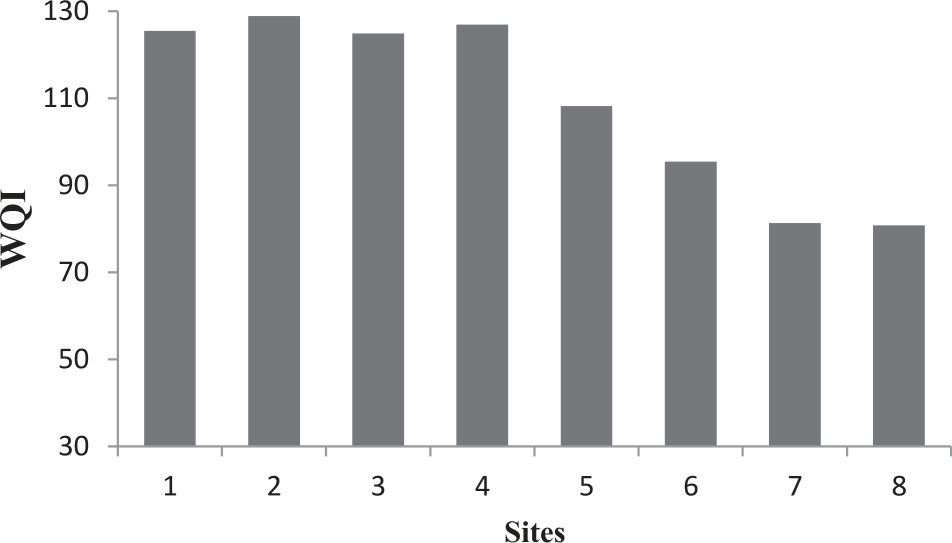
Fig. 3.
Irrigation Water Quality Index (IWQI) recorded in the studied sites on 21 October 2022. IWQI 0-40 is considered severe restriction, IWQI 40-55 (High restriction), IWQI 55-70 (Moderate restriction), IWQI 70-85(Less restriction), IWQI 85- 100 (No restriction).
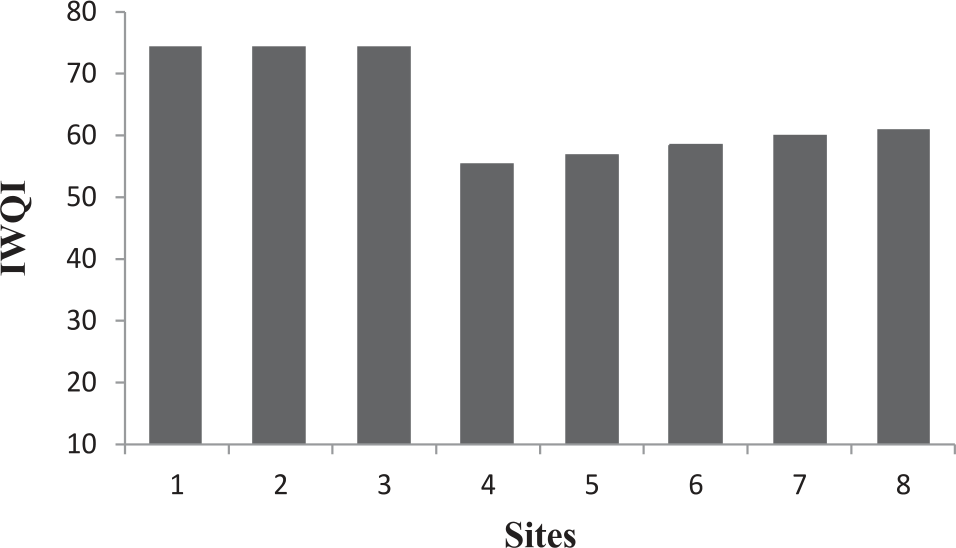
Table 7.
Some heavy metals (mg/L) concentration in the rainfall in the polluted oil refinery region.
The concentrations of Pb, CO, As, Hg and Cd varied between (21.20 to 41.49 mg/L), (2.10 to 2.65 mg/L), (1.92 to 0.85 mg/L), (0.039 to 0.015 mg/L), (0.057 to 0.026 mg/L) respectively were much higher than the WHO [18]. This may be related to the presence of local pollution sources in the study area such as oil refineries, and steel factories, and also gaze emissions from cars that discharge and pollute the atmosphere and retrain back to the earth’s surface through rainfall [28]. Pb, CO, As, and Hg are some of the most damaging and prevalent chemical components in nature that cause serious harm to humans if exceed the normal limits recommended by WHO for human health, and are produced in the air due to industrial variables, and trash materials [29]. The pollution of rainwater by Cd could be an explanation in terms of being the result of human activities. The wide utilization of paints, fertilizers, and gazes emissions from factories within the studies area could be a source of Cd [30]. Many contaminant resources may be added and cause an increment in heavy metal values within the Erbil province, like oil industries, fuel burning in different kinds of cars, and high traffic intensity [31].
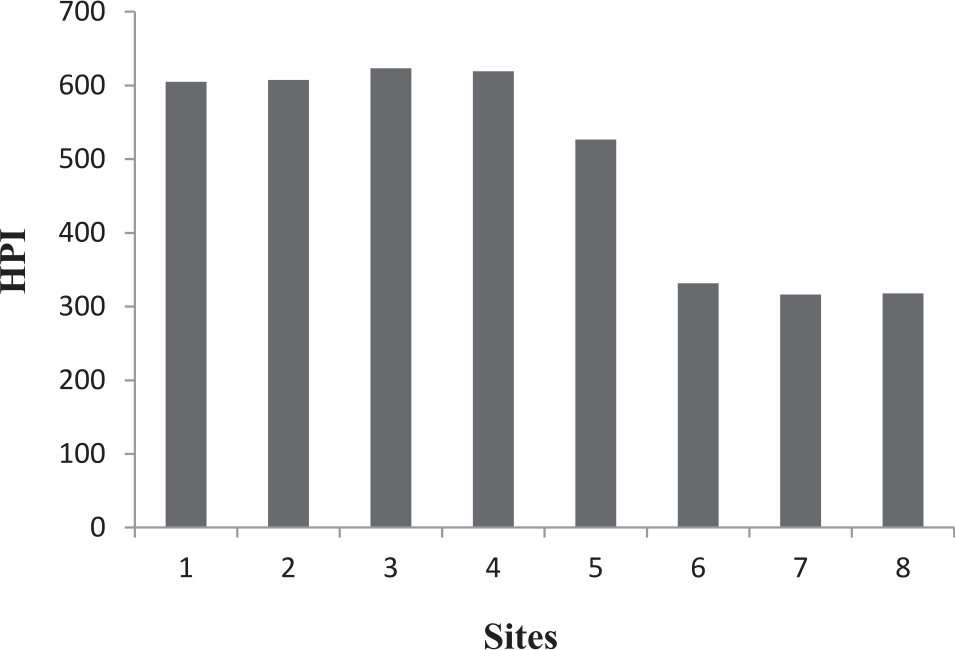
To evaluate the heavy metals pollution index (HPI) of rainwater in the studied area, we chose seven elements (Fe, Mn, Pb, Co, As, Hg, and Cd). The findings of the calculation of HPI are shown in Fig. 4 which is more than 100 which is the critical pollution index in all studied sites during the studied period. This means all sites under this investigation were polluted with heavy metals and were higher than the safe recommendation by WHO guidelines [18]. Contaminants emitted in the industry include the gases produced from oil refineries and charcoal burning, trace components in calcareous substances, dust produced by milling, organic trash in raw substances, petroleum and petroleum burning, toxic components and organic pollutants, and organic trash emission from raw substances [29, 32]. The results appeared to find different chemical contaminants that impact the quality of air. This impacts human health and raises the rise of many diseases. The reason for the finding of these components refers to the foundation of factories in the studied sites that produce environmental contaminants that impact air quality. Generally, the rainwater of the studied sites cannot be utilized for crop watering, and animals and is also unsuitable for human consumption in many sites [33].
Conclusions
Concentrations of some physical, and chemical properties and heavy metals of rainwater in the studied area were higher than the maximum allowable limit worldwide for drinking and irrigation purposes. Anthropogenic activities play the predominant role in the increase of these concentrations, which also appeared through the differences in the concentrations of these metals from one location to another. The results showed that the studied heavy metal concentrations were in the following order: Pb>Mn>As>Cd>Hg>Co> Fe>. According to values of WQI of rainwater varied between poor to good water quality for drinking uses. However valuable of IWQI ranged from low restriction to moderate restriction for irrigation purposes. The minimum value of HPI never decreases lower than 100, which means all studied sites are polluted and unsuitable for drinking purposes.

