

Introduction
Rising global industrialization releases many kinds of pollutants that cause significant harm to all life forms. Contaminants such as TPHs, HMs, metals, and pesticides are toxic to the environment and significantly affect ecosystem balance. There is a prevalence of carcinogenesis and mutagenesis in humans and plants, as well as other negative impacts [1]. Pollution of the environment is the addition of foreign substances to the environment, naturally or manmade, that are unwanted alterations in physical, chemical, and biological properties of air, soil, and water, creating health hazards or damage to all living organisms. Once petroleum hydrocarbons reach an environment, primary biological damage occurs by blocking the supply of water, nutrients, oxygen, and light, affecting soil fertility, plant growth, and germination [2]. Total petroleum hydrocarbon (TPHs) is a term that describes a large family of a hundred chemical compounds that were originally derived from crude oil. Crude oil is an important part of primary fossil fuels and is a complex mixture of hydrocarbons that occur in the earth in liquid form used to produce a lot of petroleum products that can cause pollution to the environment, especially soil and water [3].
Petroleum is achieved from under seabed and ground, and it contains hydrocarbons, sulfur, nitrogen, and oxygenated organic compounds [4]. Washing of crude oil pipelines or tanks and oil exploration generates hydrocarbon petroleum waste [5]. Polycyclic aromatic hydrocarbons (PAHs) collected as well as stayed within the soil for a much longer period due to their very slow migration or because of the durability and dispersibility of their compounds. Through bonding to other organic materials and joining biochemical processes, they may induce biotransformation [6]. Soil physical features such as soil texture and structure, aeration, saturated water absorption, and infiltration sensitivity can be influenced by hydrocarbon contaminants [7]. The existence of all these pollutants in the soil greatly decreases soil quality and reduces the germination process and plant growth. Consequently, for safe environmental protection, the restoration and elimination of these substances from the soil is important. In this century, hydrocarbons such as petroleum and their products are becoming a main source of energy. Their use in industry and everyday life has expanded tenfold, and this is leading to soil and water hydrocarbon pollution [8].
Due to natural or human activities, a variety of organic and inorganic pollutants – mostly harmful HMs – are released into the environment either directly or indirectly. Even at low concentrations, these contaminants are exceedingly damaging to human health and other living things because there is no effective way to remove them. HMs-poisoning vegetables can be watered with contaminated water and soil. Vegetables are a vital component of the human diet because of their high vitamin and mineral content and their steady antioxidant qualities. Consumption of vegetables is steadily increasing due to growing awareness of their nutritional value, and trace metal contamination is one of the most crucial aspects of food quality [9].
Plants and other living things depend on certain HMs, such as copper and zinc. However, if these metals’ bioavailability in soil is high, they might be dangerous, as could those that are thought to be inconsequential, like lead and cadmium [10]. Bioremediation is the method of using living organisms and microorganisms to reduce and convert toxins and environmental contaminants into less harmful substances [7]. When bioremediation is compared with chemical and physical remediation techniques, it is environmentally friendly and reduces cost [11]. Microorganisms like bacteria are very effective in breaking large substances and breaking down products into their metabolism. Not only bacteria but also plants that assist in hydrocarbon biodegradation. Plants can react well to various environmental conditions and can alter ecological conditions to some degree [12]. Phytoremediation is a set of techniques that use different plants to clean up contaminated air, soil, and wastewater from many pollutants in different biological processes. This mechanism has a low cost by using sun energy from plants [7]. Anatomical, genetic, and physiological characteristics of plants are important factors in determining the capacity of plant species to clean up contaminated soil and wastewater from pollutants [13].
Biological synthesis of nanoparticles (NPs) using plants, algae, microbes, and enzymes has been proposed as an alternative to chemical and physical modes of synthesis. These bio-nano factories can significantly reduce environmental pollution [14]. Contamination of soil with oil spills is a major concern. Contaminated soil is a serious, often lethal hazard to the health of humans, and it causes groundwater pollution and environmental problems and decreases the overall productivity of agricultural land. Such incidents of pollution in both soil and water have become quite frequent nowadays. These pollutants persist in soil and water for a very long time, often decades [15].
This investigation aimed to determine the capability of some native plant species in the greenhouse to biodegrade petroleum hydrocarbons to eliminate HMs from contaminated soil and to assess the potential use of plants, algae, and their synthetic nanoparticles for cleaning of soil resources polluted with TPHs.
Materials and Methods
Samples Collection and Soil Treatment
The study was conducted in the glass house of the College of Science, Salahaddin University-Erbil, during the period from 10 November 2021 to 10 May 2022. The crude oil was obtained from the Lanaz and Kar refineries in Erbil city, Kurdistan Region-Iraq. Seeds of plant species used in these experiments, which included Cyperus rotundus, Hordeum vulgare, Hordeum disticum, Triticum aestivum, Triticum durum, and Medicago polymorpha, these seeds were obtained from the Erbil Agricultural Research Center. The soil was sieved by using a sieve that had a 4 mm pore size using formalin 40% for the sterilization process and then air dried for 5 days. The sandy clay soil was apportioned into 8 kg per pot for each treatment; the height and diameter of each pot were 35 cm and 18 cm, respectively. For all experiments, the soil was treated artificially with five doses of TPHs, which included D1 5000, D2 10000, D3 15000, D4 20000, and D5 25000 mg kg−1 respectively with four replications and for control take all doses without plants. To ensure that soil and the crude oil were well-mixed, each dose of the crude oil was thoroughly mixed with 8 kg soil in a plastic sheet and then returned into pots perforated at the base to facilitate drainage and aeration. Each pot was appropriately labeled to indicate before planting.
The determination of a sufficient number of seeds was done through the floatation technique in which all seeds remaining at the bottom of the water were considered. Eight viable seeds of each plant species were sown in each pot, and the seedlings were thinned to six plants per pot after germination. All pots were irrigated with tap water one time per week in autumn and winter but in spring two times per week. To reduce the leaching of hydrocarbons, a specific plastic dish was placed under each pot and collected, then reused to irrigate the same plants for each pot.
Determination of Total Petroleum Hydrocarbon and Heavy Metals in Soil
Soil samples were taken by using a clean sampler core after 180 days. After collection, soil samples were homogenized and stored at 4ºC conditions. To extract TPH concentrations in soil, 5 g of soil samples were with 20 ml methylene chloride (CH2Cl2) and then shaken with an electric shaker for 15 min; the extract was then filtered, evaporated, and passed through silica gel before injection into gas chromatography to remove impurities matter. TPH concentration was calculated according to [16]. TPHs were determined by gas chromatography three times. Determination amount of TPH degradation by subtracting the result for each time from the initial value after planting [17, 18].
For the extraction of HMs, one gram of dried sample soil was mixed with a chemical solution that included 20 ml of H2O2 and 20 ml of H2SO4 (1:1), and the mixture was kept at room temperature overnight. The soil samples were heated by using a hot plate until boiling for two hours. After the cooled mixture, the content was filtered with Whatman filter No. 41 and diluted to 50 ml with deionized water. After digestion of the soil samples, the HMs were determined (Fe, Ni, Cr, Zn, and Pb) by using ICPE-9820 Shimadzu - ICP multi-element standard solution IV [19, 20].
Green Plants and Algal Species Silver Nanoparticles Synthesis AgNPs
Two plants (Thymus vulgaris and Nasturtium officinale) and two algal species (Cladophora glomerata and Nostoc sp.) were used for the synthesis of silver nanoparticles. This process included extraction, purification, characterization, and application. After collection, the leaves of Thymus vulgaris and Nasturtium officinale and the algal body from Halgurd Mountain were transferred to the laboratory in the Biology Department. Initially, the plant leaves (algal body) were washed with deionized water to remove impurities on leaves (algal species) and left to air-dried. For each species, clean leaves (algal species) were powdered using a mortar and pestle and then sieved. 5 g of leaves (algal species) powder mixed with 100 ml deionized water, put on heater-stirrer for 30 min at 65ºC. The mixture was cooled and then filtered through Whatman filter paper No. 1 to remove plant and algal residues. For the synthesis of silver nanoparticles, 20 ml of plant extract (50 ml algal extract with 50 ml of nitrate solution 1:1) was added into 80 ml of silver nitrate solution (10 mM) on heater-stirrer for 30 min at 65ºC under alkaline condition (pH 10) by added sodium hydroxide solution (color mixture changed from green yellowish to brown), then cooled mixture, stored at room temperature under dark condition for 72 hours. In the purification process, the mixture was centrifuged for 15 min at 15000 rpm for plant species (10 min. at 4000 rpm for algae) and dried in an oven for 1 hour at 400°C [21-25]. Both the initial concentration of Ag (10 mM) and the final concentration of Ag in the AgNPs, as determined by ICPE-9820 Shimadzu - ICP multi-element standard solution IV, and after that, the conversion was computed using these concentrations. The conversion concentration rate was 8, 7, 6, and 6 mM for Nostoc sp, Cladophora glomerata, Nasturtium officinale, and Thymus vulgaris, respectively [22-25].
Soil samples were contaminated with D1 5000, D2 15000, and D3 25000 mg kg−1 of TPHs for one week under wet conditions. TPH removal from soils was performed by putting 100 mg of contaminated soil mixture into a glass bottle, then adding hexane for dissolved TPHs in soil samples, then mixing for 2 hours, left for 8 hours to evaporate hexane, then 5 mg and 10 mg (50 and 100 mg kg−1 soil) of AgNPs solution added into 100 mg soil mixture for 48 hours, after the sonication process, and shook for 2 hours. TPHs and HMs were extracted and then analyzed using the same procedure used in phytoremediation. The removal percentage of TPH and HMs was determined by using this formula:
Removal % = Initial concentration – Final concentration / Initial concentration * 100 [26, 27]
Statistical Analysis
To analyze the data, SPSS (Version 17) was used. The means±standard error serves as the results’ expression. Tukey’s test and analysis of variance (ANOVA) were used to compare the dosages of silver nanoparticles (AgNPs) and plant species for the elimination of TPHs and HMs. Statistics were considered significant if the p-value was 0.05 or below.
Results and Discussion
Total Petroleum Hydrocarbon Removed in Contaminated Soils through Phytoremediation
Using a different plant species, phytoremediation was tested in a greenhouse condition to reduce toxicity in TPH-contaminated soils. The overall TPHs removal percentage (R%) was calculated, and all plant species showed significant variations in the removal percentage that is shown in Table 1. The (R%) of TPHs in the polluted soils varied from 5% to 53% after 180 days of phytoremediation through phytoremediators, while any change could not be recorded in control for all doses. Of the six investigated plants, C. rotundus was the one that could withstand the oil in the soil the best. R% of TPHs in soil were 47%, 48%, 53%, 19% and 11% in five different doses (D1 5000, D2 10000, D3 15000, D4 20000 and D5 25000 mg kg−1) by C. rotundus, also optimal dosage for TPHs clean-up soil was D1 for H. vulgare, H. disticum, T. durum, T. aestivum, and M. polymorpha. The low-level dose for remediation of TPHs by C. rotundus, H. disticum, T. durum, T. aestivum, and M. polymorpha was D5, except for H. vulgare in doses D4 and D5.
According to the study’s results, there was a significant difference between the plant species in reducing TPHs in soil. With increased doses of TPHs in soil, the ability of plant species to remove TPHs. The maximum R% of TPHs was 53%, which was achieved by C. rotundus in D3, and the minimum R% was 5%, which was recorded through M. polymorpha in D5. Generally, more R % of TPHs among all doses were obtained by C. rotundus, particularly in D1, D2, and D3. The C. rotundus is a potential species for phytoremediation of petroleum hydrocarbon-contaminated soils. Among the species under investigation, it is also the most tolerant and produces the most biomass. It may also survive in contaminated conditions and is reported to grow well in a wide range of contaminated soils. Rhizomes and tubers are commonly produced by C. rotundus, an erect, perennial sedge that grows to an expanse of 30-40 cm. It grows from an individual tuber that is 1-3 cm long into a vast network of subterranean rhizomes with a bulb base. The rhizomes grow to form the base bulb, from which buds emerge to produce new plants [28]. The plant under observation was observed to affect the removal of petroleum hydrocarbons at times.
Table 1.
Removal percentage of TPHs from the soil in different doses using different plant species after 180 days.
When compared to unvegetated soil, the petroleum hydrocarbon dispersion induced by the planted plant was significantly greater [29]. The ability of different plant species to withstand large concentrations of hydrocarbon pollutants in the soil will be determined in part by how stressed out the plants are by petroleum products in the soil. A plant’s capacity to act as a phytoremediator for the contamination in the polluted soil samples can be demonstrated by the plant’s ability to continue growing in the presence of the pollutant. The biodegradation of organic pollutants is enhanced more by plants with highly branching fine fiber root systems and higher total rhizosphere volume than by plants with taproot systems [30]. Plants have the potential to break down organic hydrocarbon in soil by motivating secretion and reaction with microorganisms. Utilizing plants to eliminate organic contaminants from soil prevents secondary environmental pollution and conserves resources.
Plants can not only enhance the local environmental conditions but also provide certain aesthetic value. To get nutrients and promote the activity of rhizosphere microorganisms, plants utilize their metabolic mechanism to break down organic pollutants [31]. Seminal and nodal roots make up the root system of wheat. The former mainly absorbs water and nutrients from the deep soil; this root system has the main role in removing TPHs in the soil [32]. As a result of the plants’ enhanced availability of nutrients, which also enhances the soil’s oxygen conditions, microorganisms may multiply in the plant’s root zone. Modifications in the water-air conditions in the roots or an accumulation of petroleum compounds in the tissues of plants could have caused the plants’ unfavorable reaction. Temperature and change season are other factors that they had affected the remediators’ activity to remove TPHs and HMs [33]. The present results were in line with the results found by [25, 26, 34, 35].
Heavy Metals Are Removed in Contaminated Soils through Phytoremediation
The main objective of this research was to study plant physiological processes for HMs and TPHs repair in soil contaminated under crude oil conditions. Several plant species have been utilized for this reason. Generally, the results showed that HM concentrations in the control were lower than the concentrations of contaminated soil under crude oil conditions. The removal percentage of HMs (Fe, Ni, Cr, Zn, Pb, and Mn) had significant differences among phytoremediators. HMs quantity varied within and among the plant species used as treatment choices after 180 days of the phytoremediation process. The results in Table 2, obtained data revealed variation among plant species to remediate Fe after 180 days of treatment, the high dosage to remove Fe by C. rotundus, H. vulgare, H. disticum, T. durum, T. aestivum, and M. polymorpha were 66%, 50%, 49%, 47%, 41% and 24% in control, respectively. The minimal percentage to remove Fe in soil was 26% for C. rotundus in D5, 18% and 17% for H. vulgare and H. disticum in D5, 16% for T. durum, T. aestivum in D4 and D5, 12% for M. polymorpha in D5. Among all plants, C. rotundus had a high capacity to eliminate Fe and then H. vulgare, H. disticum, T. durum, T. aestivum, and M. polymorpha, respectively.
Table 2.
Removal percentage of Fe from the soil in different doses using different plant species after 180 days.
The results after 180 days of phytoremediation showed significant statistical differences among phytoremediators. In Table 3 maximum R% of Ni was 36 in control by C. rotundus, and a low level of R% was 6% recorded in D5. In D1, D2, D3, and control, R% was 2-3 times greater than D4 and D5. The level R% of Cr shown in Table 4 that ranged from 7% to 45%. Except for the control, the best dose to remove Cr was D2 (41%) by C. rotundus, D3 (32%) for H. vulgare, D1 (34%) for H. disticum, D2 (30%) for T. durum, D and D2 for T. aestivum and D3 (25%) for M. polymorpha. As presented in Table 5, the maximum R% of Zn were 45%, 41%, 40%, 36%, 36%, and 28% in control, and the minimum of R% were 19%, 12%, 16%, 18%, 18% and 14% in D5 via C. rotundus, H. vulgare, H. disticum, T. durum, T. aestivum, and M. polymorph.
According to Table 6, remediation of Pb varied depending on all doses of the studied and phytoremediators, C. rotundus and T. aestivum had high efficiency for removal of Pb in contaminated soil was 62%, then for H. vulgare, H. disticum, T. durum was 57% and for M. polymorph was 38%, low level of R% were 31%, 21%, 23%, 20%,21% and 10% in D5 by all phytoremediators, respectively. Statistically, significant differences at (P<0.01) among phytoremediators to remove Mn in polluted soil were observed in Table 7. The maximum R% of Mn was 50%, recorded by C. rotundus, and the minimum was 7%, obtained by M. polymorph. Generally, the optimal dosage for remediation HMs obtained in control, then D1, D2, D3, D4, and D5 for all plant species, and the best plant for remediation of metals in soil was C. rotundus and then H. vulgare, H. disticum, T. durum, T. aestivum and M. polymorpha respectively. The trend for HMs R% in the investigated soils was in the descending order of Fe > Pb > Mn> Zn > Cr > Ni. The variation among phytoremediators and doses of treatment were returned to the concentration of TPHs in soil. By increasing the concentration of TPHs in soil, the efficiency of phytoremediators decreased.
Plant growth inhibition may be brought on by certain harmful substances found in petroleum, particularly low molecular weight hydrocarbons and certain polycyclic aromatic compounds. The hydrophobic properties of oil-contaminated soil might have also served as a physical barrier, reducing water and oxygen and immobilizing nutrients, particularly nitrogen [30]. Heavy metal contamination is typically more persistent than that of organic pollutants because of their inability to biodegrade [36]. Plant kinds, root regions, environmental factors, essential species, root composition, and soil physio-chemical and biological characteristics all influence the accumulation and distribution of HMs. Three main biotechnological techniques are being used to alter plants for the phytoremediation of HMs. These techniques include altering the genes of HM transporters and their uptake systems, enhancing the manufacture of HM ligands, and transforming HM into less volatile and dangerous forms [37].
Table 3.
Removal percentage of Ni from soil in different doses by using different plant species after 180 days.
Table 4.
Removal percentage of Cr from the soil in different doses using different plant species after 180 days.
Table 5.
Removal percentage of Zn from the soil in different doses using different plant species after 180 days.
Table 6.
Removal percentage of Pb from the soil in different doses using plant species after 180 days.
Table 7.
Removal percentage of Mn from soil in different doses using different plant species after 180 days.
Although each plant species has a different method for removing soil organic contaminants, most of them operate in the rhizome, where microbial and plant symbiosis contributes to soil regeneration. By eliminating organic contaminants, microbes decrease soil toxicity and enhance plant development and metabolism, while plants give microorganisms a growing environment and enhance soil structure. Plant species are utilized as cost-effective and environmentally beneficial technology for the clean-up of soil affected by harmful metals [31]. Toxic HMs, or inorganic contaminants, are not biodegradable, and their accumulation and persistence in living things pose several hazards to the environment and human health [38]. Many plant species possess defense mechanisms that enhance the capacity of the root tissues to absorb, aggregate, and concentrate HMs. These mechanisms also prevent the ions from passing from the root to the shoot, especially to the organelles that are most susceptible, such as the chloroplasts and photosystems. The capacity of root cell vacuoles to absorb and hold onto metal ions is extremely high. Some compounds, such as metallothionein, combine with HMs to produce complexes that reduce toxicity. Large areas contaminated with low to moderate levels of HMs can benefit from soil-focused phytoremediation methods. Phytoremediation cannot be used in highly contaminated locations because the harsh conditions prevent plant growth. The plant root zone is the maximum depth of soil that can be managed or purified. Depending on the plant, this depth could be anywhere from a few centimeters to many meters. HMs can be extracted from the soil and deposited in plant roots and shoots by the Cyperus plants that inhabit mining regions. It has been discovered that Cyperus rotundus is a viable choice for HMs phytoremediation. Despite the possibility of hyperaccumulation, their capacity to absorb these HMs is mostly determined by their physiological adaptations rather than the amount of metal in the soil [39].
Several dangerous HMs can be eliminated by C. rotundus, according to recent research. It can withstand stress levels of up to 1000 mg kg−1 from Cd, Pb, Zn, and Ni [40]. The soil with the highest levels of combined Cd and Zn contamination showed the most harm to H. vulgare. However, a greater reduction in plant root length was caused by higher Cd and Zn soil concentrations, which resulted in a loss of plant ability to remove contaminants from the soil [41]. The same trend of HMs pollution of soil and removal was previously mentioned by [27, 40, 42, 43].
Characterization of the Synthesized Silver Nanoparticles AgNPs
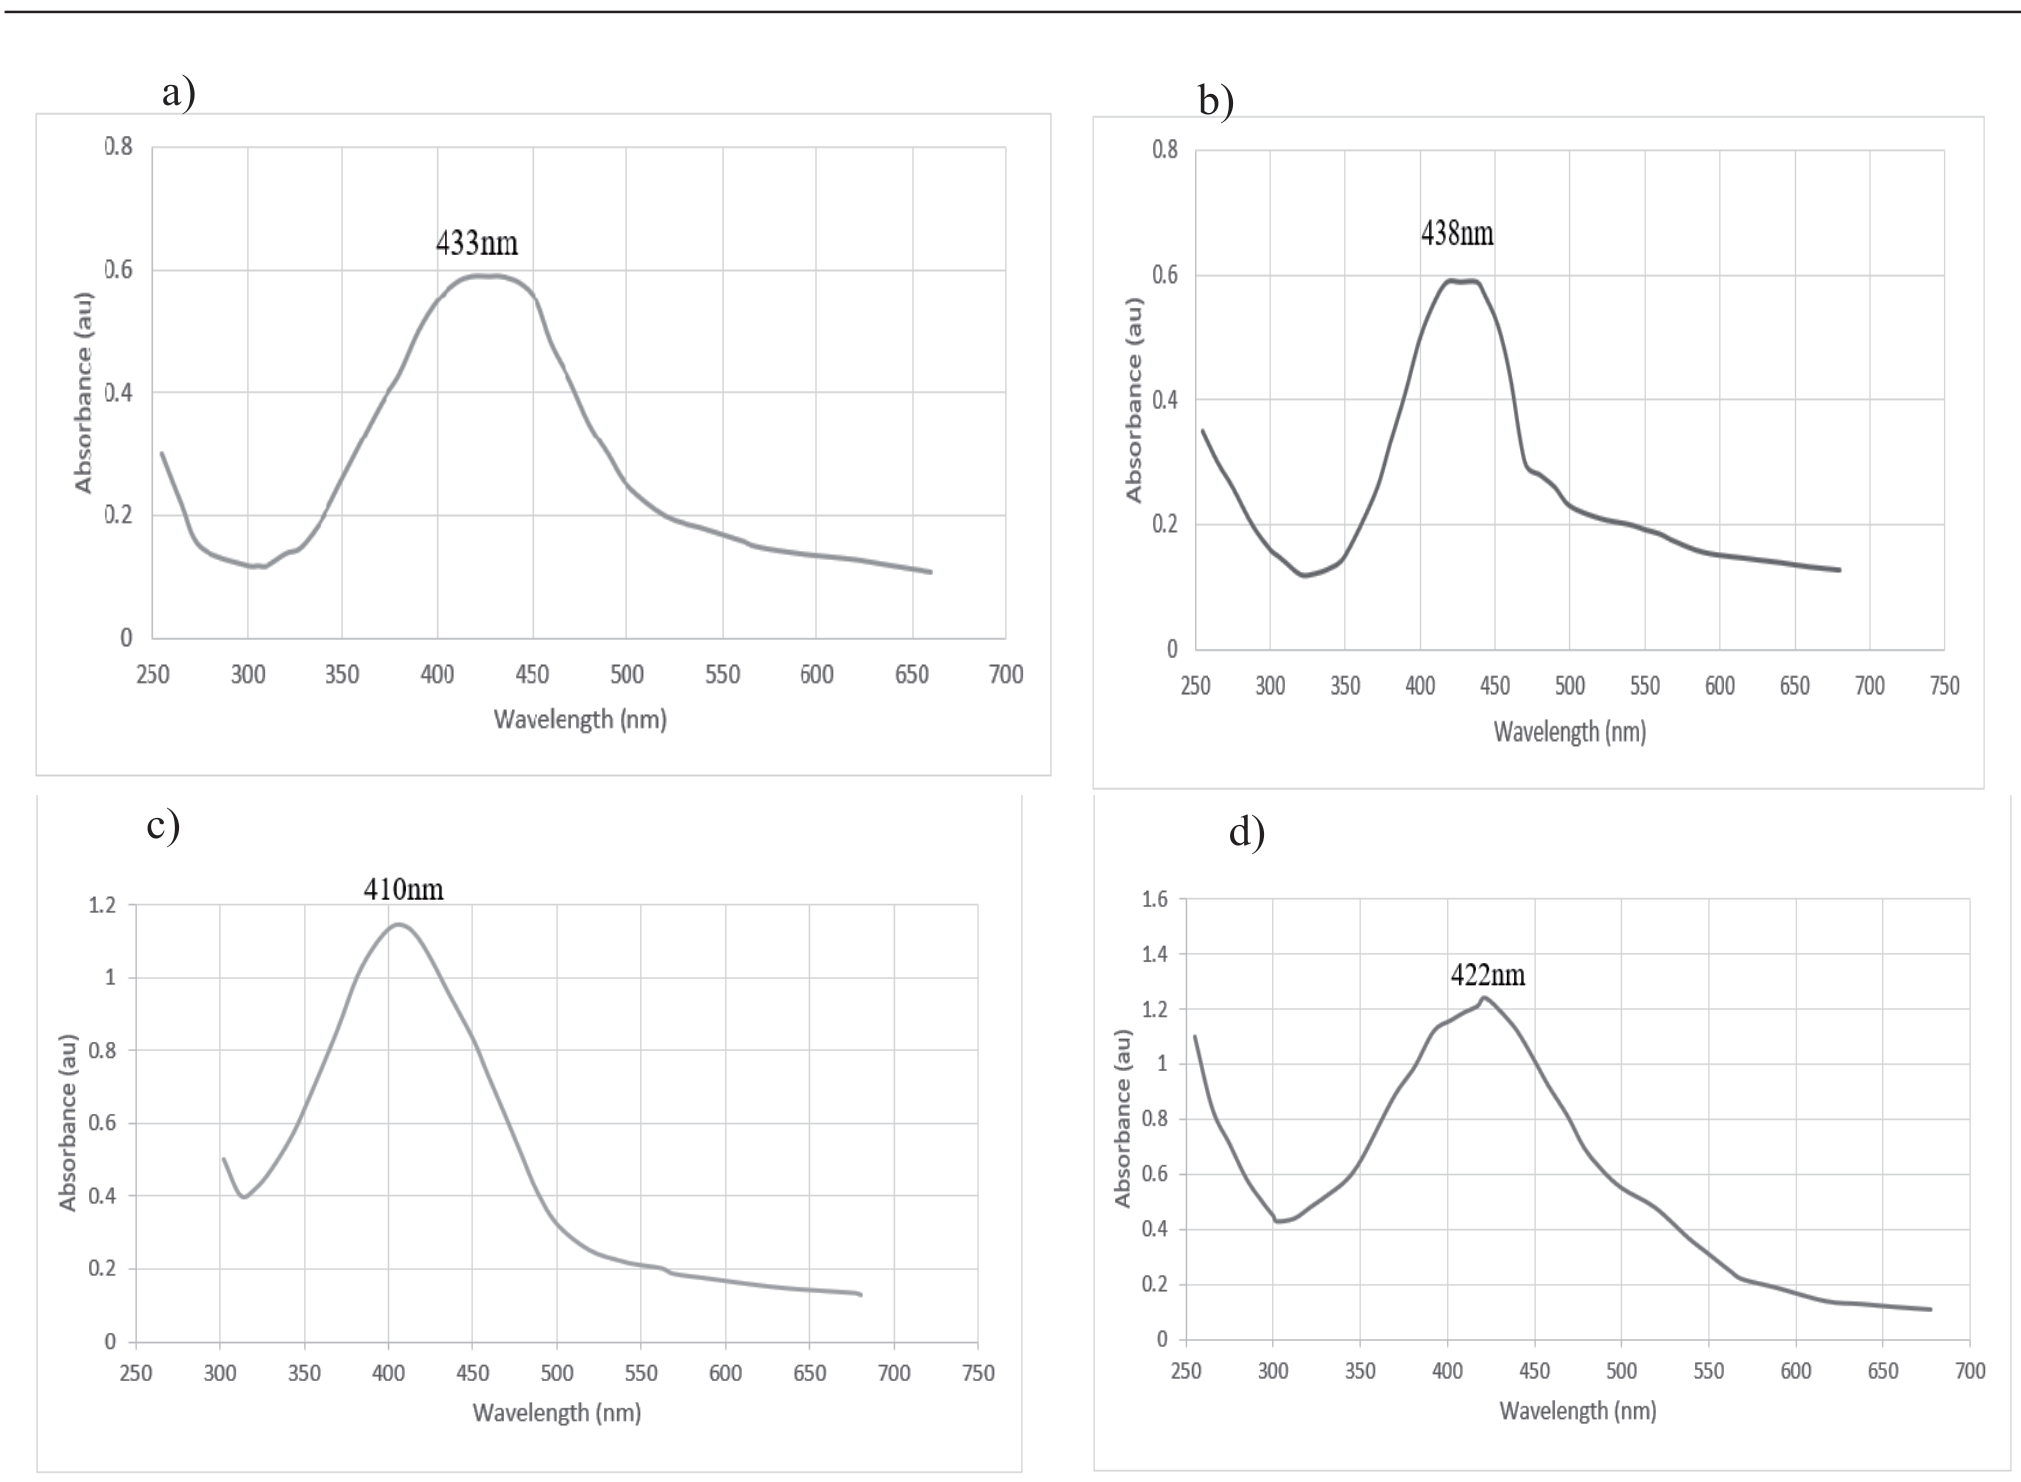
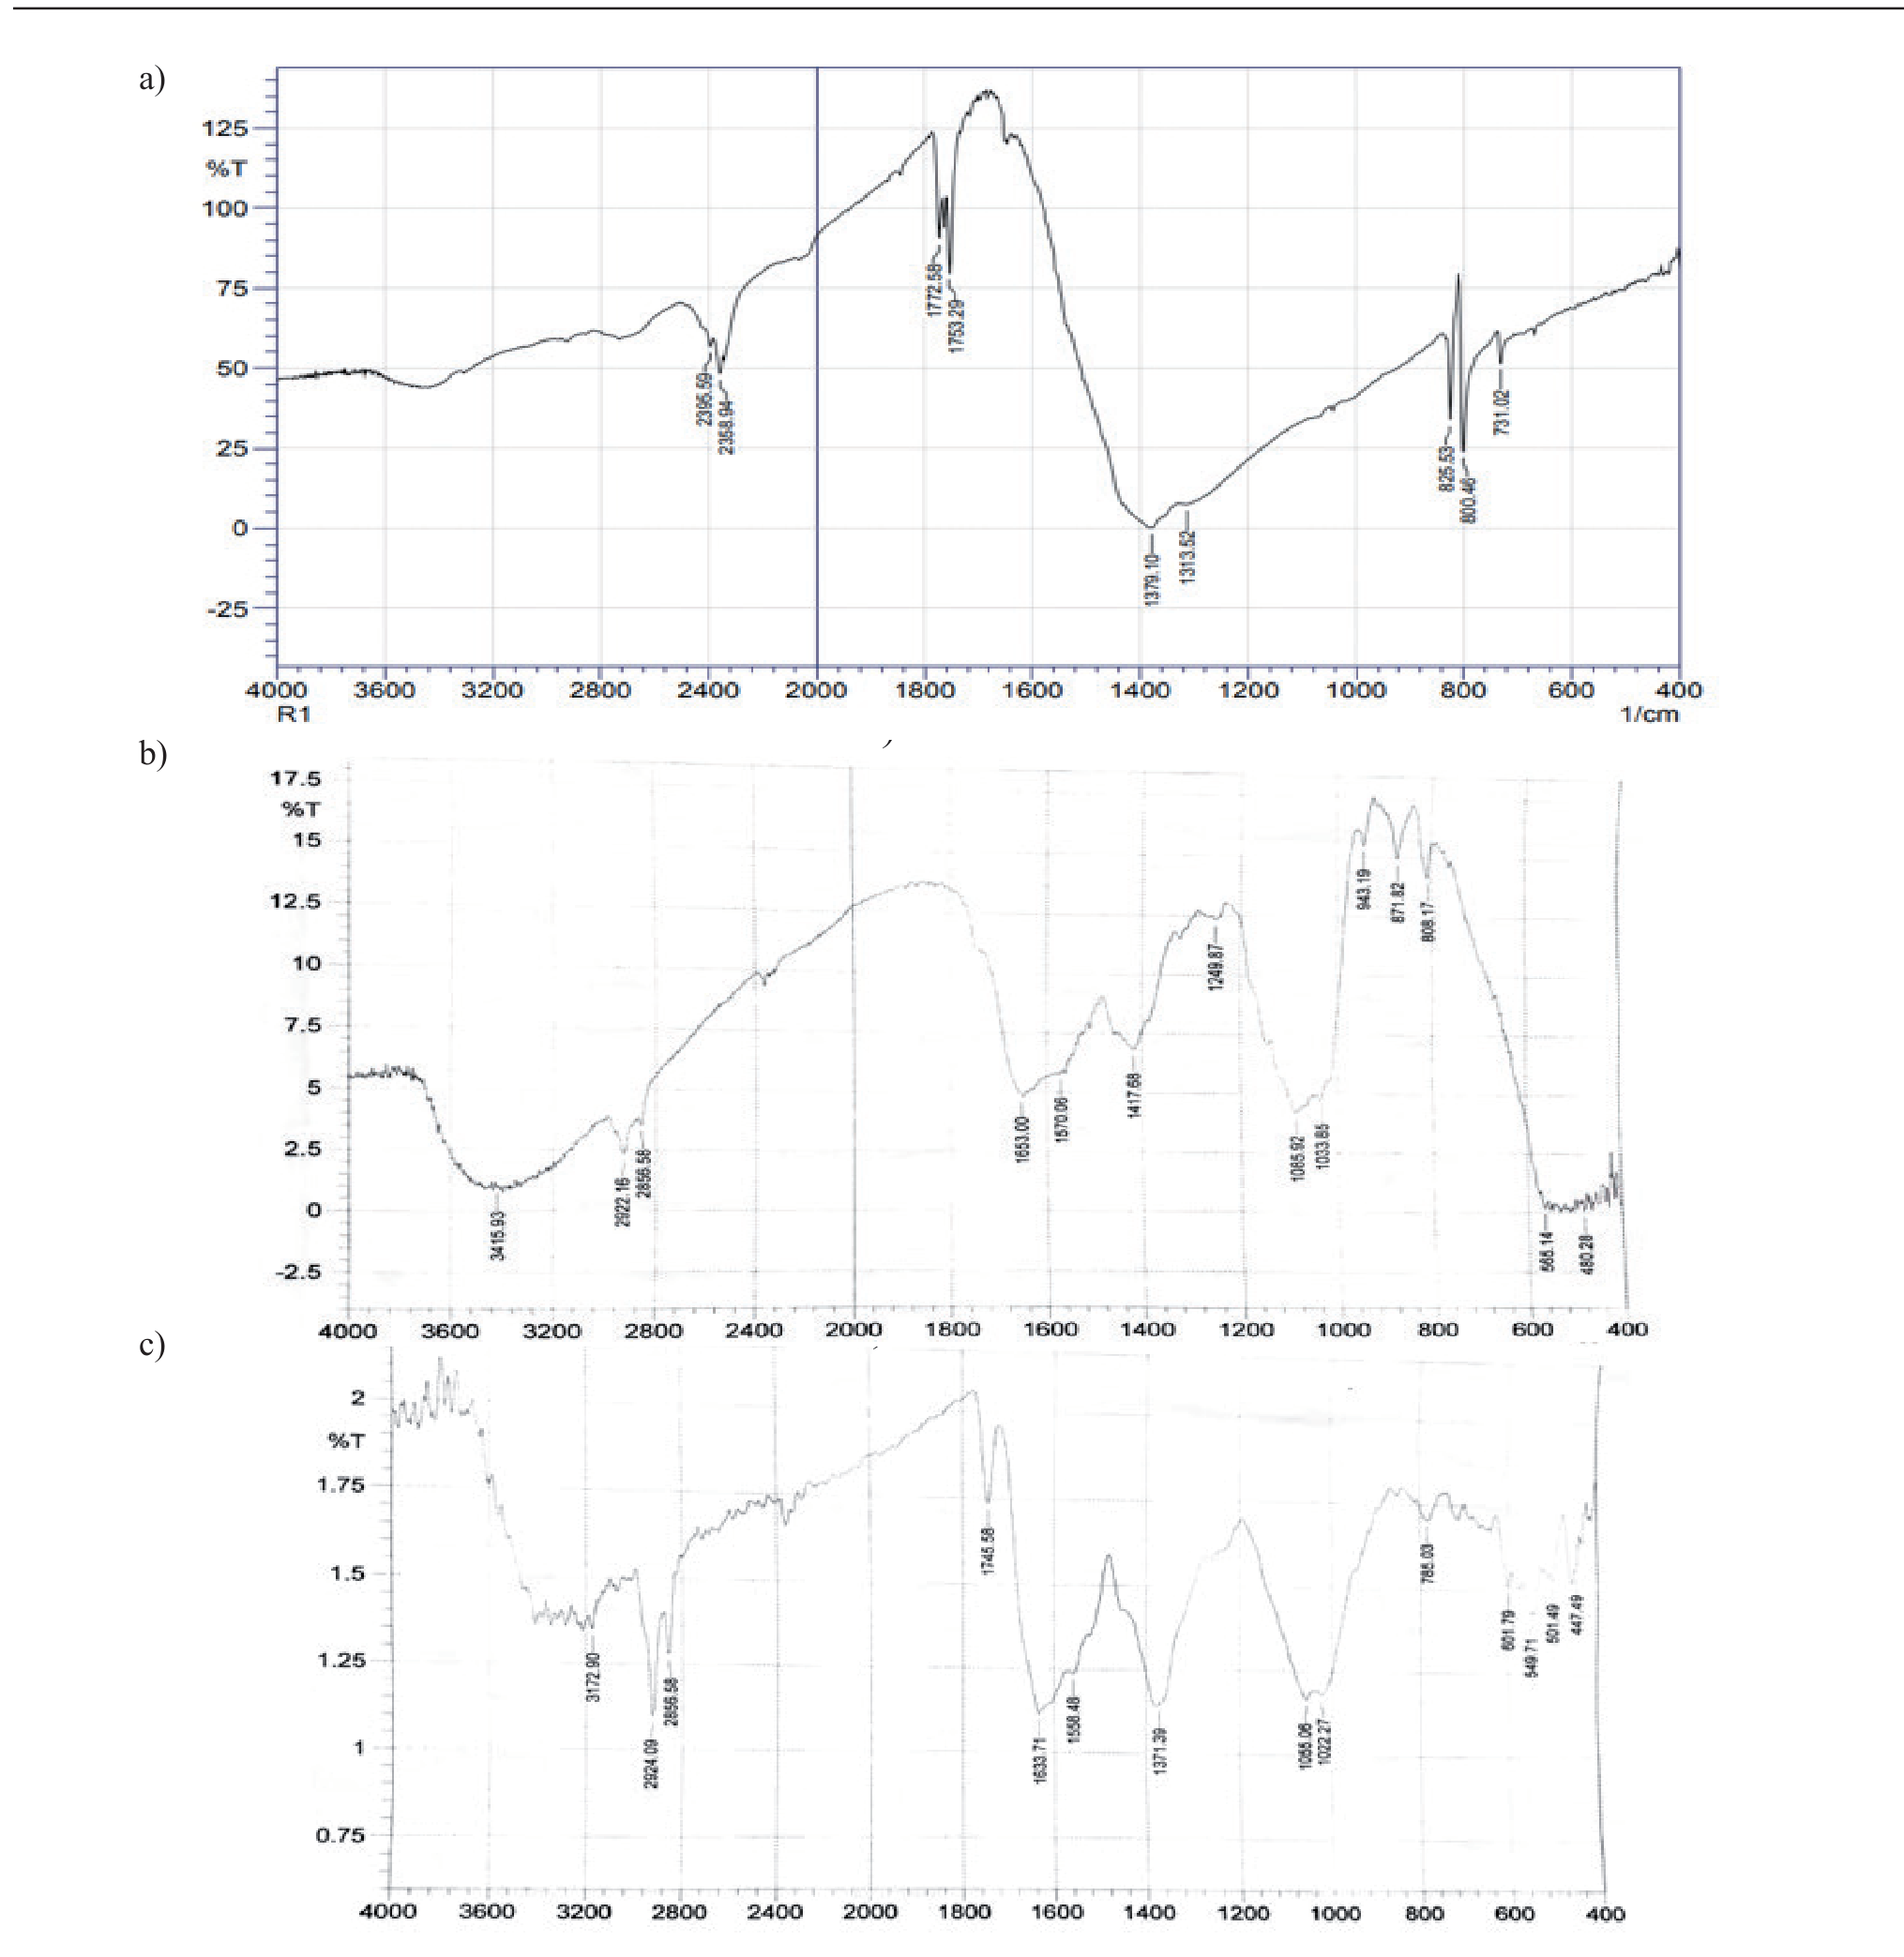
The UV-visible spectroscopic study is a useful and dependable method for confirming the formation of nanoparticles [44]. The presence of Ag nanoparticles was shown by the solution’s color changing from bright yellow to dark brown within an hour of the reaction because of surface plasmon vibrations and exciting particles. The surface plasmon resonance peaks were between 300 and 700 nm in length, as is common for AgNPs [45]. The samples’ UV-visual spectra were obtained using a spectrophotometer with a wavelength range of 300-700 nm. Fig. 1 (a-d) showed the absorbance peak of UV-Vis spectra for silver nanoparticles that included 433 nm, 438 nm, 410 nm, and 422 nm for Nostoc sp (N-AgNPs), Cladophora glomerata (CG-AgNPs), Thymus vulgaris (TV-AgNPs) and Nasturtium officinale (NO-Ag NPs) respectively. These indicated that plant and algal extracts were a successful way to obtain AgNPs. The presence of functional groups in charge of the bioreduction and stability of produced nanoparticles has been confirmed using a technique called FT-IR, it confirms the presence of a biocomponent in the algae, which was responsible for the nanoparticle’s synthesis [46]. The peaks of green-synthesized and algal extract of AgNPs varied in intensity. Several peaks were seen in the plant and algal AgNPs’ FTIR spectra. The peaks ranged from 731.02 to 2395.59, 680.24 to 3475.51, and 666.72 to 3694.72 cm−1 for CG-AgNPs, TV-AgNP, and NO-Ag NPs, respectively. The most important phytochemicals found in plants that cause the bio-reduction of nanoparticles are alkaloids, flavonoids, terpenoids, sugars, ketones, saponins, aldehydes, carboxylic acids, and amides [47].
Fig. 2a) displays the existence of significant and distinct peaks in the FT-IR spectra of the Ag-NPs, which are biosynthesized by C. glomerata. These peaks include 731.02, 800.46, 825.53, 1313.52, 1379.10, 1753.29, 1772.58, 2358.94 and 2395.59 cm−1. The bands at 825.53 and 1313.52 cm−1, respectively, represent the stretching of the Aromatics and Amine group (C–H) and (C-N) groups. Secondary amine stretching of the (C–H) group is represented by the bands at 1379.10. The ester groups can be identified by the peak in 1753.29 cm−1 and C=O bend, which indicates the presence of anhydride, which is shown in the bands that occur at 1772.58 cm−1. Alkenes and O-H stretching were also seen to change slightly from 2358.94 to 2395.59 cm−1. The FTIR spectrum of Thymus vulgaris leaf extract (TV-AgNPs) revealed a lot of absorption peaks, as seen in Fig. 2b), which suggested the complex character of plant matter.
The biosynthesized Ag nanoparticles’ IR spectra showed peaks at 447.49, 501.49, 549.71, 601.79, 785.03, 1022.27, 1055.06, 1371.39, 1558.48, 1633.71, 1745.58, 2856.58, 2924.09 and 3172.90 cm−1. The peaks 601.79 and 785.03 cm−1 link to alcohol (C-H), at 1022.27 and 1055.06 cm−1 corresponds to (C–O) stretching of phenol, at 1371.39 cm−1 related to phenol (O–H), at 1633.71, 1745.58 cm−1 associated carbonyl group (C=O), at 2856.58 and 2924.09 cm−1 correspond to alkanes (C–H) and 3172.90 cm−1 fits to alcohol (O–H). The FTIR results of Nasturtium officinale nanoparticles (NO-AgNPs) gave peaks between 480.28 to 3415.43 cm−1 in Fig. 2c). The bands vibrated 480.28, 565.14, 808.17, 871.82, 943.19, 1033.85, 1085.92, 1249.87, 1417.68, 1570.06, 1653.00, 2856.58, 2922.16 and 3415.93 cm−1. The peaks at 808.17, 871.82, and 943.19 related to alcohol (C-H), at 1033.85 and 1085.92, are indicative of the C–O bond of carbonyl. The stretching of aliphatic amines (C-N) and alkenes (C=C) is responsible for the vibrational peaks at 1417.68, 1570.06, and 1653.00 cm−1. The peaks at 2856.58 and 2922.16 cm−1 link alkanes (C-H) of the Thiol group, and 3415.93 cm−1 associated with phenol (O-H) [46, 48-51].
Total Petroleum Hydrocarbons Removed in Contaminated Soils through AgNPs
Leaf extracts from plants are frequently utilized in the manufacturing of nanoparticles. Thymus vulgaris (TV-AgNPs) and Nasturtium officinale (NO-AgNPs) leaf and plant extracts are also utilized to create silver nanoparticles, and Cladophora glomerata (CG-AgNPs) and Nostoc sp (N-AgNPs) were investigated using biosynthesized silver nanoparticles. After obtaining silver nanoparticles from four different sources, they were applied to remediate TPHs and HMs in the soil as remediators. Based on the results that they showed in Table 8, after treating soil samples with the addition of 50 mg of AgNPs into soil suspension, removal percentage (R%) of TPHs were 60%, 50%, and 47% by N-AgNPs, 56%, 49% and 47% by CG-AgNPs, 49%, 47% and 44% by NO-Ag NPs, 46% 43% and 41% by TV-AgNPs in D1, D2 and D3 respectively. The maximum R% of TPHs in soil was 60% recorded in D1 by N-AgNPs, and the minimum R% was 41% in D3 through TV-AgNPs. After an additional 100 mg of NPs into soil samples, R% were 80%, 78%, and 72% obtained by N-AgNPs, 77%, 74%, and 72% by CG-AgNPs, 71%, 69%, and 68% by NO-Ag NPs, 68%, 65% and 66% by TV-AgNPs in D1, D2, D3 respectively. The highest R% was 80%, measured in D1 through N-AgNPs, and the lowest level was recorded by TV-AgNPs in D2.
In this investigation, statistically significant differences at (p≤0.01) among four different NPs were observed for removed TPHs from contaminated soil samples. The best NPs were N-AgNPs, and then CG-AgNPs, NO-AgNPs, and TV-AgNPs as remediators respectively. Generally, by increased doses of TPHs in soil, R% decreased. When the amount of AgNPs was raised, the R% of TPHs was increasing in soil samples. Because of their large surface area and increased reactivity, NPs have a lot of potential for cleaning up a variety of environmental pollutants. Importantly, the diminutive size and related Subsurface transit capability offer chances for in situ cleanup of polluted areas [52]. The strong reactivity and sorption of the nanoparticles are responsible for the removal of TPHs from soils. The removal may be influenced by the hundred components that make up TPHs, which vary in molecular weight, size, viscosity, solubility, hydrophobicity, and other characteristics [53].
Fig. 2.
FTIR Spectrum of biosynthesized AgNPs from a) Cladophora glomerata, b) Thymus vulgaris, and c) Nasturtium officinale.
AgNPs have been combined with several different substances, including metal oxides and organic compounds, to increase the final nanocomposite’s overall efficiency [23]. The reactivity and adsorption capacity of nanoparticles (NPs) are enhanced by their higher surface area-to-volume ratio. Thus, this characteristic makes it possible for NPs to efficiently eliminate pollutants and contaminants such as organic molecules and HMs, given that AgNPs are safe and biocompatible, it makes sense to use them for environmental remediation in the form of photocatalysts [54]. The same results had the same consequences previously [34].
Heavy Metals Are Removed in Contaminated Soils through AgNPs
Hazardous substances found in the natural soil environment are the source of soil pollution. Common soil contaminants are HMs, which occur naturally in soil but often at dangerous concentrations. Manufacturing, mining, and landfill sites, especially those that take in industrial waste and municipal or industrial sludge, are the main sources of polluted soil [55]. Depending on the obtained results shown in Table 9, four distinct types of nanoparticles showed significant variation in the removal amounts of HMs (Fe, Ni, Cr, Zn, Pb, and Mn) in soil after adding 50 mg of AgNPs for each sample soil. Maximum removal percentages of Fe, Ni, and Cr were 44 %, 47%, and 47% obtained in D1 by N-Ag NPs, and the minimum R% of Fe was 18% recorded in D1, Ni was 20% in D1, Cr was 14% in D3 by TV-AgNPs, respectively. In this investigation, the highest R% of Zn was 50% in D2 and D3 by N-Ag NPs, and the low level was 15 in D2 by TV-Ag NPs. For Pb, the maximum R% was 57% in D1 by CG-AgNPs, and Mn was 54% in D1 by N-Ag NPs. While low-level R% of Zn was 15% in D2, Pb was 9% in D2, and Mn was 19% in D3, all by TV-AgNPs, respectively.
Table 8.
Removal percentage of TPHs from soil in different doses using different types of AgNPs.
Table 9.
Removal percentage of HMs from soil in different doses using different types of adding 50 mg kg-1 AgNPs.
Depending on the obtained data shown in Table 10, added 100 mg of AgNPs in soil samples, the best dosage to remove HMs (Fe, Ni, Cr, Zn, Pb, and Mn) was D1 through N-Ag NPs except Pb by CG-Ag NPs, maximum R% for Fe, Ni, Cr, Zn, Pb, and Mn were 88%, 77%, 67%, 78%, 83% and 80%, minimum level were 62%, 51%, 32%, 43%, 47% and 41% respectively. Generally, N-AgNPs were the best AgNPs to eliminate HMs, except for Pb, which had CG-Ag NPs. By increasing the concentration of TPHs and HMs, the efficiency of AgNPs for remediation was decreased. It has been demonstrated that NPs are efficient at removing HMs through adsorption and coagulation processes. The main way that sewage sludge is applied to land is to introduce AgNPs into terrestrial systems. The physical and chemical properties of metal-based nanoparticles are known to affect their environmental behavior, destiny, and ecotoxicity once they are present in an ecosystem.
Physical attributes include the size and shape of the nanoparticles, while chemical attributes include the metal’s water solubility and the surface’s acid-base nature, transformation processes such as aggregation, sorption to surfaces, and dissolution to metal ions are influenced by the physical and chemical properties of nanoparticles. Furthermore, the ecotoxicity, destiny, and environmental behaviors of metal-based nanoparticles are influenced by their surface coatings [56]. Several plants are capable of accumulating metals and then intracellularly converting those metals to NPs. Several biomolecules, including proteins, phenolics, polysaccharides, amino acids, alkaloids, aldehydes, flavones, ketones, saponins, tannins, terpenoids, and vitamins, are essential for the reduction of metals in plants, variations in the stabilizing and reducing potential of the biomolecules found in the plant cause variations in the size, shape, and characteristics of accumulated NPs [57]. For the adsorption of heavy pollutants from aqueous solutions, silver nanoparticles are a promising material. However, silver nanoparticles are not environmentally harmful substances [58]. The results were agreed with the results obtained by [46].
Table 10.
Removal percentage of HMs from soil in different doses using different types of adding 100 mg kg-1 AgNPs.
Conclusions
Phytoremediation of petroleum-polluted soils has been demonstrated in greenhouse studies. The six plant species examined were C. rotundus, H. vulgare, H. disticum, T. aestivum, T. durum, and M. polymorpha as phytoremediators. The C. rotundus was the plant that adapted to the soil’s oil the best out of the six that were studied, C. rotundus in D3 reached the highest R% of TPHs, while M. polymorpha in D5 recorded the lowest R%. With increased doses of TPHs in soil, the ability of plant species to remove TPHs. After 180 days of phytoremediation, the proportion of HMs (Fe, Ni, Cr, Zn, Pb, and Mn) removed varied significantly among phytoremediators. The R% of HMs differed both within doses and among the plant species by utilized as treatment options. The pattern for HMs R% in researched soils was in the descending order of Fe > Pb > Mn > Zn > Cr > Ni. In general, the best plant for remediation of metals in soil was C. rotundus, followed by H. vulgare, H. disticum, T. durum, T. aestivum, and M. polymorpha.
The optimal dosage for remediation of HMs was identified in the control, followed by D1, D2, D3, D4, and D5 for all plant species. Absorbance peak of UV-Vis spectra for silver nanoparticles that included 433 nm, 438 nm, 410 nm, and 422 nm for N-AgNPs, CG-AgNPs, TV-AgNPs, and NO-AgNPs, respectively. These indicated that plant and algal extracts were a successful way to obtain AgNPs. After treating soil samples with the addition of 50 and 100 mg of AgNPs into soil suspension, the maximum R% of TPHs and HMs in soil was recorded by N-AgNPs, and the low level was recorded by TV-AgNPs. Generally, by increased doses of TPHs in soil, R% decreased. When the amount of AgNPs was raised, the R% of TPHs and HMs increased in soil samples. Generally, the descending order was N-AgNPs > CG-AgNPs > NO-AgNPs > TV-AgNPs in the ability of AgNPs for R% of TPHs and HMs.

