


Introduction
All countries deal with serious issues, such as greenhouse gas emissions (GHGs) that can negatively impact the environment and humans. Greenhouse gases can cause climate change, damaging the environment, flora, fauna, and humans, and decreasing economic growth. Therefore, most countries worldwide are committed to preventing climate change by mitigating greenhouse gas emissions [1-3]. All the countries participating in the Paris Declaration set long-term policies to achieve net zero greenhouse gas emissions between 2050 and 2060 [4-5].
Emission mitigation is also carried out to achieve the Sustainable Development Goals (SDGs). Indonesia participated in signing the Paris Declaration and adopting the sustainable development platform of the SDGs. The Government of Indonesia (GoI) actively strives to reduce emissions and improve environmental quality for sustainable development while mitigating damage caused by global warming [6]. Furthermore, GoI’s commitment to mitigate greenhouse gas emissions is contained in the Plan of National Development and the Regulation of Indonesian President 59 of 2017 as guidance for the implementation of the SDGs. The regulation regulates the legal basis for implementing the SDGs in Indonesia [7].
The economy’s growth can correlate with increased carbon emissions [1]. Likewise, manufacturing industry activities contribute directly and indirectly to global greenhouse gas emissions [8]. Furthermore, export is an important factor in economic development. Export activities can stimulate an increase in national and regional output and increase the rate of economic growth [9]. However, exports of goods and services can result in carbon emissions. Research in China and Tunisia shows that increased production will increase CO2 emissions due to exports, especially in manufacturing industrial goods. Likewise, the increase in global trade in export-import activities is contained in the increase in carbon emissions [10-14].
The question is whether the impact due to increasing exports on the development of the economy and the environment has been calculated in total, including direct impacts, indirect impacts, and induced effects. This calculation of the total impact might be rarely carried out, especially in Indonesia. The use of extended input methods by Life Cycle Assessment (LCA) researchers is popular enough to estimate the impact due to rising final demand on the environment, particularly greenhouse gas emissions [15-20]. An extended input-output method is based on Leontief’s basic equations that can estimate the impact of a unit change in final demand composed of household consumption, government spending, investment, and exports on economic aspects such as creating output, gross value added (GVA), employment, and environmental aspects such as emissions. This quantitative method approach is indispensable to support green industry development planning and contribute to sustainable development.
The objective of this study is to examine the total impact, which is an accumulation of direct impacts, indirect impacts, and induced effects caused by an increase in export that is one of the elements of the final demand in creating output, value-added, and employment needed by the manufacturing industry sectors, and to predict CO2e emissions that will arise that need to be mitigated as an effort to develop green industries.
Material and Methods
Extended Input-Output Model
The used to analyze is an extension of the model of Input-Output developed by Leontief in the 1930s-1940s and has expanded considerably since then. The Leontief model is based on the interdependent relationship between one sector and another sector of the economy. The basic equation model of Leontief is as follows:
X shows the vector of total sectoral outputs. A shows the direct coefficient matrix. Y shows the column vector of total final demand. I shows the matrix of identity and (I – A)–1 shows the matrix of Leontief inverse, representing direct impacts and indirect impacts due to a unit change in final demand. This shows the Type I multiplier, which is defined as (direct and indirect impacts)/(direct impact). This means that this Type I involves two impacts [16, 21-27]. Furthermore, Equation (1) can be expanded by multiplying it by the coefficient of gross value added (GVA'). Therefore, the value of sectoral GVA might be estimated. The equation for sectoral GVA type I is as follows:
GVA shows the vector of gross value added and GVA' shows the diagonal matrix of gva coefficients; gva is the coefficient of gross value added:
GVA coefficient of sector j:
Likewise, Equation (1) can be extended to predict the labor required. It can be expanded by multiplying it by the labor coefficient, and then the sectoral labor can be predicted. The equation for sectoral labor of type I is as follows:
L is the vector of sectoral labor, L' is the diagonal matrix of the labor coefficient, lj is labor coefficient:
Labor coefficient of sector j:
Moreover, researchers related to LCA also use the extended equation model (1) to estimate the impacts on the environment, particularly GHGs due to the increase in final demand. The equation to estimate GHGs of type I is as follows:
GHGs is the vector of the emission, and GHGs' is the diagonal matrix of the emission coefficient (ghg) [15-18, 24].
Emission coefficient of sector j:
Furthermore, to identify the three impacts, i.e., direct impacts, indirect impacts, and induced effects due to the effect of household consumption, matrix A should be substituted by matrix A*, informing that matrix A adds a column of the coefficient of household consumption and a row of wages and salaries coefficients coming from wages and salaries divided by total input. A* is called a closed coefficient matrix, so the Equations (1), (2), (4), and (6) become as follows:
Where (I – A*)–1 shows the direct impacts, indirect impacts, and induced effects. Type II multipliers involve three impacts: direct, indirect, and household-spending effects (induced) of a final demand change. X * shows the output vector type II, GVA * shows gross value-added vector type II, L * shows the labor vector type II, and GHG * is the emission vector of GHGs type II [15, 16, 21-24].
Case Study
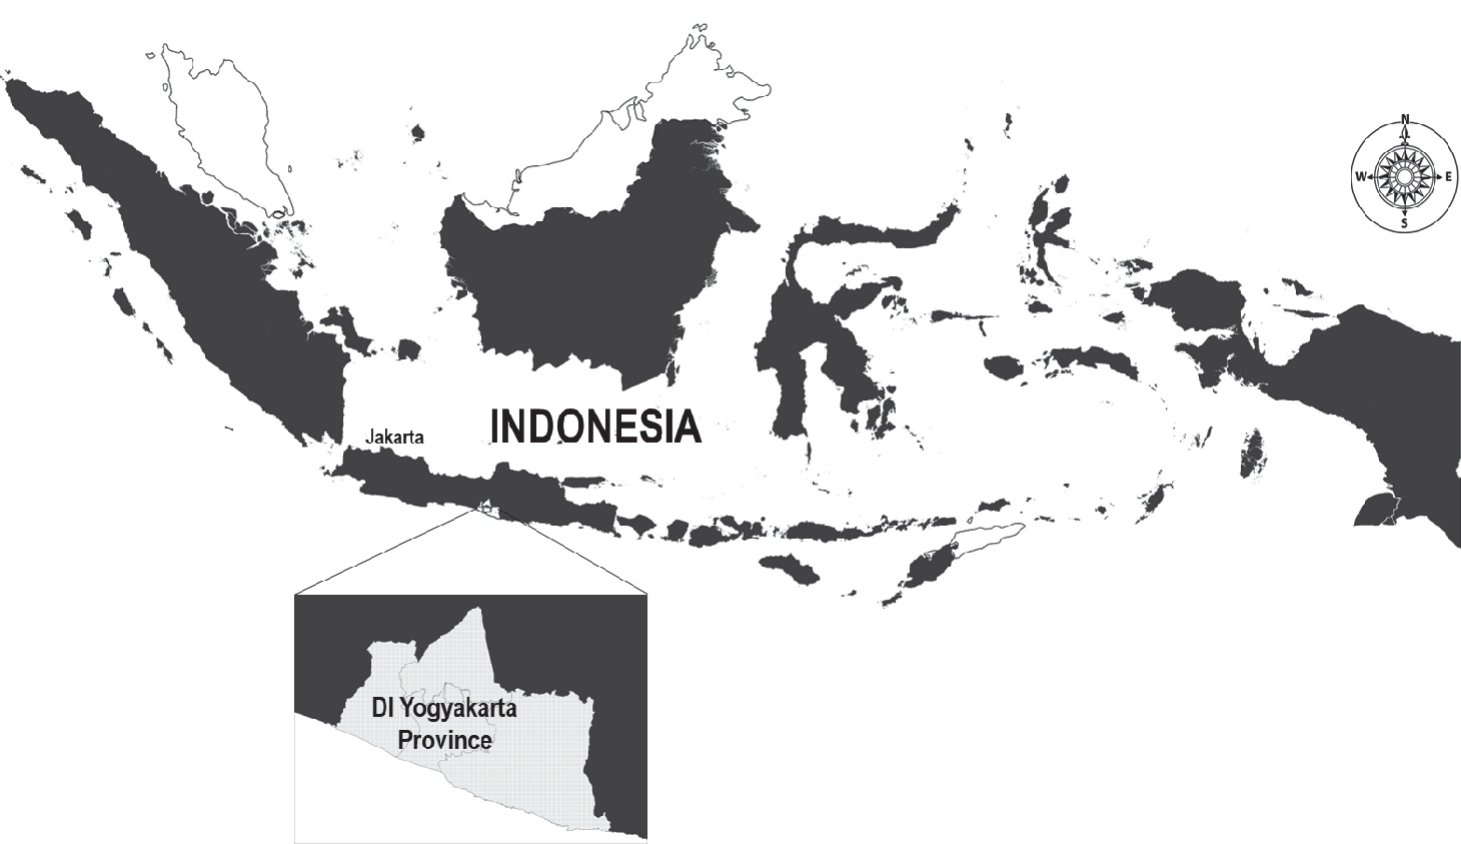
The region becoming a case study in this study is Daerah Istimewa (Special Region) Yogyakarta (DI Yogyakarta) for several reasons (Fig. 1). DI Yogyakarta is one of the 38 provinces in Indonesia that responded to net zero emission (NZE) by issuing DI Yogyakarta Governor’s Decree Number 51 of 2012 concerning the Regional Action Plan for Mitigating GHG Emissions. The commitment of the DI Yogyakarta Provincial Government to the development of the manufacturing industry sector that leads to the development of the Green Industry is regulated in DI Yogyakarta Regulation 7 of 2019 concerning the Plan of Industrial Development in Yogyakarta for 2019-2039. It is specifically stated in Article 3: implementing an independent industry with competitive and environmental perspectives. This shows the strong commitment of DI Yogyakarta local governments to develop green manufacturing industries. Furthermore, the role of the manufacturing industry sector in the regional economy, or Gross Regional Domestic Product of DI Yogyakarta, is relatively high compared to other sectors. Likewise, post Covid-19, the export value of DI Yogyakarta economic sectors showed a significant increase. In 2020, the export value of DI Yogyakarta Province was USD 398.6 million, in 2021 it was USD 557 million, and in 2022 it was USD 529 million [28-29], and it is projected that the export value in 2024 will be around USD 527 million (IDR 7.905 trillion).
The main data used was the DI Yogyakarta Input-Output Table for 52 sectors in 2016 and other supporting data issued by the Statistics Bureau of BPS, DI Yogyakarta Province, and the emission data was obtained from the Local Government DI Yogyakarta related to the Report of Greenhouse Gas Inventory [30, 31]. Some data was extrapolated, such as labor and emission data. This was done because there needs to be a sectoral data conversion whose classification is incompatible. All data collected is processed with Excel.
Results and Discussion
Overview Of DI Yogyakarta Region and Emissions
The region of DI Yogyakarta is a province in Indonesia located in the part of the island of Java. The Indonesian Ocean bounds the southern part of Yogyakarta, while the Northeast, Southeast, West, and Northwest bound the Central Java region. According to the Meteorology, Climatology, and Geophysics Agency (BMKG) records, the average air temperature in DI Yogyakarta in 2021 was 27.8ºC. Furthermore, the economy of DI Yogyakarta Province has also experienced an increase in growth. In the fourth quarter of 2022, the economic growth of DI Yogyakarta Province was 5.53% (year on year). The economic structure is dominated by the business fields of manufacturing, information and communication industries, agriculture, and construction, as well as the sectors of accommodation, food, and beverage, with a contribution of 52.01 percent. In 2020, the export value of DI Yogyakarta Province was USD 398.6 million, USD 557 million in 2021, and USD 529 million in 2022. It is projected that the export value in 2024 will be around USD 527 million, or around IDR 7.905 trillion. The manufacturing industry is an important sector for DI Yogyakarta. The average contribution of this sector to this GRDP is about 13 percent per year, making the manufacturing industry the first largest sector, followed by the information and communication industry [29- 32].
The Provincial Government of DI Yogyakarta has conducted a GHG inventory based on the National GHG Inventory Guidelines since 2012. The 2013 National GHG Inventory Report is the second GHG inventory conducted by the government. In general, this GHG inventory uses the ‘Tier’ method 1 to 2 in almost all categories. In some cases, especially in land use categories, inventory is conducted using Tier 3. The depth of the method varies between sectors and between categories due to different documentation and data quality. The equation for estimating GHG emissions and removals can be written in the form of the following simple equation: GHG Emissions = AD x EF, Where AD is activity data, namely data on development activities or human activities that produce GHG emissions or removals and EF is a GHG emission or absorption factor that shows the amount of emissions/ removals per unit of activity carried out. There are 4 aggregate sectors whose emissions are measured, namely: 1). Energy procurement & use; 2). Industrial process & product use; 3). Agriculture, forestry, & other land use; and 4). Waste management [31].
Total GHG emissions from all economic activities in DI Yogyakarta fluctuated in the period 2012-2020. The data shows that in 2012, GHG emissions amounted to 5,742.07 Gg CO2e, then continued to increase until 2016 to 8,565.15 Gg CO2e and in 2017, it increased dramatically to reach 12,378.06 Gg CO2e. The increase in emissions was caused by changes in land cover (the forestry sector) of 5,946 Gg CO2e. In 2018, GHG emissions decreased to 4,632.01 Gg CO2e. From 2019 to 2020, there was a significant increase from 5,285.50 to 8,305.18 Gg CO2e [31].
Calculation Results of The Impacts Type I with Two Impacts: Direct Impacts and Indirect Impacts
In this subsection, the direct and indirect impacts of the export increase of around IDR 7.905 trillion will be examined on creating output, GVA, absorbed workforce and CO2e emissions from 14 manufacturing industry sectors in the DI Yogyakarta region, namely 1). Industry of Food & Beverage; 2). Industry of Tobacco; 3). Industry of Textile & Clothes; 4). Industry of Leather, Footwear & Leather Goods; 5). Industry of Wood, Cork, Rattan & Bamboo Goods; 6). Industry of Paper & Paper Goods, Reproduction of Recorded Media & Printing; 7). Industry of Chemical, Traditional Medicine & Pharmaceutical; 8). Industry of Rubber, Plastics & Rubber Goods; 9). Industry of Nonmetallic Excavated Goods; 10). Industrial Goods of Metals, Electronic Goods, Computer, Optics & Equipment of Electricity; 11). Industry of Machinery & Equipment; 12). Industry of Transportation Equipment; 13). Industry of Furniture; and 14). Industry of Other Processing, Installation Services & Repair of Machinery & Equipment.
Direct and indirect impacts on output creation, GVA, absorbed labour, and the number of carbon emissions incurred will be identified. The output is calculated based on the multiplication of the volume of goods and services produced by the price per unit. Gross Value Added or also referred to as Primary Input, is a cost paid to production factors such as labour, capital owners, fixed capital goods, and land. GVA consists of components: a). wages and salaries; b). business surplus, which is a combination of profits, land rent, and net capital interest payments (including net dividend payments); c). depreciation; d). indirect taxes; and e). subsidies on goods and services. In many macro analyses of labour, it is often referred to as employment opportunities or employment [30-31].
Table 1 shows the calculation results of the impacts Type I, direct and indirect impacts of increased exports on creating output and gross value added. The table shows that the output created by 14 manufacturing industries is IDR 5,124,899.37 million. The five largest sectors, namely Industry of Textile & Clothes, which amounted to almost IDR 2.59 trillion, were followed by Industry of Furniture of IDR 469,469.41 million; Industry of Leather, Footwear & Leather Goods of IDR 463,113.07 million; Industry of Food & Beverage of IDR 336,169.72 million; Industry of Wood, Cork, Rattan & Bamboo Goods amounting to IDR 271,222.89 million. Table 1 also shows that the gross value added generated by 14 manufacturing industry sectors is IDR 2,013,120.44 million. The five largest manufacturing sectors are the Industry of Textile & Clothes, which is almost IDR 975,898.59 million, followed by the Industry of Furniture of IDR 224,189.10 million, the Industry of Leather, Footwear & Leather Goods at IDR 192,655.14 million, the Industry of Food & Beverage at IDR 98,112.25 million, and the Industry of Wood, Cork, Rattan & Bamboo Goods amounting to IDR 119,498.86 million.
The results of calculation type I with two impacts on employment are shown in Fig. 2. The picture shows that the total workforce absorbed by 14 manufacturing industry sectors is 65,340.
The five largest sectors are: Industry of Textile & Clothes, with as many as 32,986 people, or almost 50% of the total; Industry of Furniture, with as many as 5,985 people; Industry of Leather, Footwear & Leather Goods of 5,904 people; Industry of Food & Beverage of 4,286 people; and Industry of Wood, Cork, Rattan & Bamboo Goods, as many as 3,457 people. However, the calculation results also show that the impact on carbon emissions is reflected in Fig. 3. The figure shows that the total carbon emissions produced by 14 manufacturing industry, either directly or indirectly, amounted to 35.26 GgCO2e. The five largest sectors are namely the Industry of Textile & Clothes of 18.26 GgCO2e, which is the highest one, the Industry of Leather, Footwear & Leather Goods of 3.06 Gg CO2e, the Industry of Furniture of 2.78 GgCO2e, Industry of Food & Beverage of 2.70 GgCO2e and Industry of Wood, Cork, Rattan & Bamboo Goods of 1.72 GgCO2e.
Table 1.
Calculation of the impacts Type I: direct and indirect impacts on output, and GVA.
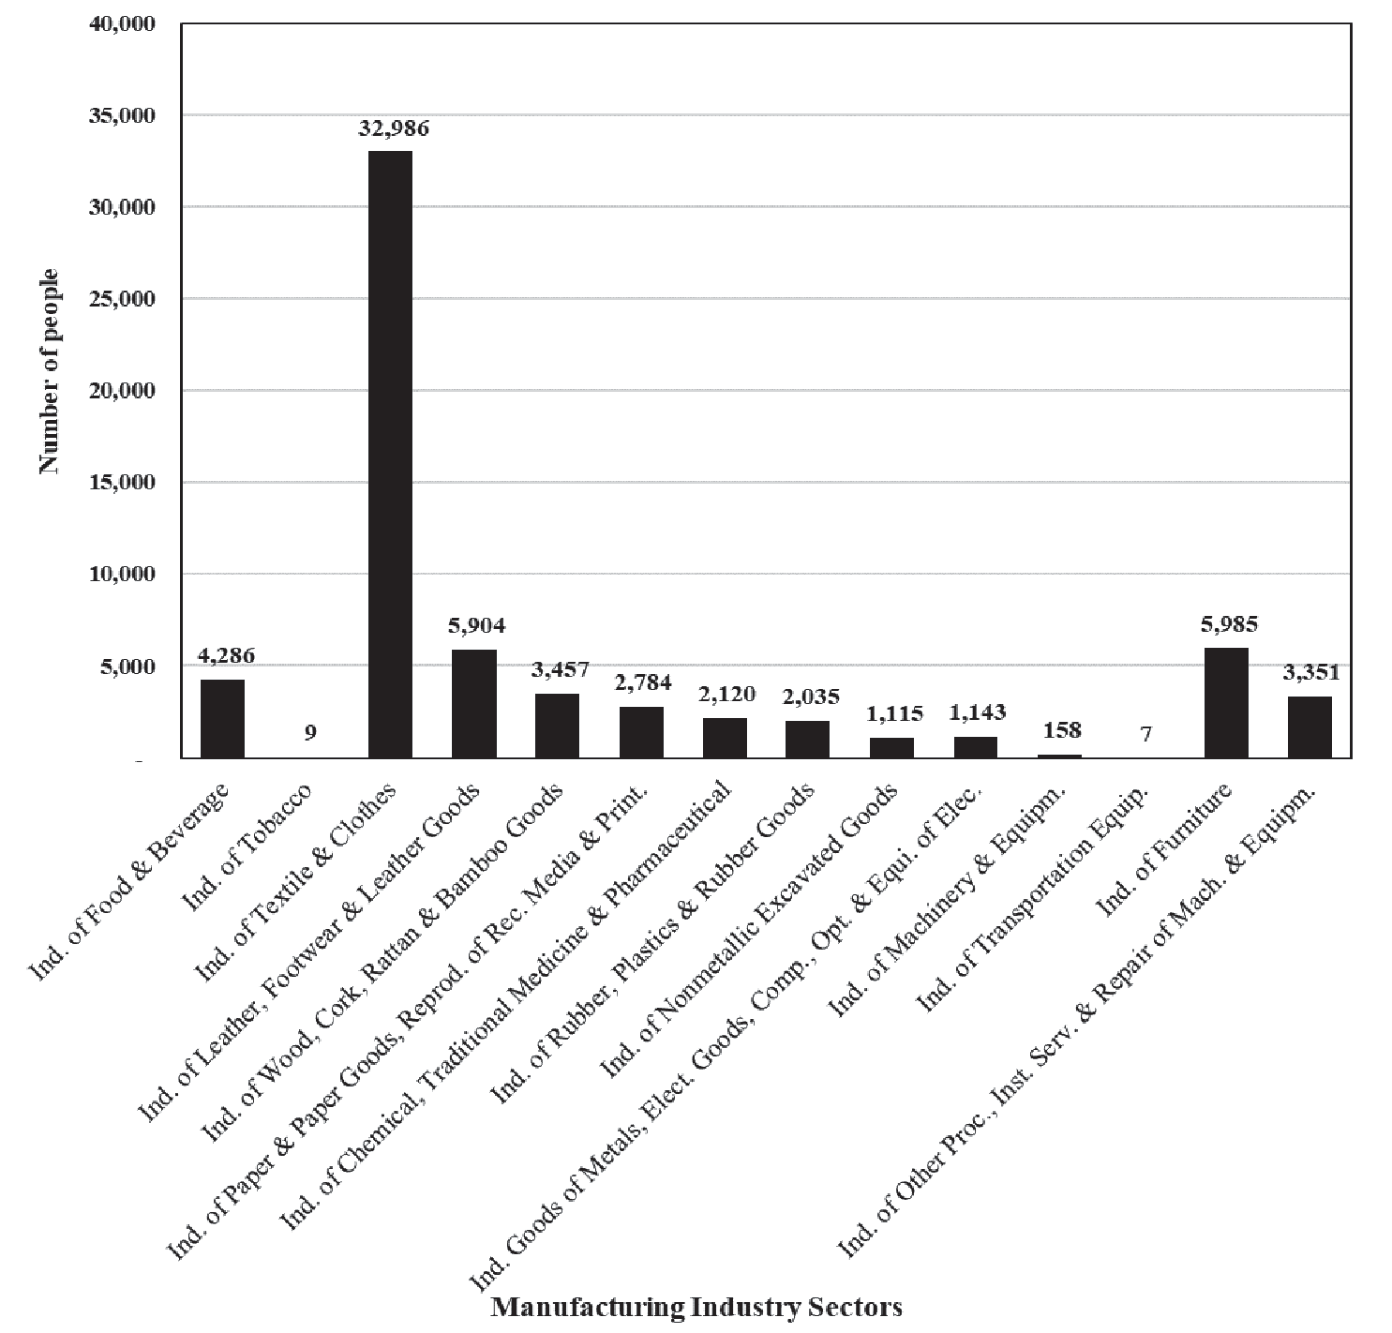
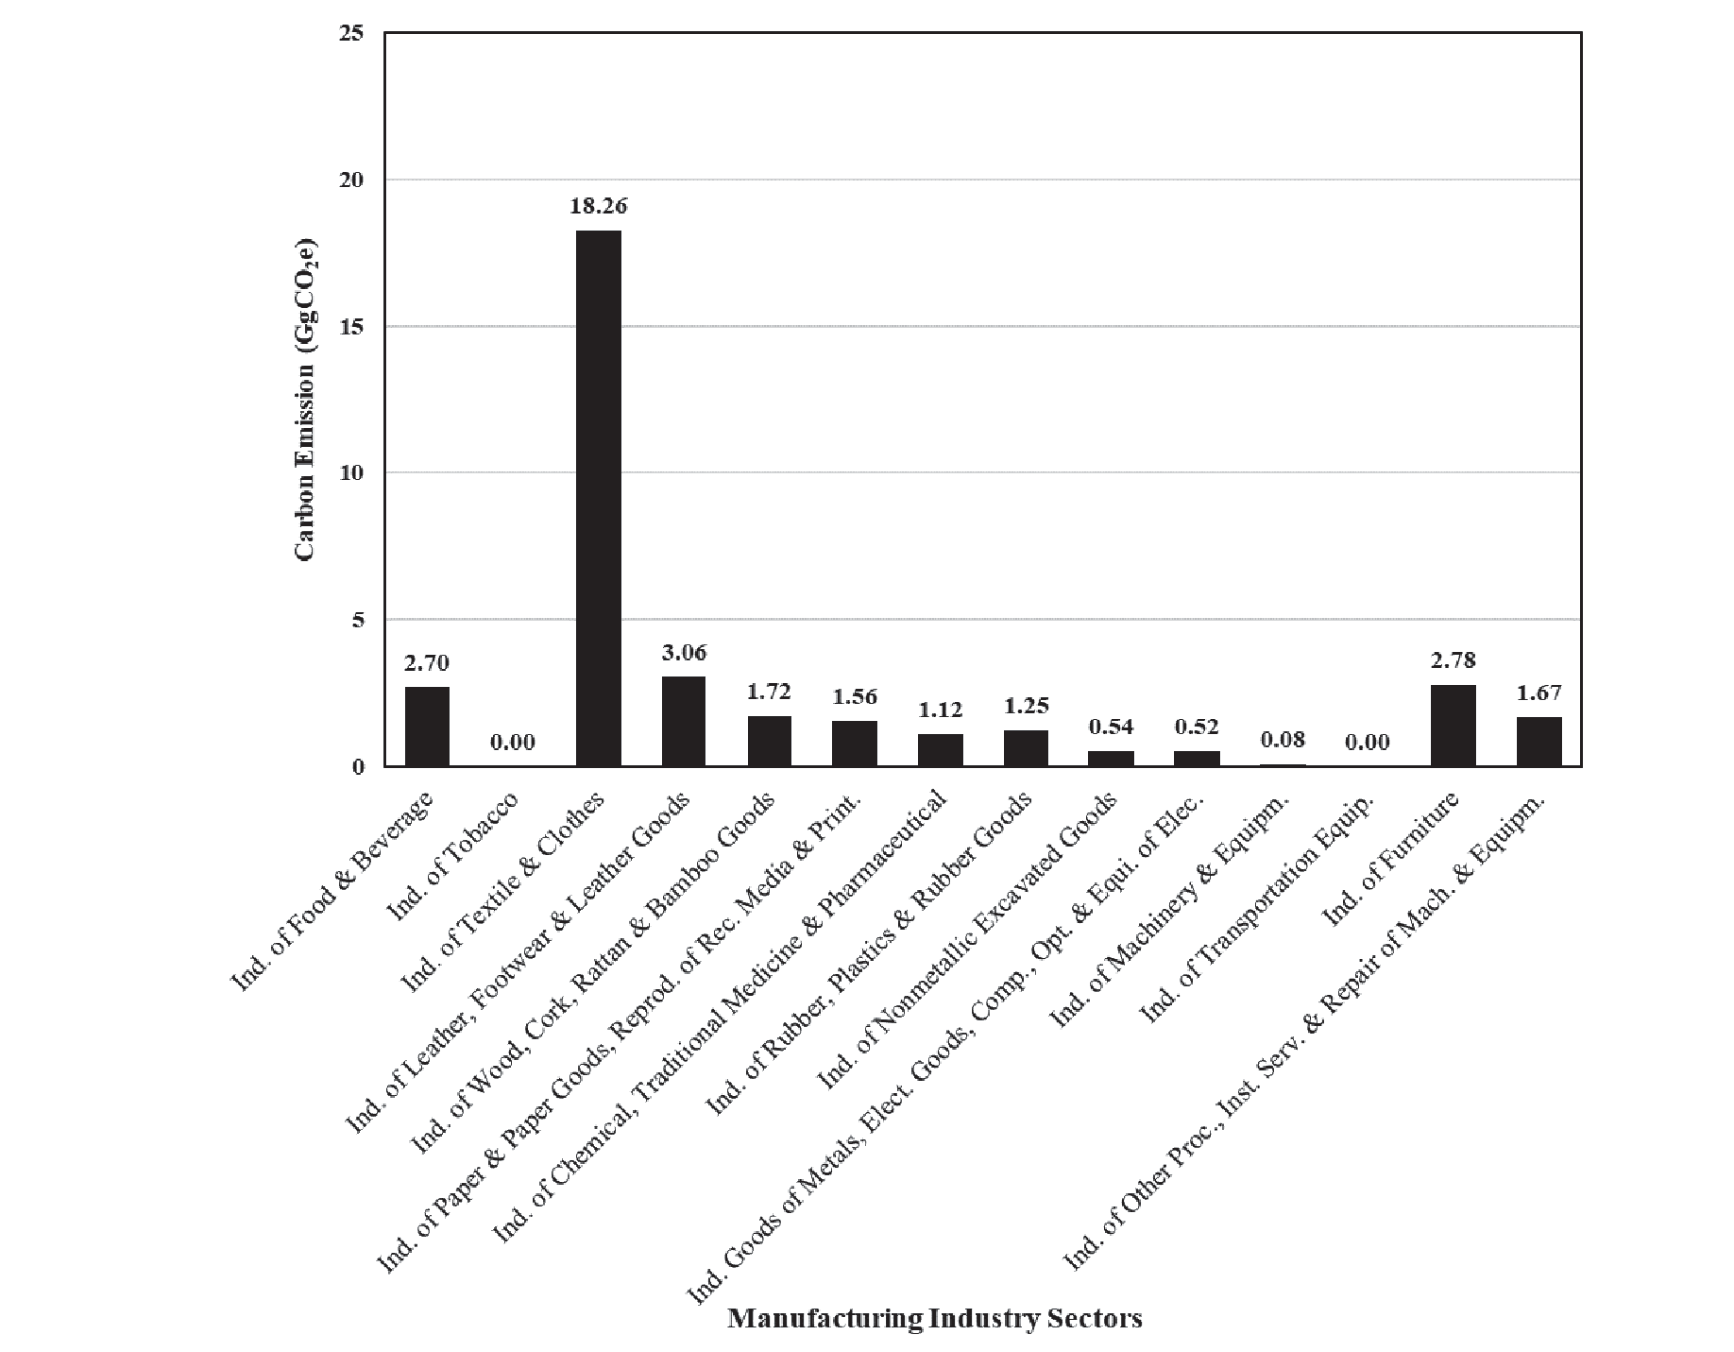
In this sub-section, it can be summarized that an increase in exports of IDR 7.905 trillion from the DI Yogyakarta region will, directly and indirectly, impact 14 manufacturing industry sectors in the creation of output of IDR 5,124,899.37 million, gross value added of IDR 2,013,120.44 million, and a workforce of as many as 65,340 people.
However, at the same time, CO2e emissions of 35.26 GgCO2e will arise. The five manufacturing industry sectors producing the most such values are Industry of Textile & Clothes; Industry of Furniture; Industry of Leather, Footwear & Leather Goods; Industry of Food & Beverage; and Industry of Wood, Cork, Rattan & Bamboo Goods.
A pattern reflects a unidirectional correlation between output values and emerging carbon emissions (Fig. 4). The greater the output produced by the manufacturing industry sector, the greater the emissions it causes. This might be because the greater the output produced, the greater the energy used in the production process, so that CO2e emissions are even greater. This pattern seems to be compatible with previous researchers’ arguments that there is a positive correlation between the growth of the economy and greenhouse gas emissions; the higher the growth of the economy, the greater the carbon emissions, especially in developing countries.
Calculation Results Of Type II with 3 Impacts:
Direct Impacts, Indirect Impacts and Induced Effects
This subsection will examine the impact of increasing exports projected in 2024 at IDR 7.905 trillion, and in this calculation of type II, we will calculate three impacts, namely direct impacts, indirect impacts, and induced effects, on 14 manufacturing industry sectors in the DI Yogyakarta region. Table 2 shows the calculation results of such three impacts; it can be seen that the creation of output from 14 manufacturing industry sectors is IDR 5,578,178.45 million. The 5 largest sectors are namely the Industry of Textile & Clothes of IDR 2,615,123.04 million, which will be followed by the Industry of Food & Beverage of IDR 690,785.34 million; the Industry of Leather, Footwear & Leather Goods of IDR 480,811.96 million; the Industry of Furniture of IDR 479,998.30 million; and the Industry of Wood, Cork, Rattan & Bamboo Goods of IDR 273,998.49 million. Table 2 also shows the direct, indirect, and induced impacts due to an increase in exports on the gross added value that the industry will receive. The table shows that the gross value-added generated from 14 manufacturing industry sectors is IDR 2,161,252.07 million. The 5 largest manufacturing industry sectors are namely the Industry of Textile & Clothes at IDR 986,330.29 million, followed by the Industry of Furniture of IDR 229,217.04; the Industry of Food & Beverage at IDR 201,608.00 million; the Industry of Leather, Footwear & Leather Goods at IDR 200,017.88 million; and the Industry of Wood, Cork, Rattan & Bamboo Goods at IDR 120,721.77 million.
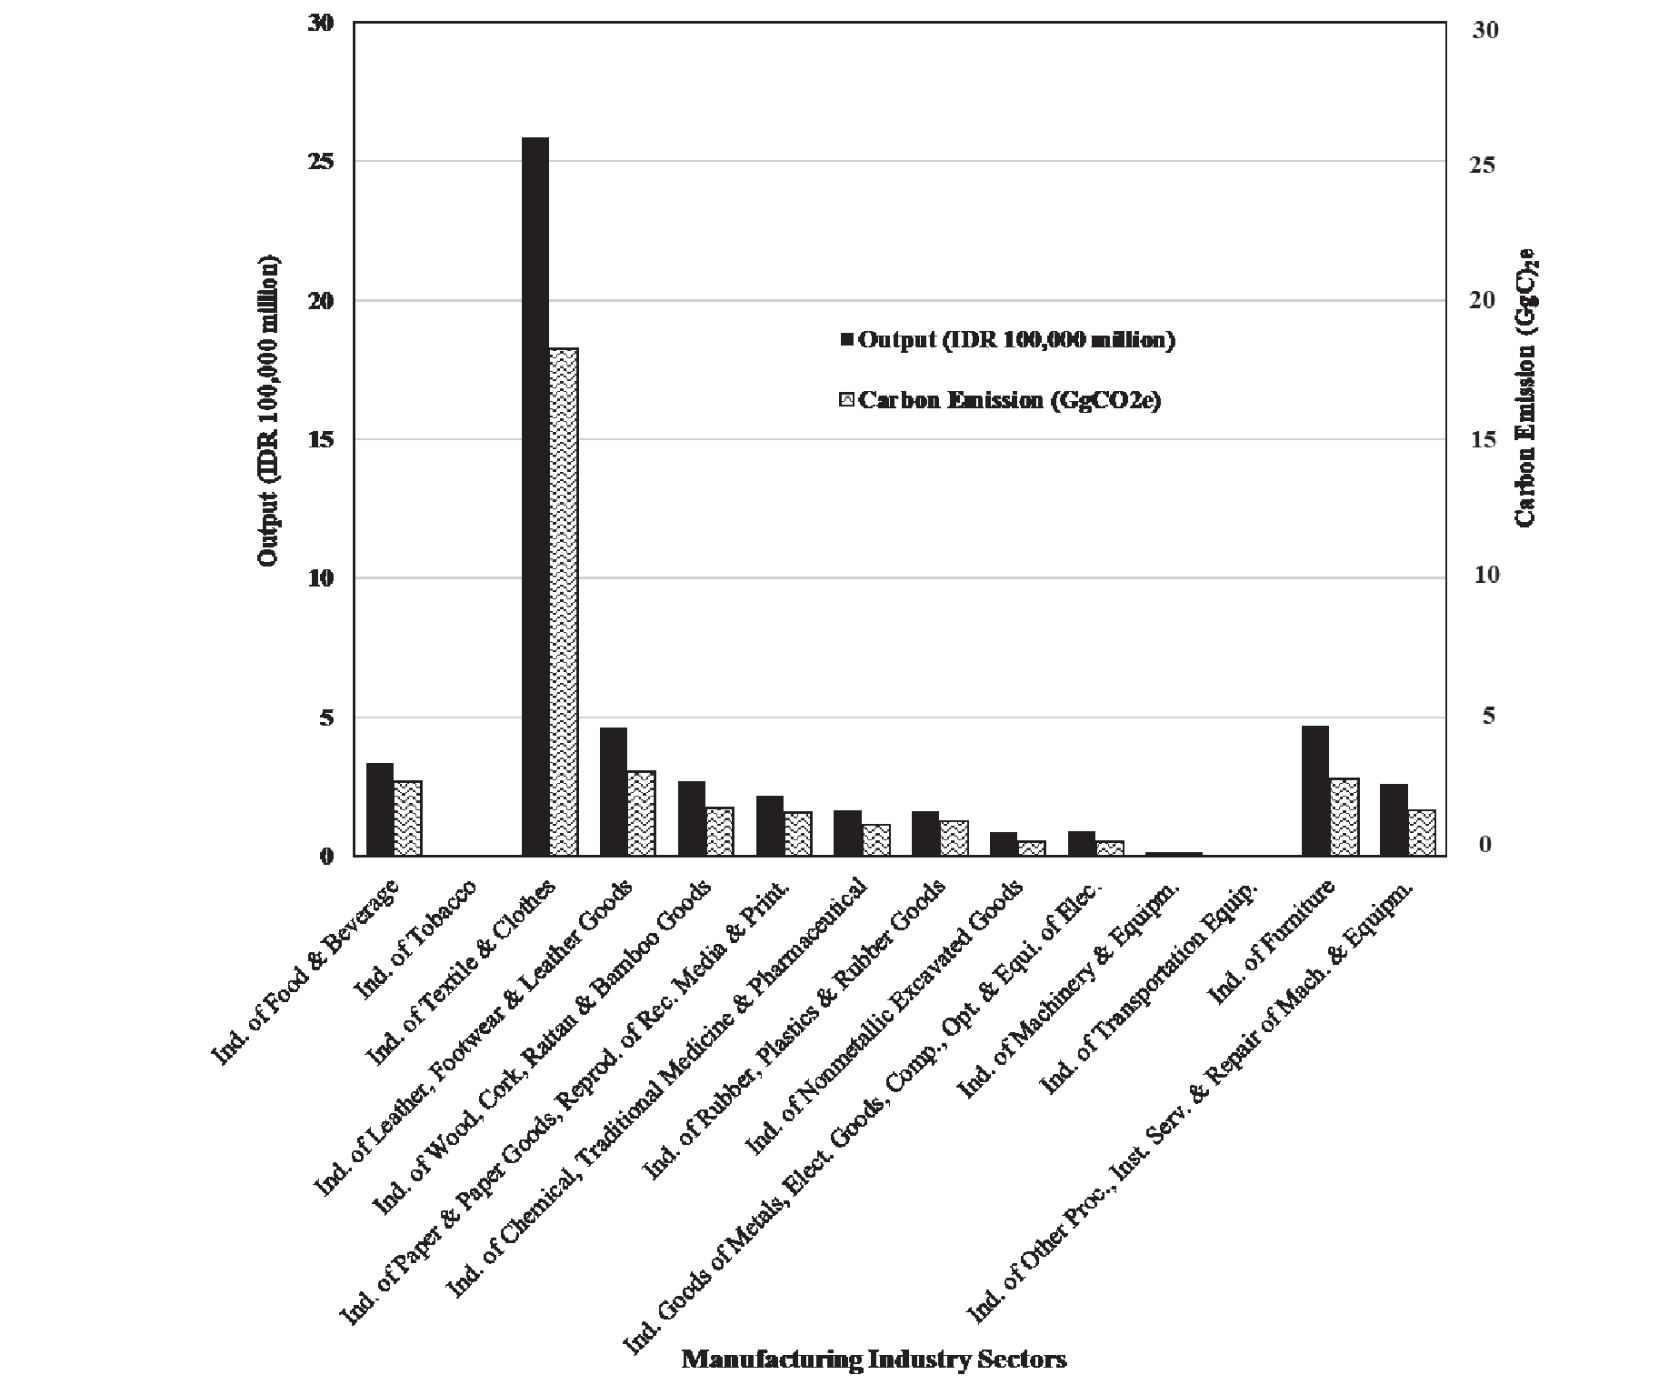
Table 2.
Calculation of Type II: direct impacts, indirect impacts and induced effects on output, and GVA.
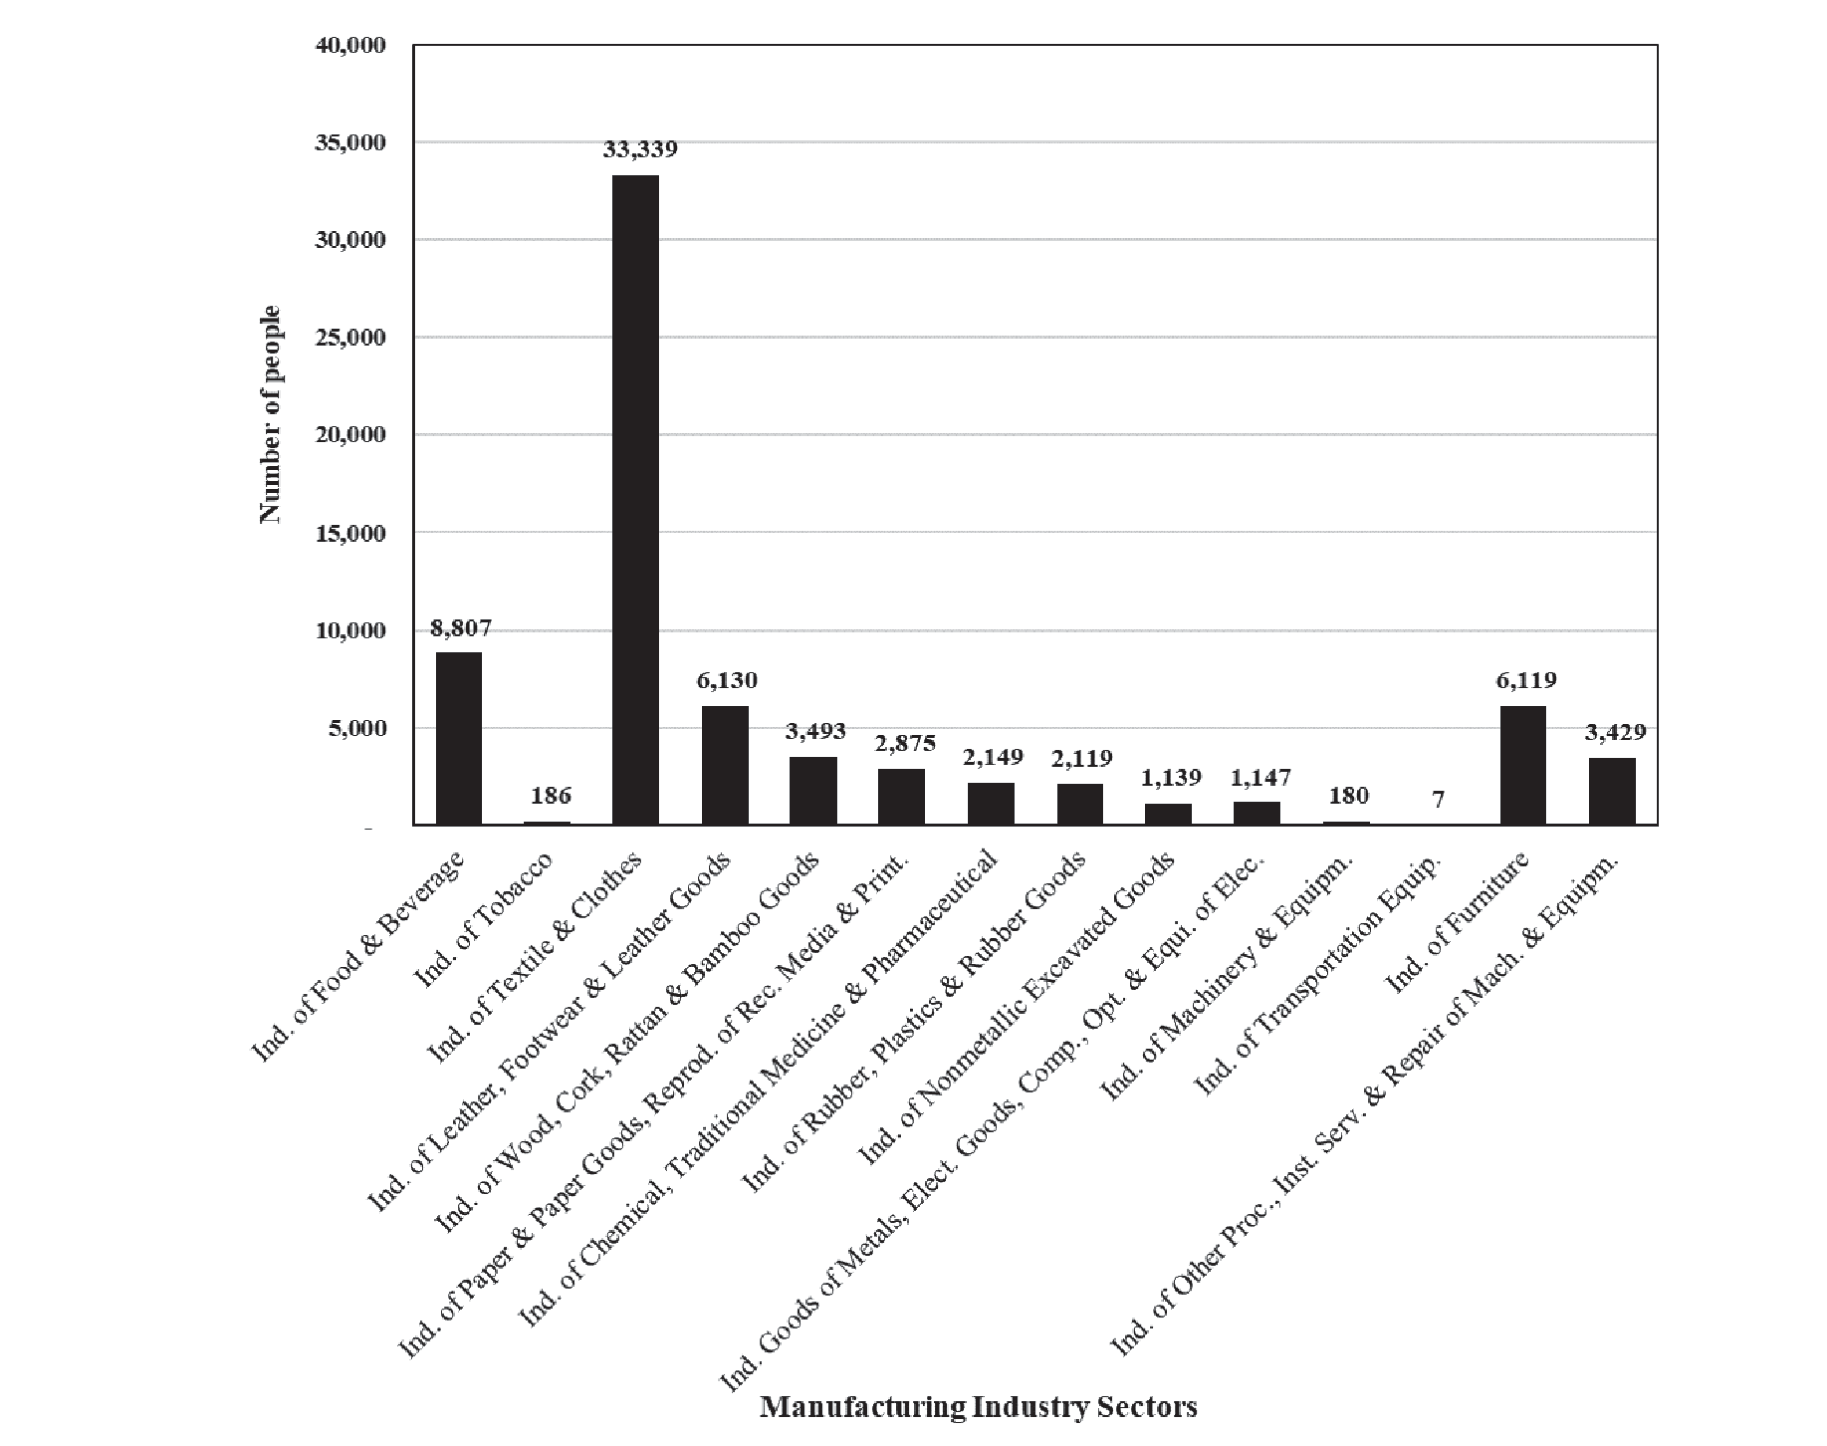
The results of calculation type II with three impacts on the workforce are shown in Fig. 5. The picture shows that the total workforce absorbed by 14 manufacturing industry sectors is 71,119. The five largest sectors are: the Industry of Textile & Clothes, as many as 33,339 people or almost 50% of the total; the Industry of Food & Beverage of 8,807 people; the Industry of Leather, Footwear & Leather Goods of 6,130 people; Industry of Furniture, as many as 6,119 people; and Industry of Wood, Cork, Rattan & Bamboo Goods, as many as 3,493 people.
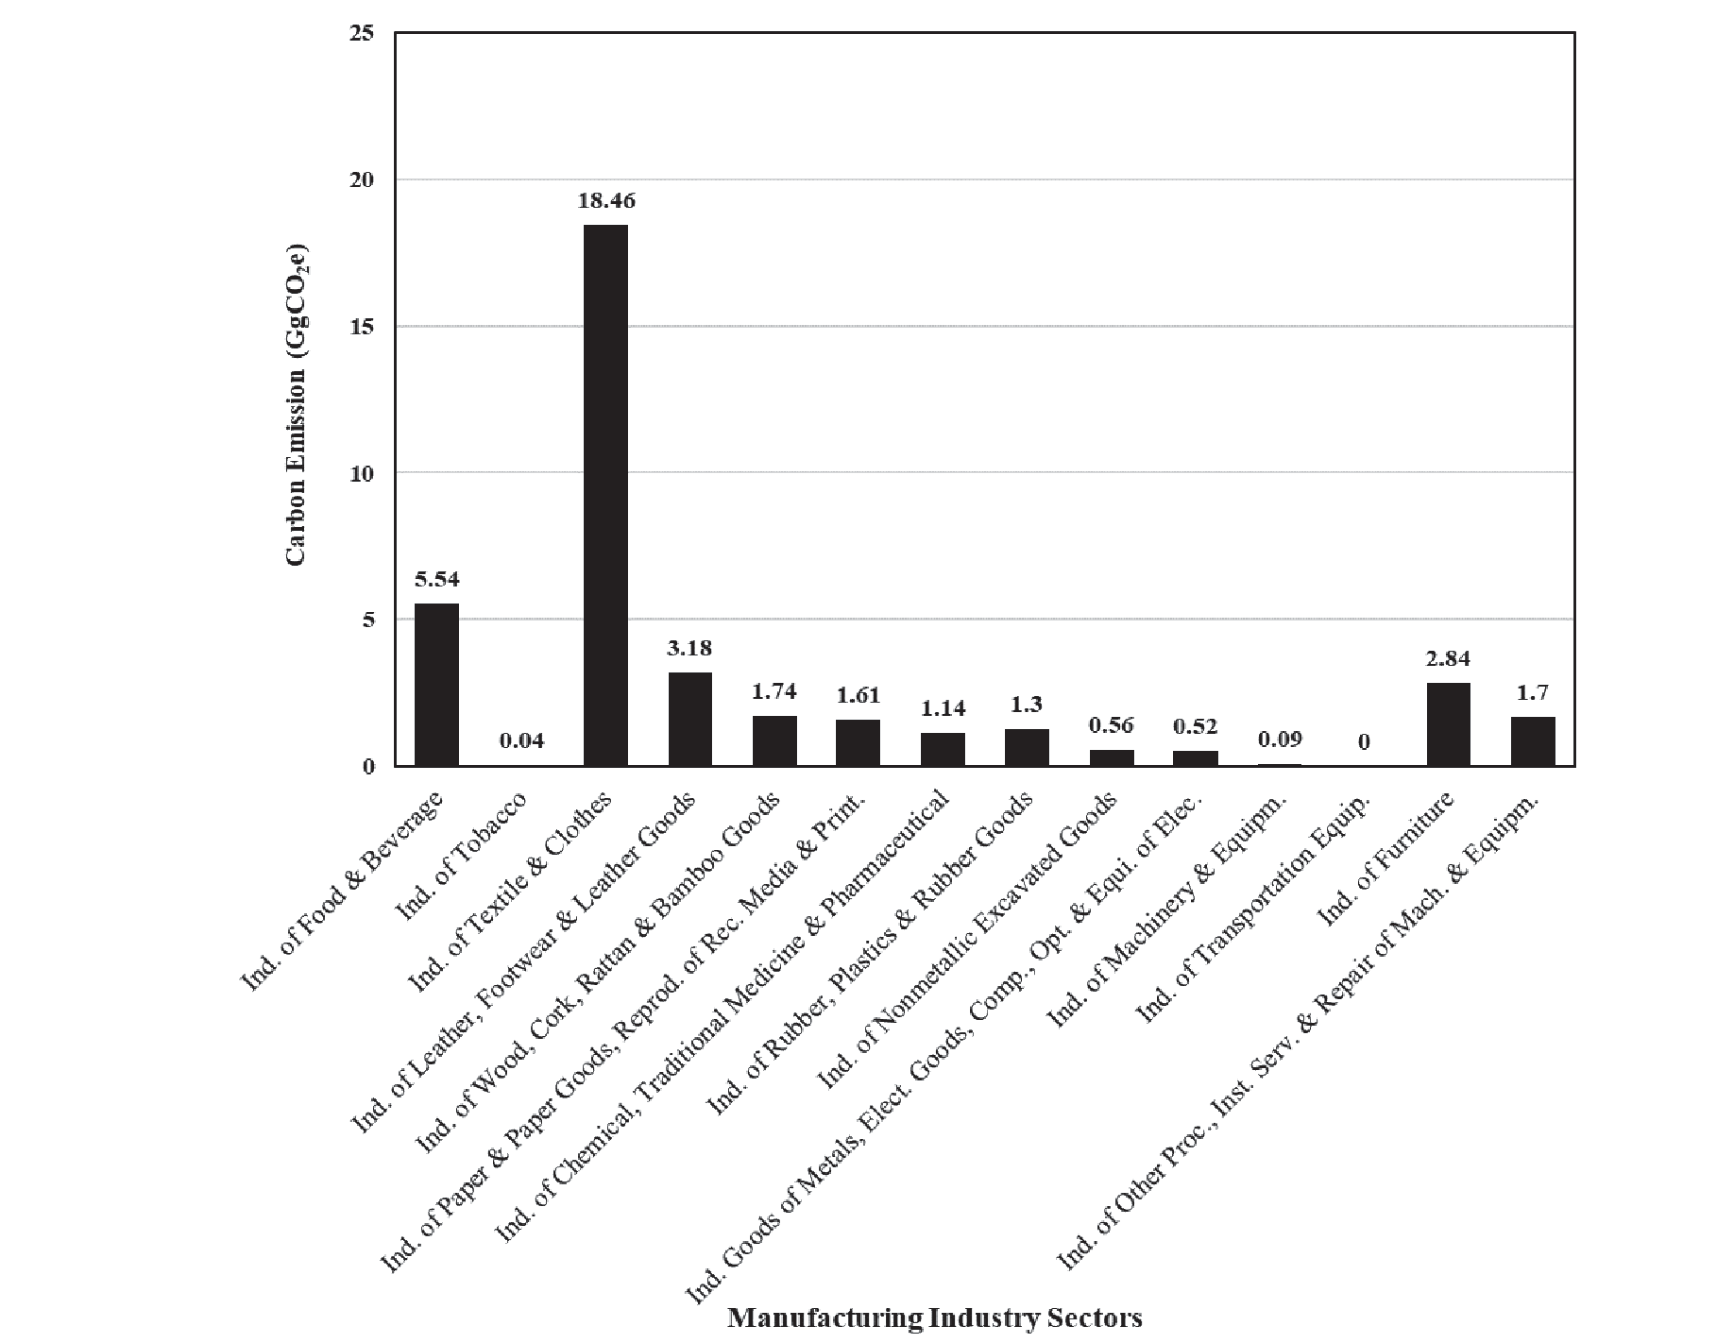
However, the calculation results also show that the impact on carbon emissions is reflected in Fig. 6. The figure shows that the total carbon emissions produced by 14 manufacturing industries, either directly or indirectly, as well as induced effects, amounted to 38.72 GgCO2e. The five largest sectors are namely: Industry of Textile & Clothes of 18.46 GgCO2e, which is the highest one; Industry of Food & Beverage (5.54 GgCO2e); Industry of Leather, Footwear & Leather Goods (3.18 GgCO2e); Industry of Furniture (2.84 GgCO2e); and Industry of Wood, Cork, Rattan & Bamboo Goods (1.74 GgCO2e).
The Covid-19 pandemic has badly impacted health and the socio-economy [33]. However, as mentioned before, the post Covid 19 export value of DI Yogyakarta economic sectors showed a significant increase. The export value in 2024 is projected to be around USD 527 million, or around IDR 7.905 trillion. An increase in exports of IDR 7.905 trillion from the DI Yogyakarta region will cause three impacts, namely direct impact, indirect impact, and induced effect (Type II) on 14 manufacturing industry sectors in the creation of output of IDR 5,578,178.45 million, gross value added of IDR 2,161,252.07 million, and a workforce that might absorb as many as 71,119 people. However, at the same time, CO2e emissions of 38.72 GgCO2e will arise. The five manufacturing industry sectors producing the most such values are Industry of Textile & Clothes; Industry of Furniture; Industry of Leather, Footwear & Leather Goods; Industry of Food & Beverage; and Industry of Wood, Cork, Rattan & Bamboo Goods.
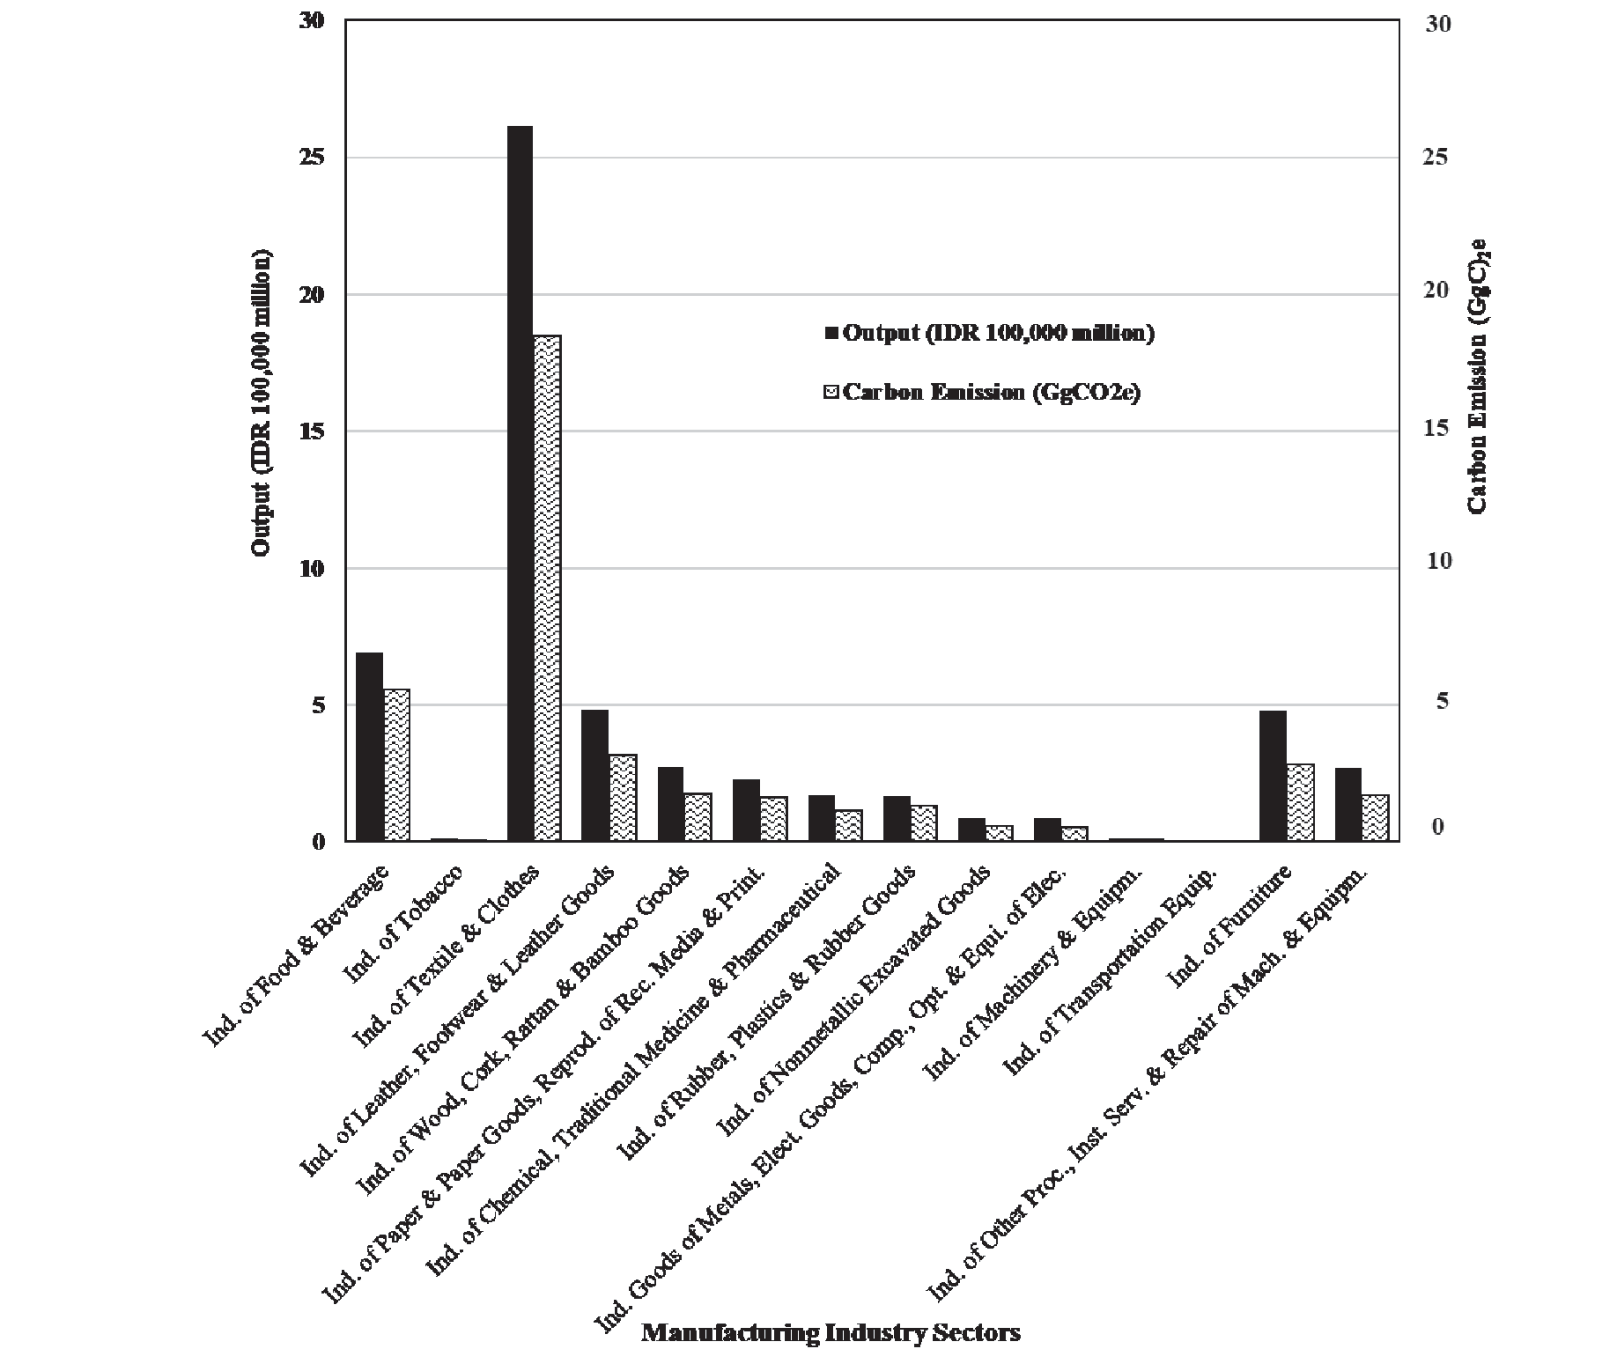
Likewise, for this calculation of type II, again, there is a pattern reflecting a unidirectional correlation between economic output and emerging carbon emissions. This result emphasizes a correlation between economic output and emissions of CO2e (see Fig. 7). This confirms the argument of some researchers that the growth of the economy has a positive relationship with industrialization and the emission of carbon, particularly in developing countries [1-2, 6, 8]. These results are also compatible with other scholars’ research showing that the development of economies has positive correlations with the incidence of greenhouse gases, albeit with different methodologies.
Mitigation of carbon emissions through the diffusion of clean technology innovations in the processing industry is very important. Technology development, including clean technology, might be produced by a conducive national system of innovation [34]. Therefore, the development of green industries, in parallel, must also be developed clean and efficient technology by strengthening the national innovation system. Tax policies might also be implemented to compel the manufacturing industries to adopt clean technology.
Another strategy that might be done in parallel with reducing greenhouse gas emissions is to use the principle of Low Carbon Development (LCD) for the physical development of the industry. Planning items such as building design, land cover, and water and waste management systems have implemented the principles of LCD [35].
Limitation
There are likely two things that cause this study to have limitations: limitations sourced from the data collected and assumptions from the input-output model itself, which still have pros and cons. The sector classification of emissions issued by the Provincial Government of DI Yogyakarta differs from the sectors’ classification in the input-output table. Therefore, it is necessary to first extrapolate the classification of emission data released by the DI Yogyakarta government to be equated with the classification of sectors in the input-output table. This might create uncertainty. Likewise, the workforce and projected data on exports of extrapolated goods and services also have uncertainty. Some assumptions in the output-input model might be a source of weakness. One of the assumptions of the input-output model is a constant return to scale, or that the relationship between output and input is linear. This means that each input unit into the production process will produce units of output linearly, when in reality, they are non-linear and cannot be substituted. Perhaps the implications of uncertainty are more complex than that [22, 24]. Thus, the interpretation of the results of the analysis must be done in the context of uncertainty. However, the benefits of this extended input-output model are still quite powerful as an analytical method that can calculate economic and environmental impacts in an integrated and comprehensive manner for regional economic development planning by considering the environment. In addition, the output-input table data and greenhouse gas inventory data are regularly issued by BPS-Statistics and the government. Therefore, this assessment can be evaluated regularly and easily.
Conclusions
It can be summarized that an increase in exports of IDR 7.905 trillion from the DI Yogyakarta region will cause three impacts, namely direct impact, indirect impact, and induced effects on 14 manufacturing industry sectors, in the creation of output of IDR 5,578,178.45 million, gross value added of IDR 2,161,252.07 million, and the workforce absorbed as many as 71,119 people. However, at the same time, CO2e emissions of 38.72 GgCO2e will arise. The five manufacturing industry sectors producing the most such values are Industry of Textile & Clothes; Industry of Furniture; Industry of Leather, Footwear & Leather Goods; Industry of Food & Beverage; and Industry of Wood, Cork, Rattan & Bamboo Goods.
Planning for developing 14 manufacturing industry sectors in DI Yogyakarta in response to increased exports should be better carried out because economic and environmental impacts can be predicted quantitatively with extended input-output methods. Therefore, the benefits of economic value can be achieved by increasing exports. Still, the impacts on the environment, particularly carbon emissions, can be planned to be mitigated gradually through the diffusion of clean technological innovations or carbon tax policies. So, efforts to develop a green industry as part of Indonesia’s commitment to achieve NZE by 2060 can also be carried out gradually.
This study also finds a pattern reflecting a unidirectional correlation between output values produced and emerging emissions of CO2e. This pattern seems compatible with previous researchers’ arguments that there is a positive correlation between the growth of the economy and greenhouse gas emissions; the higher the economic growth, the greater the carbon emissions, particularly in developing countries.

