

Introduction
According to the AR6 Synthesis Report: Climate Change 2023, during the period of 2011-2020, the global surface temperature rose by 1.1ºC compared to the pre-industrial era (1850-1900) [1]. Simultaneously, the integration of data, computing power, and the real economy has brought opportunities for transformative changes in production and lifestyle [2]. However, it has also posed challenges to sustainable development. As a major carbon-emitting country, the Chinese government has pledged to achieve carbon peaking by 2030 and carbon neutrality by 2060 (referred to as the “dual-carbon” goal). According to statistics from the Ministry of Industry and Information Technology, by the end of 2022, China’s computing power has reached 180EFLOPS, ranking second globally. At the same time, data centers consumed 216.6 billion kilowatt-hours of electricity (equivalent to the annual power generation of two Three Gorges dams), resulting in 135 million tons of carbon emissions (accounting for 1.14% of the national total emissions). It is evident that exploring the environmental effect of large-scale computing project such as National Supercomputing Center (NSC) and investigating underlying driving factors are of great significance for promoting the green transformation of computing infrastructure.
Existing research reveals the multifaceted impact of digital infrastructure on the environment. Proponents highlight its role in boosting production and energy efficiency [3-7], thus reducing carbon emissions through decreased per-unit energy consumption (known as the “substitution effect”) [8]. Furthermore, new digital infrastructure fosters innovation and accelerates industrial upgrades [3, 6, 9]. The digital economy’s growth also drives improved public sector environmental governance and promotes eco-conscious consumer attitudes [3, 5, 10]. Conversely, critics argue that digitization can pose a significant environmental burden [11-14]. The digital industry itself is energy-intensive [15]. While digital technology enhances productivity, it can lead to lower product/service prices, potentially increasing energy use through higher demand [5,16,17]. In summary, digitization’s impact on the environment follows diverse pathways, resulting in a complex, nonlinear, inverted U-shaped relationship, as seen in the literature [12, 16, 18, 20].
This article focuses on the environmental impact of NSCs, aim to examine their influence on regional carbon emissions and to clarify the driving factors behind the carbon emissions through intercity heterogeneity analysis. The by doing so, this study seeks to identify feasible measures for the green transformation of NSCs. Regarding the assessment about the environmental effect of digitization, existing research covers specific technological [8, 12, 14, 18], as well as the implementation of national-level digital infrastructure policies [3, 4, 10, 11, 13, 21-24]. Some studies have conducted comprehensive evaluations about the environmental effect of digitization using digital economy indices [6, 9, 16, 19]. However, there is still a need for further literature on the environmental impact assessment of large-scale computational (research) infrastructure project. particularly in systematically delineating the underlying drivers of carbon emissions for it.
Compared to the existing body of knowledge, this study’s marginal contribution and distinctiveness lie in the following aspects:
(1) It extends the evaluation of carbon emissions in digital infrastructure by incorporating computational power and explores NSC carbon emissions variations among cities, shedding light on pathways to greener computational infrastructure. (2) Existing literature highlights digitization’s positive impact on specific socioeconomic factors, supporting environmental sustainability. However, it often overlooks the energy consumption and structural issues within digital infrastructure itself. Building upon Berkhout and Hertin’s work [5], this study integrates direct and indirect effects within a comprehensive framework composed of energy consumption and energy structure.
(3) Treating NSC as a quasi-natural experiment, this study employs Quistorff and Galiani’s multiple synthetic control estimation method [25], which mitigates subjectivity in control group selection, overcomes traditional synthetic control method limitations, and provides robust statistical inferences beyond individual object assessments.
Research Foundation and Mechanism Framework
Direct and Indirect Effects of Carbon Emissions from Digital Technology
The distinction between the direct and indirect effects of digital technology on the environment can be traced back to the research by Berkhout and Hertin. They categorized the environmental impact of ICT into three types: direct effect, indirect effect, behavioral and structural effect, which goes beyond the traditional binary understanding [5]. Specifically, the negative impacts resulting from the production, use, and disposal of ICT devices are categorized as direct effect, while indirect effect include the productivity improvements brought about by ICT applications and the wider dissemination of related products (dematerialization). Structural and behavioral effect refer to the series of impacts ICT have on economic structure and demand behavior. Subsequently, the aforementioned categorization about environmental impacts of digital technology has also been termed as first-order effect (direct effect, the demand for materials and energy throughout the lifecycle of digital technology) and higher-order effect (indirect effect, the structural and behavioral effect) [17]. Similarly, this logical classification can be applied in the evaluation of carbon emissions from digital technology [7, 26].
It is worth noting that despite significant progress in understanding the complex relationship between digital technology and environmental sustainability, the categorization of direct and indirect effects varies considerably across different literature. In the study of Yi et al., they classify aspects including digital technology, industrial digitization, digital governance, etc. as direct impacts, while considering changes in energy structure as indirect impacts [27]. Wang et al. distinguish indirect effect into scale effect (added value of the tertiary industry), structural effect (energy structure), and technological effect (green patent), which aligns with the understanding of Zhang et al. and Dong et al. [6, 10]. Tang and Yang elucidate the direct effect of digital infrastructure on carbon emissions from the perspectives of energy consumption and environmental governance, while analyzing potential indirect effect from aspects like residential consumption behavior and energy factor allocation [11].
Among these studies, the works of Luan and He et al. stand out as the most typical examples. The former, contrary to Berkhout and Hertin, describes direct effect as the positive impacts robots directly bring to the environment, while portraying indirect effect as the negative consequences they generate [28]. The latter, similar to Berkhout and Hertin, characterizes direct effect as the increased electricity consumption due to digital transformation, while including a series of positive impacts as part of the indirect effect, including productivity enhancement, easing of enterprise financing constraints, and energy conservation [4].
Mechanism Framework
Based on the above analysis, two important premises can be summarized.
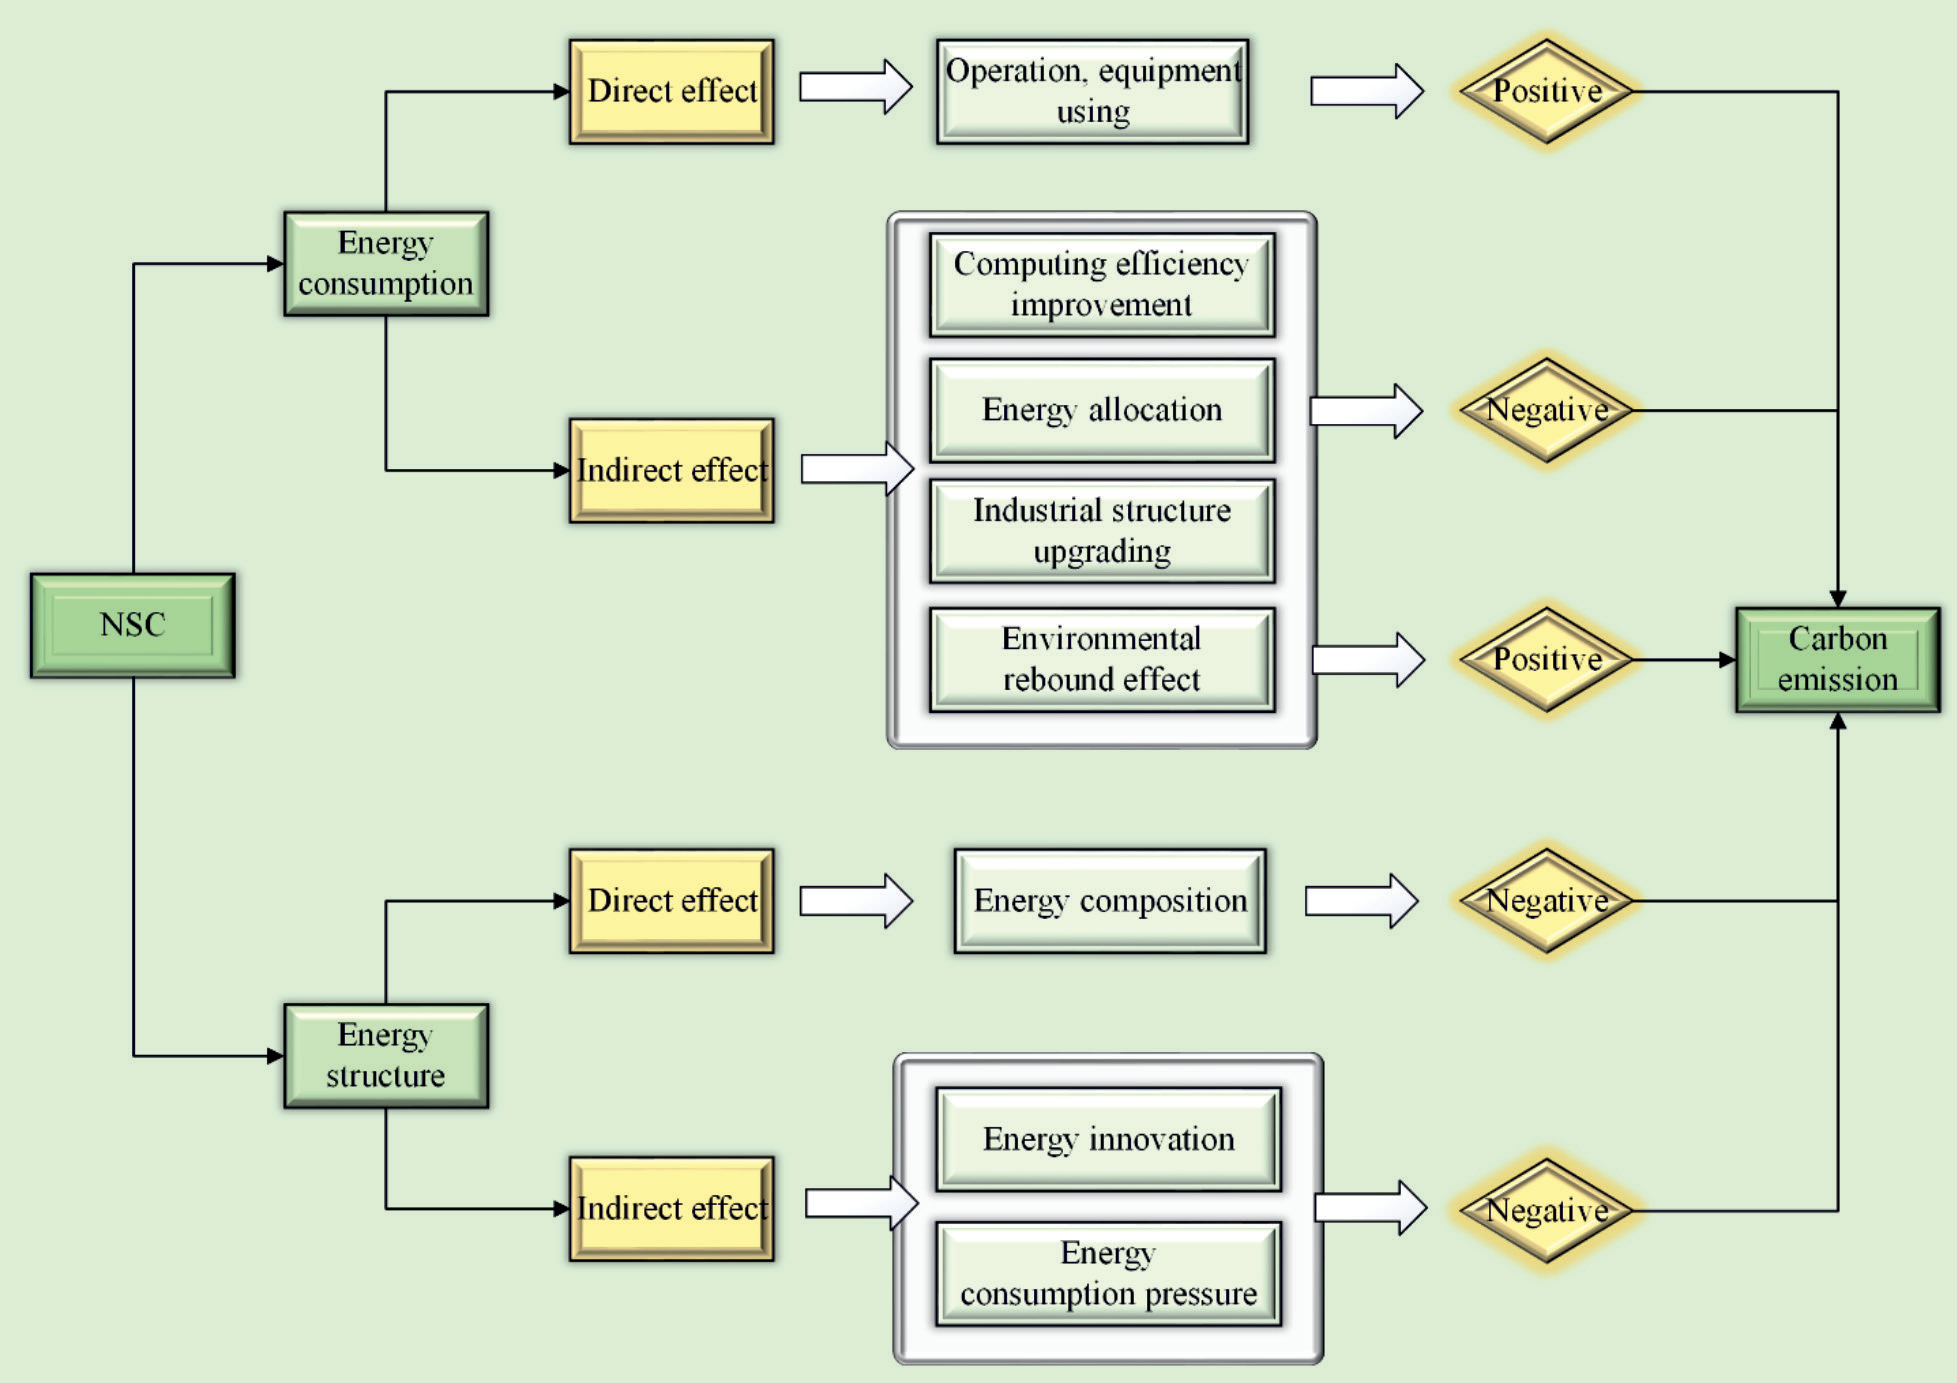
Firstly, the core factors through which digital technology affects greenhouse gas emissions are energy consumption and energy structure. Secondly, there is notable variation in the interpretation of direct and indirect effects in existing research. Hence, before constructing the mechanism framework in this study, it’s essential to clarify their meanings in the context of NSC’s impact on carbon emissions. this paper will explore the driving factors (mechanisms) behind the carbon emissions effect of supercomputing centers at the city level, focusing on the aspects of energy consumption and energy structure.
NSCs demand substantial electricity for data handling and high-performance computing tasks [29]. They also require power to maintain equipment and stable environments. In this study, we define the electricity used during NSC operations as direct carbon emissions. As for the indirect effect. Their supercomputers accelerate research and calculations, saving energy through optimized algorithms and parallel computing. NSCs offer digital services to local institutions, enhancing resource allocation, including energy. This transforms the regional industry towards high-tech, efficient, and cleaner production. Precise prediction and simulation improve energy allocation, reducing waste. However, better computing efficiency may boost demand in research and industry, potentially increasing energy use.
In terms of energy structure, regional carbon emissions linked to NSC construction depend on the local energy mix [30]. In simple terms, if coal and other non-clean energy sources dominate electricity generation during and after NSC construction, the supercomputing center’s power-intensive operation will increase CO2 emissions (direct effect). The indirect effect focuses on shifts in energy structure resulting from NSC. As mentioned earlier, NSCs support R&D, including clean energy technology development, like the joint CO2 electrocatalytic reduction project by Chengdu’s NSC and Chongqing University, aiming to convert CO2 into new energy products. Additionally, the NSC’s higher energy use can drive the region towards greener digital infrastructure. For example, NSC in Jinan established an “energy pool” with clean and renewable energy sources, such as solar and geothermal, to reduce the NSC’s environmental impact.
Based on the above, we have visualized the research mechanism of this study as shown in Fig. 1.
Material and Methods
Research Object
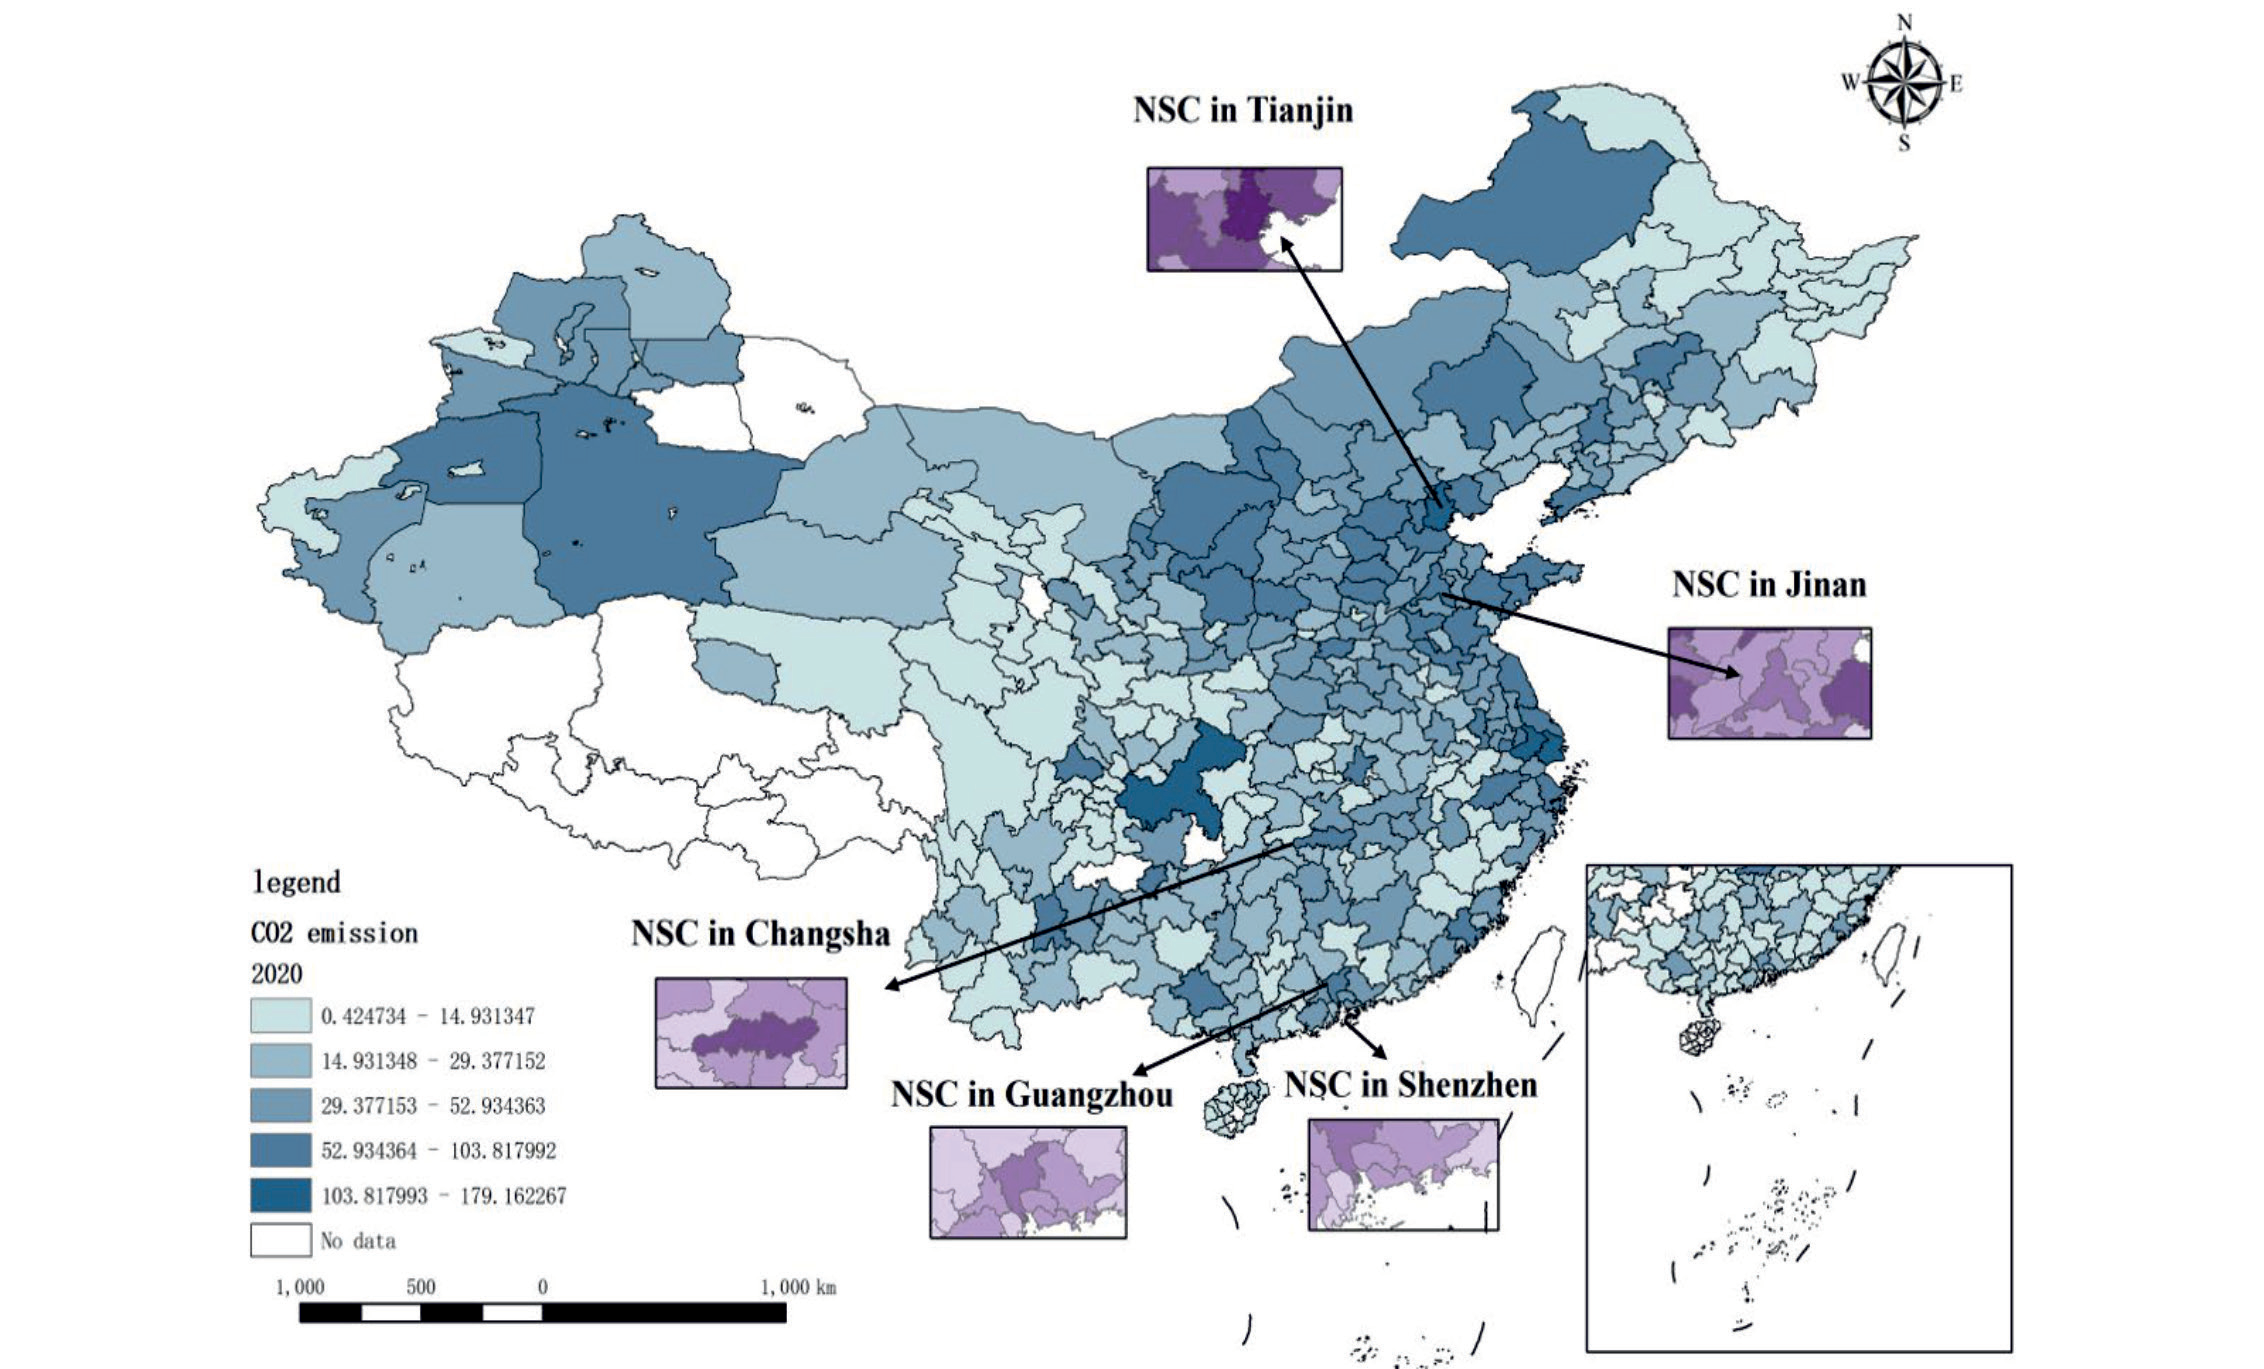
Since 2009, China has established nearly a dozen national-level NSCs in various cities, considering high-performance computing as vital for technological advancement. These NSCs, serving as hubs for innovation, utilize supercomputers for research in fields like physical chemistry, astronomy, climate meteorology, biomedical sciences, etc. While driving technological progress, they also contribute to local socio-economic development. Supported by national science and technology initiatives such as the “863” program, China has made significant strides in supercomputing over the past two decades. Considering the potential lag effect of NSC influence, This study focuses on five major NSCs established between 2009 and 2011 in Tianjin, Shenzhen, Changsha, Guangzhou, and Jinan. These NSCs employ supercomputers from the “Tianhe,” “Sunway,” and “Dawning” series, which have held leading global positions (https://www.top500.org/lists/ top500/). It should be noted that China’s supercomputers do not perform as remarkably in the Green500 rankings as they do in the Top500. The latest list in June 2023 showed that although China’s supercomputers occupied two seats in the Top500’s top ten, none of them appeared in the top 60 of the Green500 list. This indicates that there is still significant room for improvement in the energy efficiency of China’s supercomputers, which may lead to higher environmental costs.
As shown in Fig. 2 below, cities hosting national-level NSCs tend to have higher carbon emissions.
Methodology
In the evaluation of the environmental effects of digital technology, some studies use instrumental variable methods for identification [9, 11, 27], but obtaining accurate and unbiased estimation results places high demands on the selection of instrumental variables. To examine the impact of NSC construction on urban carbon emissions, this study treats NSC construction as a quasi-natural experiment and conducts the analysis within a causal inference framework. Currently, for the evaluation of exogenous shocks or policy effects, the most common approach is the difference-in-differences method [3, 10, 11, 13, 20-22, 24]. This method compares the sample that is affected by the shock or policy with the sample that is not affected to assess the impact of the shock or policy. However, a critical issue is how to choose an appropriate comparison sample. To overcome this problem, this study adopts the Synthetic Control Method proposed by Abadie et al. [31, 32]. This data-driven method fits a synthetic control group that closely resembles the treatment group based on multiple control units, reducing selection bias and endogeneity problems.
In the context of this study, we have data on the carbon emissions of K+1 cities over time t∈[1, T]. Among them, SitN represents the carbon emissions of the city i at time point t without NSC shock, and SitI represents the carbon emissions of the city i at time point t after the construction of NSC. If T0 is the year of NSC construction, when t<T0, SitN = SitI; and when NSC is constructed, i.e., t≥T0, ait = SitI – SitN represents the carbon emissions effect of NSC. For a specific NSC city, we can only observe the carbon emissions value SitI after the construction of NSC, and we cannot observe the carbon emissions value SitN when NSC is not constructed during the same period. This study uses the factor model proposed by Abadie et al. for estimation [31]:
In Equation (1), δt represents the time fixed effects that affect the sample cities, Zt denotes the observable predictor variables, λt is the unobservable (1×F) vector of common factors, μi is the (F×1) vector of unobservable city fixed effects, and εit is the short-term shock (unpredictable) with a mean of 0 at the city level.
Considering a city, i = 1, implementing NSC construction, while the remaining K cities have not conducted NSC construction. In pursuit of the outcome variables for region i unaffected by the influence of NSC, we designate K other cities as control units and employ a non-parametric weighting method to model the characteristics of the experimental group. Thus, Let W be a (K×1) weight vector defined as W = (w2, w3, ..., wK+1), where WK≥0, w2 + ... wK+1 = 1, and each W represents a virtual synthetic control combination, i.e., weights for the K cities. For NSC cities, W represents the synthetic control contribution rate of each city in the control group to the NSC city, weighting the outcome variables for each control city.
Assuming the existence of a weight vector W* = (w2*, w3*, ..., w*K+1) such that for t<T0,
Finally, the estimated value of the NSC carbon emissions effect ait is obtained as follows:
In the above equation, t∈[T0, T]. To overcome the limitations of the traditional synthetic control method regarding the number of treated units, this study employs the synth_runner program developed by Quistorff and Galiani in Stata. This program allows for the presence of multiple treated units and provides p-values for statistical inference [25].
Data Indicators and Research Process
Dependent Variable
Carbon emissions (million tons). This study aims to assess the carbon emission effect of NSCs; therefore, city-level CO2 emissions are chosen as the dependent variable. The intercity carbon emission data are sourced from China Emission Accounts and Datasets (CEADs, www.ceads.net/data/county), which calculates carbon emissions for various dimensions in China based on the consumption of fossil fuels in different industries multiplied by emission factors. The inventory encompasses emissions from 47 socioeconomic sectors, emissions related to 17 types of fossil fuel combustion and cement production processes. It adopts the carbon dioxide emission accounting method recommended by the Intergovernmental Panel on Climate Change [33]. Due to its advantages of consistent statistical calibration and strong continuity, this database is widely used in various research studies [3, 9, 27].
Mechanism Variables
Energy consumption and energy structure are important variables that drive the carbon emission effect of NSCs in this study. For the former, considering that the main energy consumption of national supercomputing centers is electricity (high-performance computing requires a significant amount of power to operate supercomputers and related equipment), this study selects the total industrial electricity consumption (hundred million kilowatt-hours) in cities as a representation of regional energy consumption. As for the latter, this study refers to the approach used by Liu et al. to measure the energy structure of a region by constructing a low-carbonization index of energy consumption [34]. The specific calculation process is as follows: First, the consumed energy is divided into three categories: coal, oil and gas, other energy consumption. The percentage of each energy category is denoted by α, β, and γ, respectively, and they form a three-dimensional vector E as a spatial representation. Second, the cosine values of the angles between this vector E and the vectors representing high-to-low carbon energy consumption (E01 = (1,0,0), E02 = (0,1,0), E03 = (0,0,1)) are calculated as follows: cosθ1 = α⁄(α2 + β2 + γ2), cosθ2 = β⁄(α2 + β2 + γ2), cosθ1 = γ⁄(α2 + β2 + γ2). By weighting the angles, the low-carbonization index of energy consumption is constructed:
Predictive Variable
In the context of carbon emissions and their influencing factors, IPAT model was first proposed by Ehrlich et al. in 1971, which suggests that environmental changes are the result of the joint impact of population (P), affluence (A), and technology (T) [35]. The equation is shown below:
Based on this theory, the STIRPAT model, introduced by York et al., further incorporates the concept of differential elasticity coefficients and random errors [36], which is widely used to analyze the relationship between human activities and environmental changes:
In this study, we consider several social and economic variables as predictive factors to ensure that the synthetic control group and the treatment group have similar carbon emission characteristics before the construction of NSC. These variables include annual average population (ten thousand people) and per capita GDP (ten thousand yuan) to represent urban population and economic scale respectively [3, 10, 16, 22]. Additionally, green patent grants and the ratio of fiscal technology investment to GDP is used as a proxy for urban technology level [3, 6, 27]. Furthermore, industrial structure and the values of the dependent variable before the NSC impact in each period are included as a predictive variable in the model [3, 6, 10, 27].
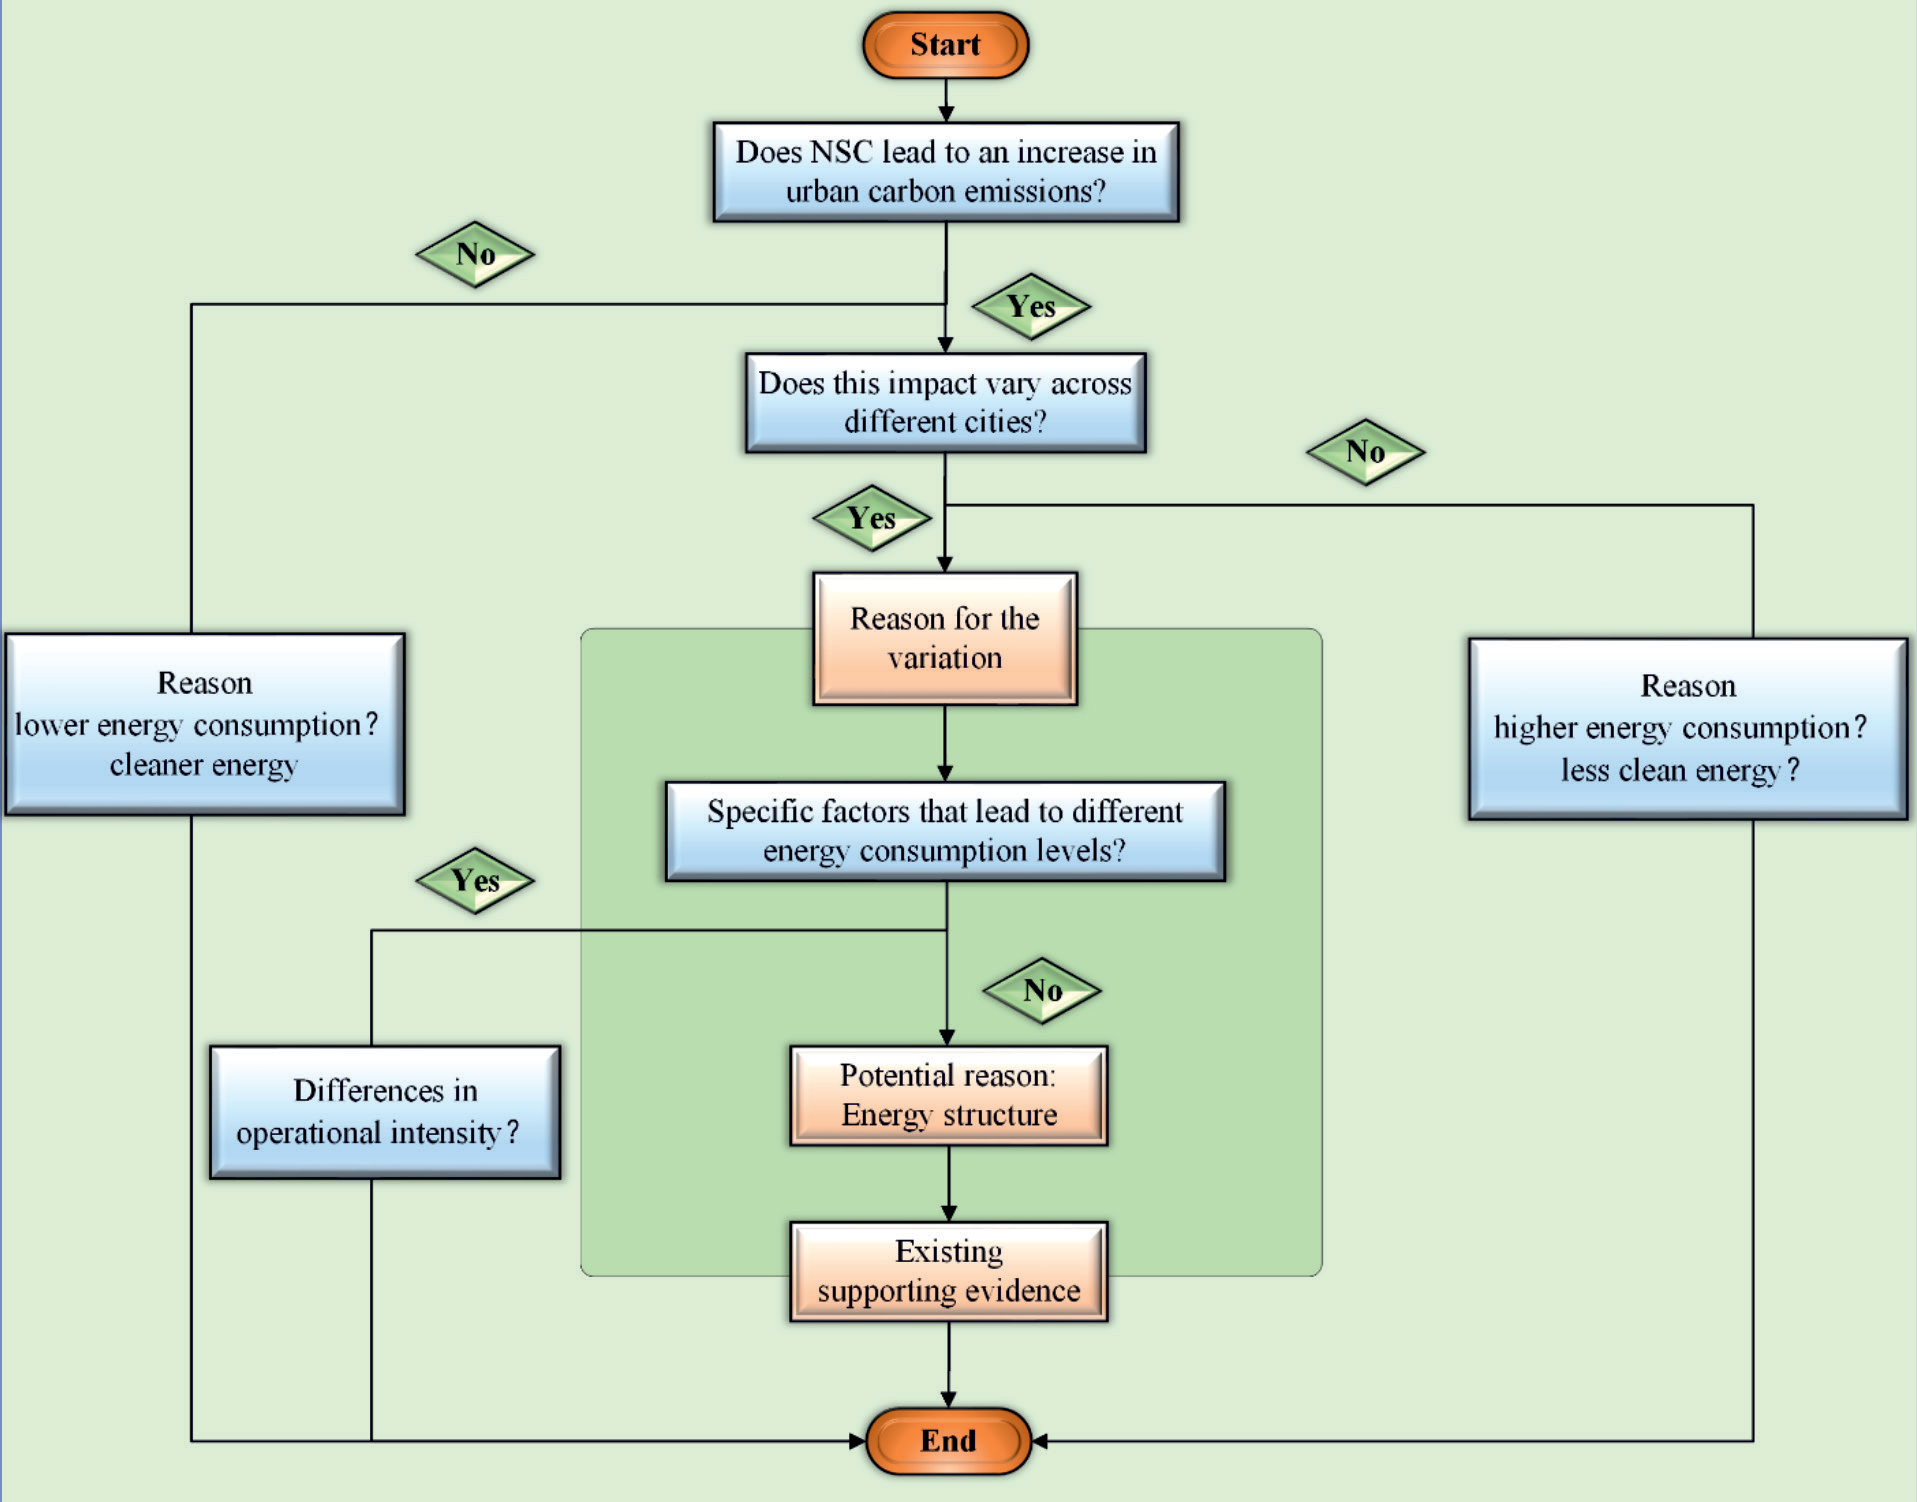
Taking into account that the Chinese Energy Statistical Yearbook is only updated until the year 2020, and prior to 2003, a significant number of cities have missing values in their predictive variables. Hence,this paper employs a panel dataset comprising Chinese cities from 2003 to 2020. Regarding data sources, urban green patent data is derived from the Chinese Research Data Services Platform (CNRDS). The carbon emission data is extracted from the CEADs database. Additionally, other data are obtained from the China City Statistical Yearbook and China Energy Statistical Yearbook. In the selection of the control group, to ensure comparability between the treatment and control groups, 70 large and medium-sized cities (excluding the NSC cities) are chosen as the control group. This list of cities is publicly disclosed by the National Bureau of Statistics of China (http://www.stats.gov.cn/sj/). Cities with later NSC constructions, like Wuxi and Chengdu, are excluded from the sample. For data processing, indicators including per capita GDP and year-end total population are logarithmically transformed, while some missing values for predictive variables are addressed through interpolation or replaced with the mean. The descriptive statistics of the data are presented in Table 1. To enhance the logical clarity of the empirical part in this study, we depict the flowchart of our research in Fig. 3, with the research procedure contingent upon the results of testing the current issues.
Results and Discussion
Baseline Test
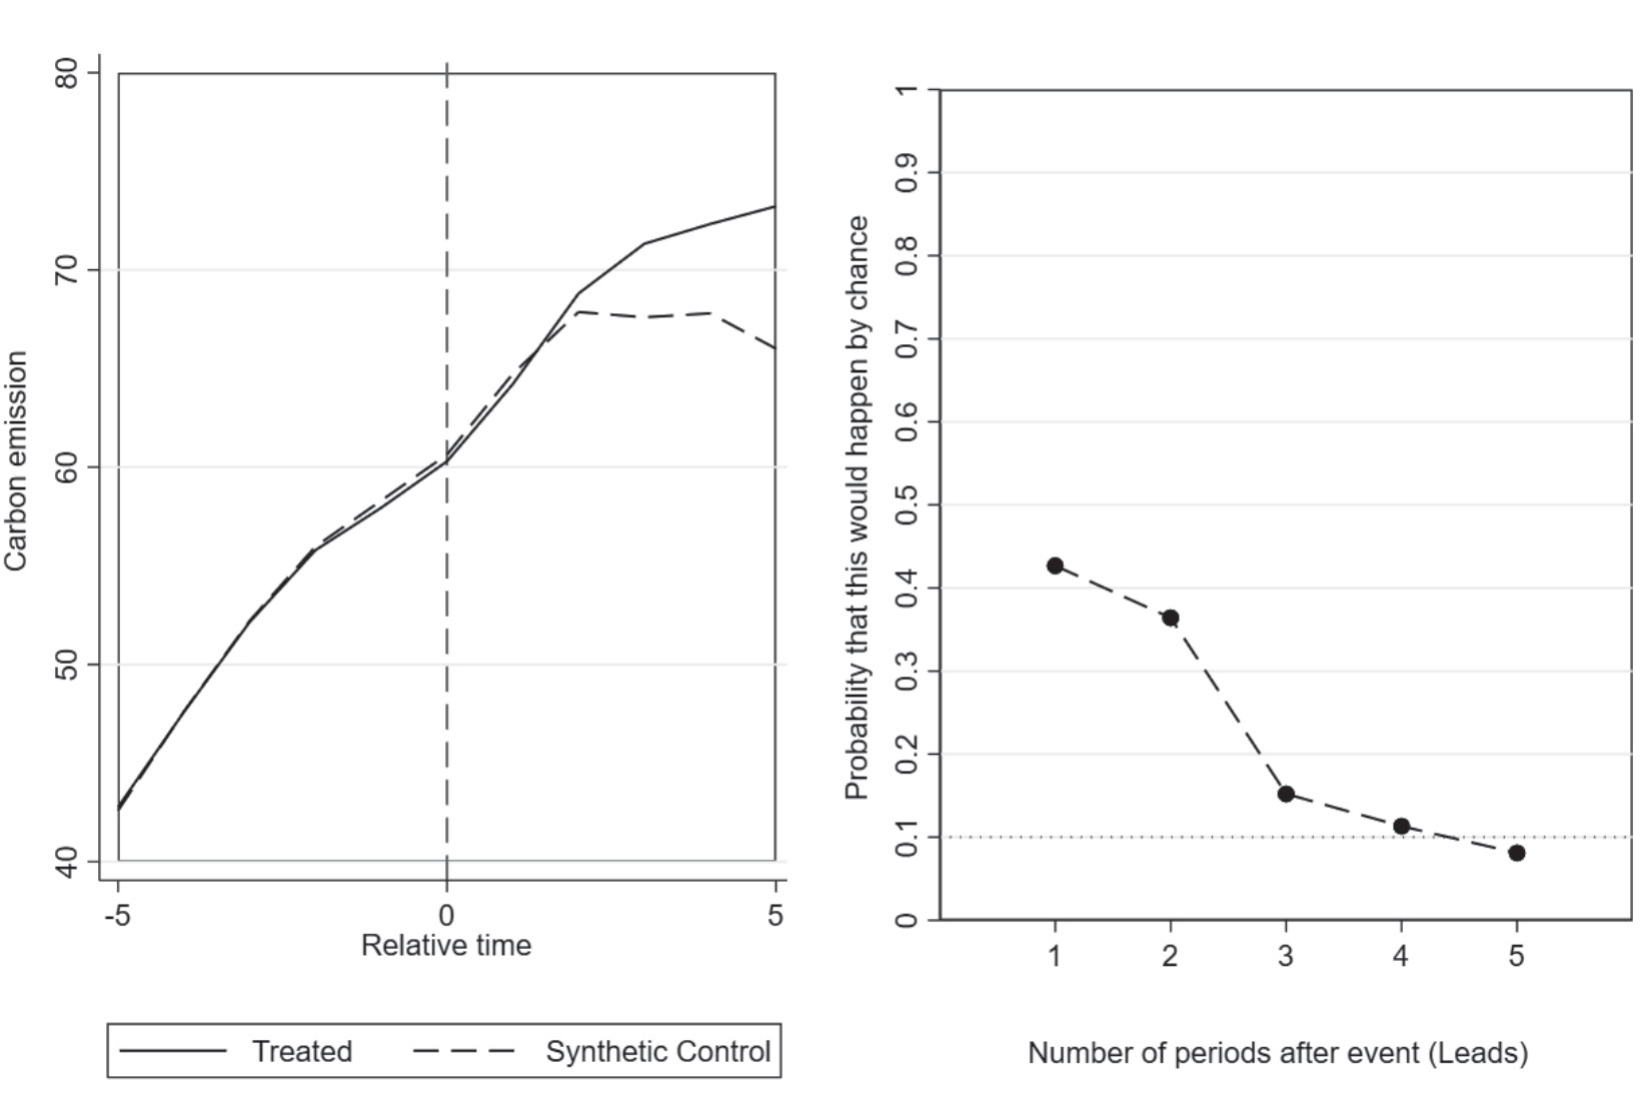
In this study, we first estimate the overall NSC carbon emission effect. As shown in Fig. 4, the solid line on the left graph represents the carbon emissions of the entire treatment group, including cities like Tianjin, Shenzhen, and Changsha. The dotted line reflects the synthetic control group’s CO2 emissions, which is weighted from the control group. The vertical dotted line represents the year when the computational infrastructure construction began. The left side of the dotted line indicates the carbon emissions trend of the treatment and synthetic control groups before the NSC impact. It can be observed that before the construction of NSC, the two curves nearly overlapped, indicating that the control group cities provided a good fit for the carbon emissions trend of the treatment group before NSC. However, starting from the second year of NSC construction, the carbon emission values of the treatment group cities show a significant increase compared to the synthetic control group cities. The difference between the treatment and control group cities increases over the years, reaching a peak difference of approximately 10 million tons. These results suggest that the treatment group cities experienced a significant increase in carbon emissions during the sample period, which we attribute to a strong association with the construction of NSC.
Table 1.
Descriptive statistics.
To further validate this conjecture, we conduct a placebo test following the approach of Abadie et al. to assess the robustness of the evaluation results [32]. In this test, we assume that cities in the control group also “implemented” NSC construction during the same period and constructed synthetic control groups for each city in the control group using the same method. We then calculate the carbon emission difference between the actual cities and the synthetic cities, considering it as the “effect” of “implementing” NSC construction for each city. Finally, we compare these placebo effects with the actual carbon emission effect of the real treatment group (cities like Tianjin, Shenzhen, Changsha, etc.). It is worth noting that the good fit between the treatment and control groups before the NSC impact is crucial for evaluating the treatment effect. Therefore, in this study, we use ten times the RMSPE value before NSC construction as the threshold to exclude estimates that exceed this threshold. Using the program developed by Quistorff and Galiani [25], we directly provide the P-values for statistical inference after conducting the placebo test, as shown on the right side of Fig. 4. It can be observed that the P-value for the treatment effect decreases to below 0.1 in the last period, indicating that to some extent, the NSC carbon emission effect is statistically significant (though only at the 10% level).
Heterogeneity Analysis
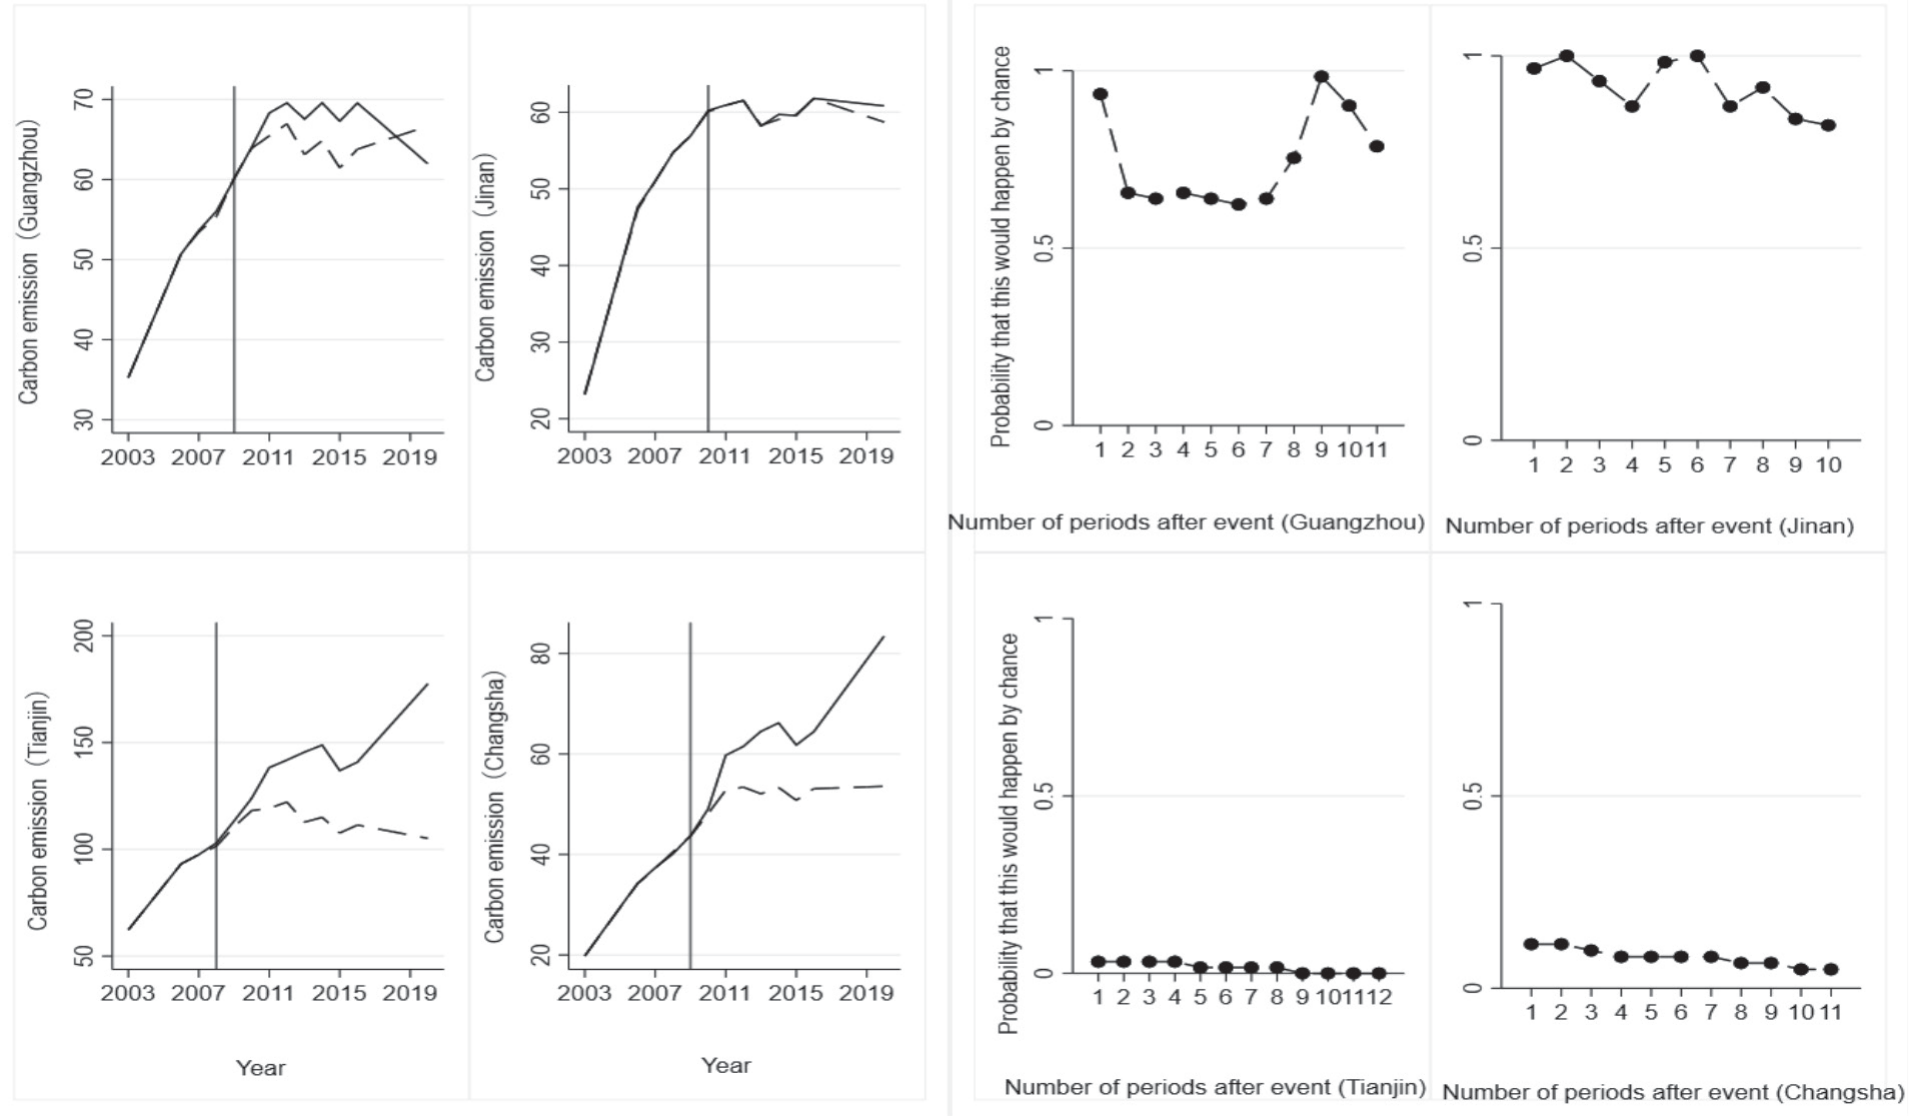
The results of the baseline test show that, the carbon emission effect of NSC construction is marginally significant, answering the question in the flowchart “Does NSC lead to an increase in urban carbon emissions?” At the same time, we also observe that the carbon emission effect is only statistically significant at the 10% level in the final period. Therefore, we move on to the second question in the study, “Does this impact vary across different cities?”. This aims to explore whether the marginally significant results are driven by the heterogeneous effects of NSC construction. In this study, we evaluate the carbon emissions effect of NSC construction in different cities, including Tianjin, Shenzhen, Changsha, Guangzhou, and Jinan. Based on the results, we divide them into two groups: “No carbon emission effect” and “Existence of carbon emission effect,” as shown in the top and second rows of Fig. 5, respectively.
Looking closely, cities like Guangzhou, Jinan, and Shenzhen do not experience a significant increase in carbon emissions due to NSC construction. For Guangzhou, although the difference in actual carbon emissions from the synthetic control group increases after NSC, the carbon emission effect is not statistically significant (as shown in the P-value distribution on the right side of Fig. 5). Similar results are observed for Jinan and Shenzhen. In contrast, both Tianjin and Changsha show significant carbon emission effects from NSC construction. As shown in the bottom part of Fig. 5 (second row), before NSC impact, the carbon emissions of the synthetic control group closely mimic those of the treatment group, indicating a good fit for the carbon emissions characteristics of the control group before NSC construction. After the NSC, the carbon emission difference between the treatment group and the synthetic control group rapidly widens in one to two periods and receives statistical support. The carbon emission effect of Tianjin’s NSC construction remains statistically significant at the 1% level, while Changsha’s carbon emission effect becomes statistically significant at the 5% level after the mid-term.
Carbon Emission Driving Factors Analysis
Energy Consumption
The heterogeneous impact of NSC construction on carbon emissions in different cities prompts us to inquire about the reasons behind the varying effects on environmental sustainability. As analyzed in section 2.2, substantial energy consumption is one of the main features of NSC construction and operation. To handle massive data and conduct high-performance computing, a significant amount of electricity is required to power the supercomputing centers. The efficiency gains in computations may also lead to environmental rebound effects, further increasing the overall energy demand. However, if the construction of supercomputing centers facilitates local industrial upgrading and green innovation, and optimizes algorithms during task execution, it can help reduce their own energy consumption and even decrease the region’s total energy consumption. Therefore, in this section, we aim to explore the heterogeneous impact of NSC construction on regional energy consumption and attempt to answer the question “Specific factors that lead to different energy consumption levels?” We use industrial electricity consumption as the outcome variable and conduct synthetic control estimations for each city, as shown in Table 2. The “Absolute Effect” represents the difference in carbon emissions between the treatment group and the synthetic control group, while the “Relative Effect” is the ratio of this difference to the carbon emissions of the synthetic control group. It can be observed that for Tianjin and Changsha, the two cities with significant NSC carbon emission effects, NSC construction also led to an increase in local electricity consumption. For Tianjin, the treatment effect is significant at the 5% level in the six to eight periods after NSC construction. The peak value indicates that compared to the synthetic control group, Tianjin’s total industrial electricity consumption increased by nearly 160 billion kilowatt-hours. A similar situation is observed in the evaluation of Changsha, with only differences in scale and significance.
Therefore, it can be inferred that NSC, by increasing local energy consumption, exacerbates urban CO2 emissions. However, interestingly, when we examine cities with “no carbon emission effects,” there were still differences in the results. On one hand, the results for Shenzhen and Guangzhou were similar to Tianjin and Changsha, where NSC construction significantly drove up local industrial electricity consumption. This implies that although NSC led to increased energy consumption in Shenzhen and Guangzhou, it does not exacerbate CO2 emissions in these regions. On the other hand, the synthetic control estimation for Jinan shows that NSC construction does not significantly increase local industrial electricity consumption. This may be related to the intensity and efficiency of operation at Jinan’s supercomputing center, or it could be attributed to the benefits of NSC in improving the city’s production and energy use efficiency. Overall, in this section, we discover that an increase in energy consumption is not a sufficient condition for the NSC carbon emission effect, as demonstrated by the results from cities like Shenzhen and Guangzhou.
Table 2.
The impact of NSC on urban energy consumption.
Energy Structure
Although the results of the analysis in section 4.3.1 suggest that the insignificant carbon emission effects of NSC construction in some cities may be due to the lack of significant increase in local energy consumption (as observed in Jinan), the estimation results for cities like Shenzhen indicate that the energy consumption scale is not a sufficient condition for significant NSC carbon emissions. In this subsection, we focus on the perspective of energy structure. In fact, some studies have emphasized the crucial role of energy composition in the cost of supercomputing environments [29, 30, 37, 38]. Even if a supercomputer center is more efficient, its green advantage will gradually diminish if it relies on a considerable share of non-renewable energy. Based on the analysis in section 2.2, we explore the role of energy structure from both direct and indirect effects. Let us now proceed with specific examples and data illustration.
(1) Direct effect
If a region has a higher proportion of clean energy in its energy structure, even if the operation of NSC leads to an increase in regional electricity consumption, the negative impact on the environment is expected to be smaller, provided that most of this electricity is produced from clean energy sources. Conversely, if the proportion of non-clean energy, such as coal, is high in the energy structure, the impact would be the opposite. To verify this hypothesis, we construct two major indicators: the proportion of coal and the low-carbonization index (as described in section 3.3.2), and match them with the corresponding cities.
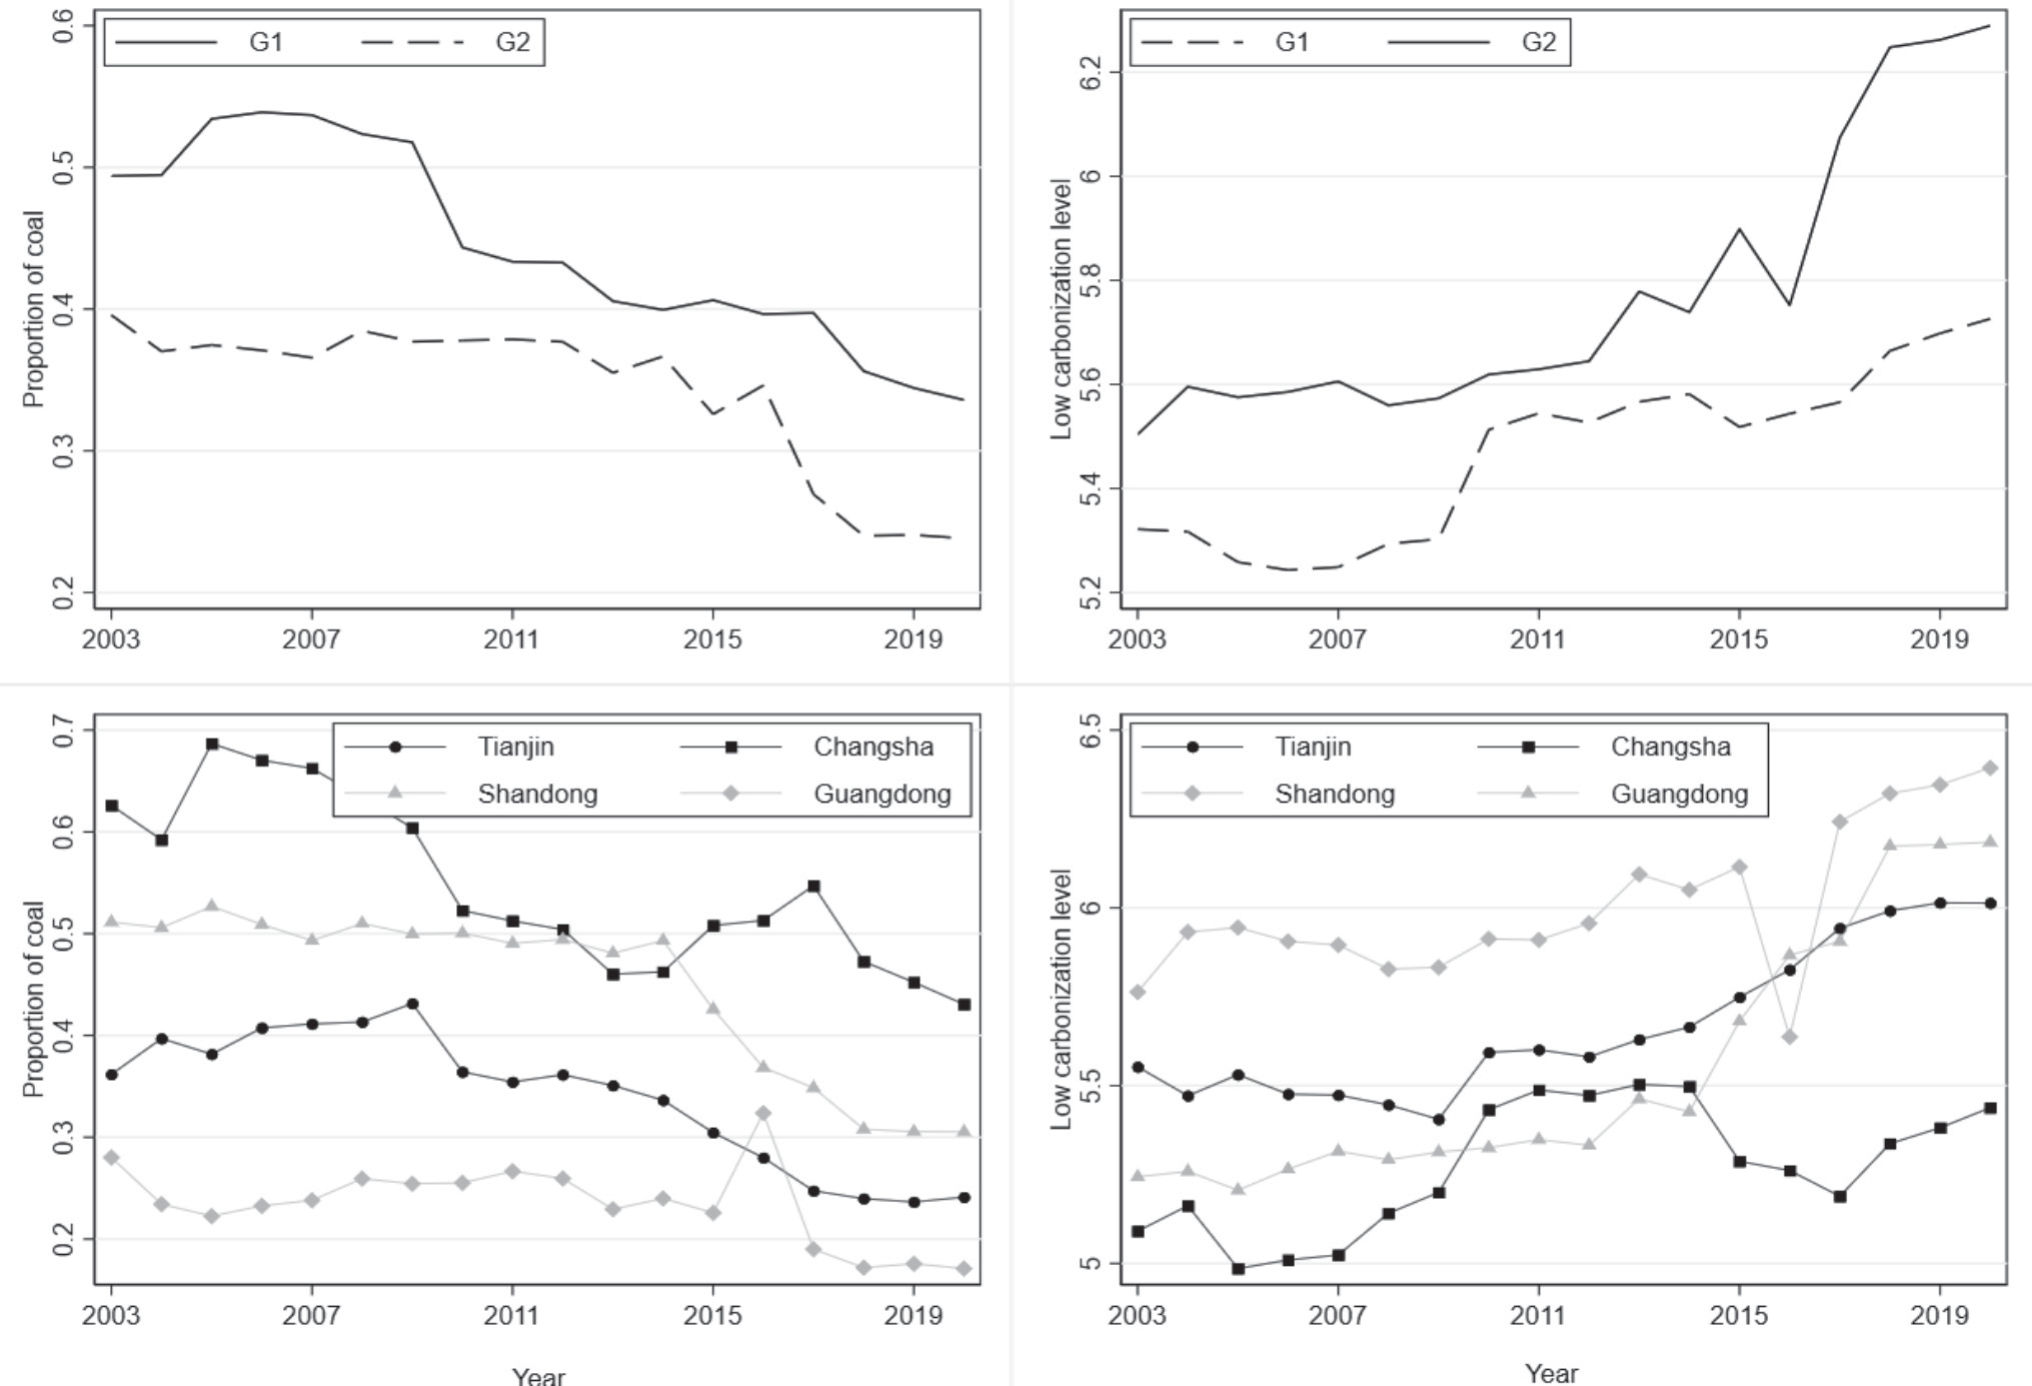
Using data from the China Energy Statistical Yearbook and converting various energy types into standard coal based on energy conversion coefficients, we obtain the proportion of various energy sources. As shown in Fig. 6, we divide the provinces into two groups based on the significance of NSC carbon emission effect: G1 (significant, consisting of Tianjin and Hunan) and G2 (insignificant, consisting of Guangdong and Shandong). It is evident that both before and after the NSC shock, the average coal proportion in G2 provinces is significantly lower than that in G1 provinces (with a peak difference of 15 percentage points). Similarly, the low-carbonization index in G2 provinces also has a significantly higher average compared to G1 provinces (with a peak difference of 0.5). The above results demonstrate that, despite NSC construction in Tianjin, Changsha, Shenzhen, and Guangzhou all leading to an increase in regional energy consumption, the carbon emission effects of Tianjin and Changsha supercomputing centers are significantly higher than those of the latter two cities. This is largely attributed to their higher proportion of coal in the energy structure.
In the lower part of Fig. 6, we can observe the specific evolution trend of energy structure in different provinces. It is evident that the coal proportion in Guangdong Province (covering Shenzhen and Guangzhou) is significantly lower than that of Hunan and Tianjin (conversely, its low-carbonization index is higher than the latter two). In fact, both Tianjin and Changsha are typical industrial cities in China. Tianjin is one of the birthplaces of modern industry in China, and industries such as automobile manufacturing, petrochemicals, metallurgy, and steel are dominant, leading to a high dependence on high-carbon energy sources. On the other hand, Changsha faces severe energy resource shortages, with over 80% of its energy needs being supplied from other regions, and its coal consumption proportion is particularly prominent. In specific data, in the year 2005, the coal proportion in Changsha’s energy structure reached 68%. Moreover, the average value of the sample period for coal proportion ranks first among the supercomputing cities.
(2) Indirect effect
The impact of energy structure on NSC carbon emissions is not only determined by the existing energy composition but also reflected in its indirect effects. In other words, NSC construction can also influence the energy structure, thereby affecting its own carbon emissions. Therefore, this study takes the low-carbonization index as the outcome variable and conducts another set of synthetic control estimations for each city. The results are shown in Table 3. Among the cities with “no carbon emission effects,” only the treatment effect of Jinan is statistically significant. On the other hand, for cities with “carbon emission effects” (Tianjin, Changsha), NSC construction also contributes to improving the urban energy structure. However, the magnitude of this effect does not reach the level of altering the fact of higher coal proportion in cities like Tianjin and Changsha. Therefore, it does not significantly reduce the environmental costs incurred by NSC construction.
Table 3.
The impact of NSC on urban energy structure.
Conclusions
Research Findings
As data and computing resources become deeply embedded in the real economy, it presents opportunities for high-quality socio-economic development, but also challenges in the fields of energy, environment, and climate. Existing literature has revealed the complex impact of digitization on the environment. On one hand, it can improve production and energy efficiency, promote innovation and industrial upgrading, thus reducing carbon emissions. On the other hand, the digital industry itself is energy-intensive, which may increase environmental burden and expand consumption demand through rebound effects, leading to an expansion of energy consumption. This study extends the assessment of carbon emissions from digital infrastructure to the computational level. Drawing on the research framework of direct and indirect effects based on energy consumption and energy structure by Berkhout and Hertin [5], we treat the construction of National Supercomputing Centers (NSCs) as a quasi-natural experiment. Utilizing the multiple synthetic control estimation proposed by Quistorff and Galiani [25], we examine the impact of NSCs on urban carbon emissions and explore feasible pathways for green transformation of computational infrastructure through the inter-city heterogeneity of NSC carbon emission effects. Specific research findings include:
(1) To a certain extent, NSCs significantly promote the increase in regional carbon emissions, but the carbon emission effects show inter-city heterogeneity. In some cities, NSCs do not significantly exacerbate local CO2 emissions. Existing research has explored various dimensions, including enterprises [4], cities [3, 10, 11, 13], regions [6, 9, 19], etc., providing positive impacts of digitization on environmental sustainability from multiple perspectives including digital economy [3, 6, 9, 19, 27], specific digital technologies (e.g., the internet, big data, artificial intelligence) [12, 15, 14, 28], and digital infrastructure [10, 11, 13, 20-24]. Consistent with the research results of Rao et al., Tang and Yang, and Wu et al. [11, 13, 20], we find that China’s National Supercomputing Centers have significant carbon emission effects. This is also in line with the conclusion of Bianchini et al. (2022) [12], who used EU data and found that the development of local digital technologies increased greenhouse gas emissions, with big data and computational infrastructure having the highest environmental costs. This study extends the investigation about the environmental effects of network infrastructure and integrated infrastructure, and further explores the perspective of computational infrastructure. The inter-city heterogeneity of NSC carbon emission effects provides a basis for exploring its driving factors in this study.
(2) Despite NSCs primarily contributing to the increase in local carbon emissions through the channel of elevated energy consumption, specifically industrial electricity consumption, the estimation results for cities like Shenzhen indicate that energy consumption is not a sufficient condition for significant NSC carbon emissions. In other words, although NSCs lead to an increase in energy consumption in these areas, it does not significantly promote a rise in local carbon emissions. Energy consumption is considered a crucial variable in evaluating the environmental effects of digital technologies, yet there is still no unified conclusion on whether digitization can reduce energy consumption. As a typical comparison, Wang et al.’s research demonstrates that digital transformation can lower electricity consumption and intensity through technological optimization and industrial upgrading [22]. However, in the study by Tang and Yang, digital infrastructure increased urban CO2 emissions by inducing a rise in per capita energy consumption, total energy consumption, and energy intensity [11]. The findings of this study complement this knowledge and confirm the significant electricity consumption caused by large-scale computational projects at the local level.
(3) The energy structure is a critical factor influencing the carbon emissions of NSC. This study finds that those supercomputing cities with significant carbon emission effects often have a higher proportion of coal in their energy structure (or lower low-carbonization index). Furthermore, we also discover that although NSC construction significantly promotes the improvement of low-carbonization levels in some supercomputing cities, this effect does not change the current situation of high coal proportion in cities like Tianjin and Changsha. As a result, it does not significantly reduce the environmental costs generated by NSC construction. The above findings further corroborate the assertion made by Allen that, concerning green performance, the energy attributes of supercomputing centers (supercomputers) may be more critical than their efficiency [30]. Research results by Van der Tak revealed that the carbon emissions of the Dutch supercomputing facility SURF are zero because it uses 100% green energy [37]. In contrast, estimates of the carbon footprint of the Max Planck Institute for Astronomy in Germany and Australian researchers captured the contribution of supercomputing to carbon emissions because both entities use non-clean energy to varying degrees [29, 38].
Practical Implications
Firstly, elevating energy efficiency and decreasing energy consumption. The research findings demonstrate that NSCs have markedly catalyzed an upsurge in carbon emissions. Mechanistic scrutiny further reveals that, excluding Jinan, the construction of NSCs in other cities has invariably led to a discernible augmentation in local energy consumption. Consequently, both the public sector and NSC operators should take steps to mitigate energy use. This includes optimizing hardware, choosing energy-efficient servers and processors, and implementing advanced energy management systems like Shenzhen’s “Upgrade and Replacement” project. Additionally, improving algorithms and task execution can reduce energy consumption in supercomputing centers.
Secondly, augmenting the proportion of clean energy and refining the energy structure. We find that, despite NSC leading to an escalation in urban energy consumption, it has not exacerbated CO2 emissions, as observed in Shenzhen and Guangzhou. This is largely attributed to the reduced reliance on non-clean energy sources in these cities. Therefore, in the future, drawing inspiration from the practices of the Netherlands’ supercomputing facility, SURF, there is an opportunity to further enhance the utilization of renewable energy sources in NSCs. Presently, the energy pool established by NSC in Jinan, comprising various clean energy sources like waste heat recovery, solar, and air energy, has been reported to contribute to an annual reduction of 21,600 tons of CO2 emissions.
Thirdly, expanding the spillover of knowledge and expediting regional emissions reduction progress. This study reveals that, whether in terms of energy consumption or energy structure, the contribution of NSCs to carbon reduction is relatively limited. Thus, improvements can be made from these two perspectives. On the one hand, NSC construction can foster urban sustainability through indirect effects on energy consumption channels, including enhancing computational efficiency, improving energy allocation capabilities, as well as promoting industrial structure upgrades. On the other hand, NSCs can collaborate with innovation hubs like universities and enterprises to provide computational support for green technology innovation, particularly in the realm of energy, thereby catalyzing the optimization of regional energy structures.

