

Introduction
In the rapidly developing contemporary society, the pace of people’s life and work is consequently accelerated and various stresses are increasing, which results in urban residents generally facing greater psychological problems and health risks [1]. According to the World Health Organization, fitness is no longer solely about precise physiological feature and absence of disease, but also about mental health and good social adjustment [2]. It has been proven that the herbal surroundings and inexperienced open areas such as parks and avenue inexperienced areas in cities can compensate for the fitness loss of residents and assist human beings enlarge their nice thoughts and hold a right mental power country [3]. As an important component of green infrastructure, urban greenspace is both a spatial carrier of urban ecological environment and an activity place for residents’ leisure and recreation, which is of great significance in promoting residents’ physical and mental health and enhancing urban vitality [4]. In this study, urban greenspace mainly refers to areas that meet the requirements of open space and present natural landscape features; and places that meet public needs and bring service values to urban residents, such as parks, scenic spots, greenways, and street greenspaces in cities [5].
As the largest urbanized region and the most economically active region in China, the Yangtze River Delta region plays a leading role in China’s economic development and urban construction. With the development of cities in the YRD region, the unrestricted expansion of land for construction has led to inefficient land use and the subsequent problems of traffic congestion, environmental degradation, and inappropriate land use, which in turn affects the physical and mental health of the local residents. Luo, Meng, and Li, Xia modelled the loss of forests in the YRD region in 2023 using GeoSOS-FLUS and found a significant reduction in the area of green space in the YRD region [6]. Chen Duozhang et al.. pointed out that the supply of land resources in the Yangtze River Delta region is facing two major problems: the supply of land space cannot meet people’s demand, and the use of urban space is unsustainable [7]. It is worth noting that urban green space, as an important hand to alleviate this series of problems, plays an indispensable role in improving the urban spatial layout and improving the urban habitat. Therefore, it is necessary to comprehensively assess the health benefits of green space in the Yangtze River Delta and then deploy appropriate improvement strategies.
In recent years, the relationship between people and their environment and the impact of large urban greenspaces on health has become a recurring theme in related fields such as landscape design, environmental psychology and sociology [8]. Current lookup on the fitness advantages of city inexperienced areas is broadly speaking centered on verifying the health-promoting consequences of recreationists’ environmental preferences, satisfaction, restorative evaluations. But location perceptions, and few pupils have explored the relationship between recreationists’ environmental preferences, area attachments, and fitness gain assessments. Therefore, this study focuses on place attachment and environmental preference, two important relationships between people and the environment, to explore the interrelationship between these two emotions and their influence mechanisms on environmental health benefits, and based on this, to propose urban greenspace design and management strategies based on a health perspective. At the same time, this paper explores the interrelationship and mechanism of motion amongst the three, and similarly clarifies the elements affecting the whole advantages of city inexperienced space. The evaluation index system of greenspace health benefits in Yangtze River Delta cities is constructed, so as to analyze and explore the level of greenspace health benefits and spatial differentiation pattern in each region of Yangtze River Delta. Provide reference for future planning, construction and management of the same type of landscape.
Related Concept Elaboration
Environmental Preferences
Environmental preference is a notion in environmental behavioral psychology that refers to an individual’s comparison of the preference rating for the exterior surroundings [10]. The Kaplans proposed in 1982 that environmental preferences consist of two dimensions, Understanding and Exploration, which contain the degrees of Immediately and Inference, respectively. In 1989, based on this research, the Kaplans further proposed the environmental preference matrix, which contains four landscape characteristics that influence environmental preference: coherence, readability, complexity, and mystery [11].
Coherence refers to environmental information that can be immediately perceived and understood, usually in the form of landscape elements that fit together in a logical way, making the image easy to organize, compose and understand. Legibility encompasses both comprehension and speculation, meaning that the spatial structure of the environment is clear and it is easy to identify directions and not get lost in the environment. Complexity refers to the abundance of landscape elements in the environment, both in terms of quantity and variety. Mystery means that the landscape environment stimulates the desire to explore and attracts visitors to go deeper to get more information and experience. People are more likely to have a strong preference for environments that have all four of these characteristics. People prefer natural environments, such as waterfalls, jungles, streams, etc., also because natural landscapes usually have the above four characteristics, and these characteristics trigger different psychological reactions that lead to environmental preferences. Even in man-made urban park environments, landscape places filled with natural elements are usually preferred [12].
Place Attachment
Place attachment is an important basis for the study of human-place relationships; people develop deep emotions, cognitions, preferences, and behaviors after prolonged exposure to a particular place, and this relationship of belonging and affiliation between the individual and the region is Place attachment [13]. Williams and Vaske proposed the classic Place Attachment Assessment Scale (APAS) [14]. Place dependence is the individual’s practical dependence on the place, such as the massive want for environmental landscape, public resources, and offerings in the place. Place identity is a kind of spiritual attachment, which is based on the individual’s perception, memory and impression of the place, and is expressed as the individual’s feel of belonging and emotional attachment to the place. Place attachment causes individuals to view the place as a part of the self, and being there gives individuals a sense of security, enhances self-identity, and increases positive emotions. Both environmental preference and place attachment are interactions between individuals and their environment, and environmental preference, as a positive psychological mechanism, is one of the stipulations for the institution of vicinity attachment relationships [15].
People instinctively have a need and preference for open, comfortable and safe environments, which leads to attachment relationships. This has been verified by national and international studies, and Ryan conducted a study on visitors in urban parks and found that visitors’ environmental preferences showed a moderate correlation with place attachment [16]. Moore and Graefe used a railroad culture park as a study and found that place identity as a mediator of place dependence influenced visitors’ evaluation and attitude towards the park [17].
Health Benefits
The positive benefits of the surroundings on human fitness have been receiving interest from pupils in various fields, and when people are in the right environmental afforestation, they grow to be extra relaxed, blissful and healthy. Nature-based landscapes are additionally frequently integrated into the format and building of city inexperienced areas. Compared to other spaces in the city, urban greenspaces are more likely to stimulate healthy behaviors, and the various types of sports and social interactions people engage in in the outdoor environment are effective in promoting physical and mental health. In addition, greenspace can help people reduce psychological stress, relieve emotions and eliminate fatigue. The health benefits people obtain in urban greenspaces are manifested on three levels: psycho-emotional recovery, relief or reduction of physical illness, and long-term positive social effects [19]. The Health Benefits Assessment Scale can quickly and effectively measure the health benefits felt by visitors in a landscape environment. As Peschardt et al.. used the scale in their study and found that the more satisfied visitors were with the outdoor landscape, the more they were able to relieve stress and fatigue in it [20]. Subsequently, domestic scholars Zeng Zhen et al.. verified this idea using the Sanming Greenway in Fujian as an example, where visitors with a more satisfying recreation experience were more attached to the comfort provided by the environment, leading to physical and mental health recovery [21]. It has been proven in many research that recreationists are greater possibly to generate an experience of attachment when their simple wishes are met, which in turn promotes individual physiological and psychological relaxation [22, 23]. Thus, there may be a positive pathway between place attachment and health benefits.
Study Area and Methodology
Yangtze River Delta
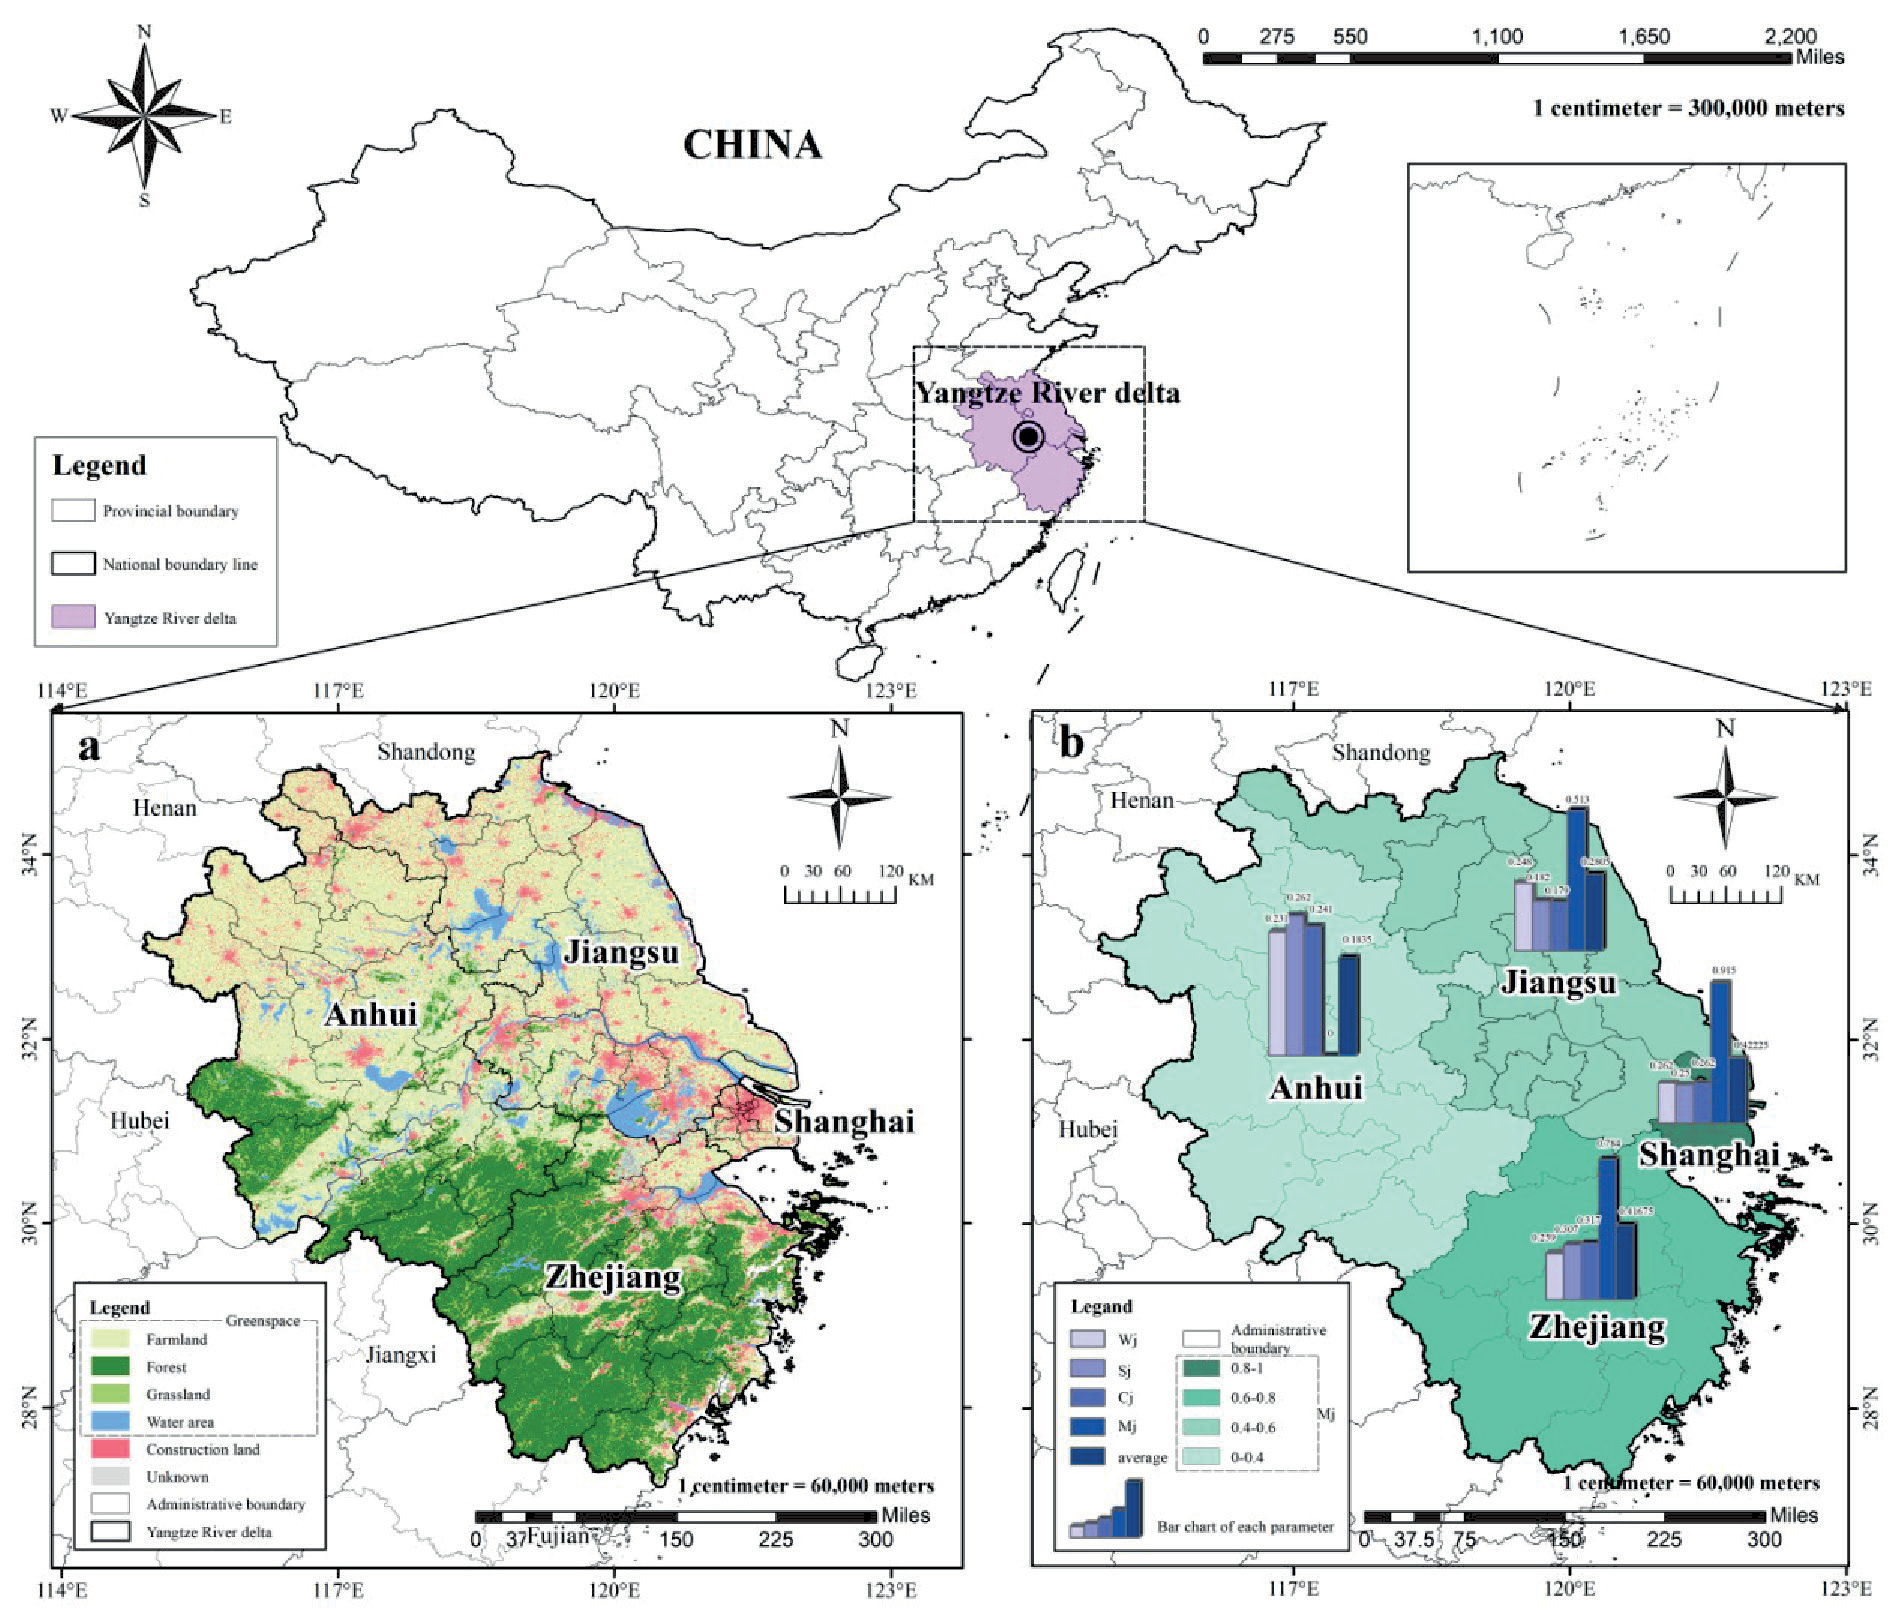
The Yangtze River Delta comprises forty-one cities in the provinces of Shanghai, Jiangsu, Zhejiang and Anhui. It is located downstream of the Yangtze River and adjoining the Yellow Sea and the East China Sea (Fig. 1).
Its area is 358,000 km2 and its urbanization rate is more than 60 %. While also being one of China’s regions with the highest real consumption and emissions of pollutants per unit of land area. They occupy an important strategic position within national norms of formal modernization and openness to the world. Encouraging the synergistic development of green space and economic regions in the Yangtze River Delta is of great significance for the sustainable promotion of healthy human life and the construction of China’s ecological civilization [24].
Structural Equation Modeling (SEM)
Structural Equation modelling is a method for building, estimating and testing causal models, which can replace multiple regression, through-trail analysis, factor analysis, analysis of covariance, etc., to clearly analyses the role of individual indicators on the whole and the interrelationships between individual indicators [25, 26].
In structural Equation modelling, we often encounter latent variables, which cannot be measured accurately and directly, such as job autonomy and job satisfaction. Traditional statistical analyses cannot properly handle these latent variables, while structural Equation modelling can handle them well at the same time. And makes the study more objective and scientific. In this paper SEM is used to assess the interrelationships and mechanisms of action between the triad of environmental preferences, place attachment and health benefits.
Hierarchical Analysis (AHP) and Entropy Weights (EW)
Hierarchical analysis and entropy weighting are both methods used to determine weights, which assign weights among multiple assessment indicators for use in a comprehensive evaluation. The hierarchical analysis method calculates weights by means of a pairwise comparison matrix, which usually has a strong subjective component, as this method relies on the judgement of the evaluator. The entropy weight method, on the other hand, is a weight determination method based on information theory. It has more objective characteristics compared to the hierarchical analysis method because it is not influenced by the subjective judgement of the evaluator. The combination of the two methods used to assess the weights of the influencing factors can give full play to their respective advantages in order to improve the reasonableness of the weight allocation [27]. In this paper, AHP and entropy weighting are used together to assess the weights of the influencing factors in the Yangtze River Delta, so as to derive the most important factors affecting its health benefits.
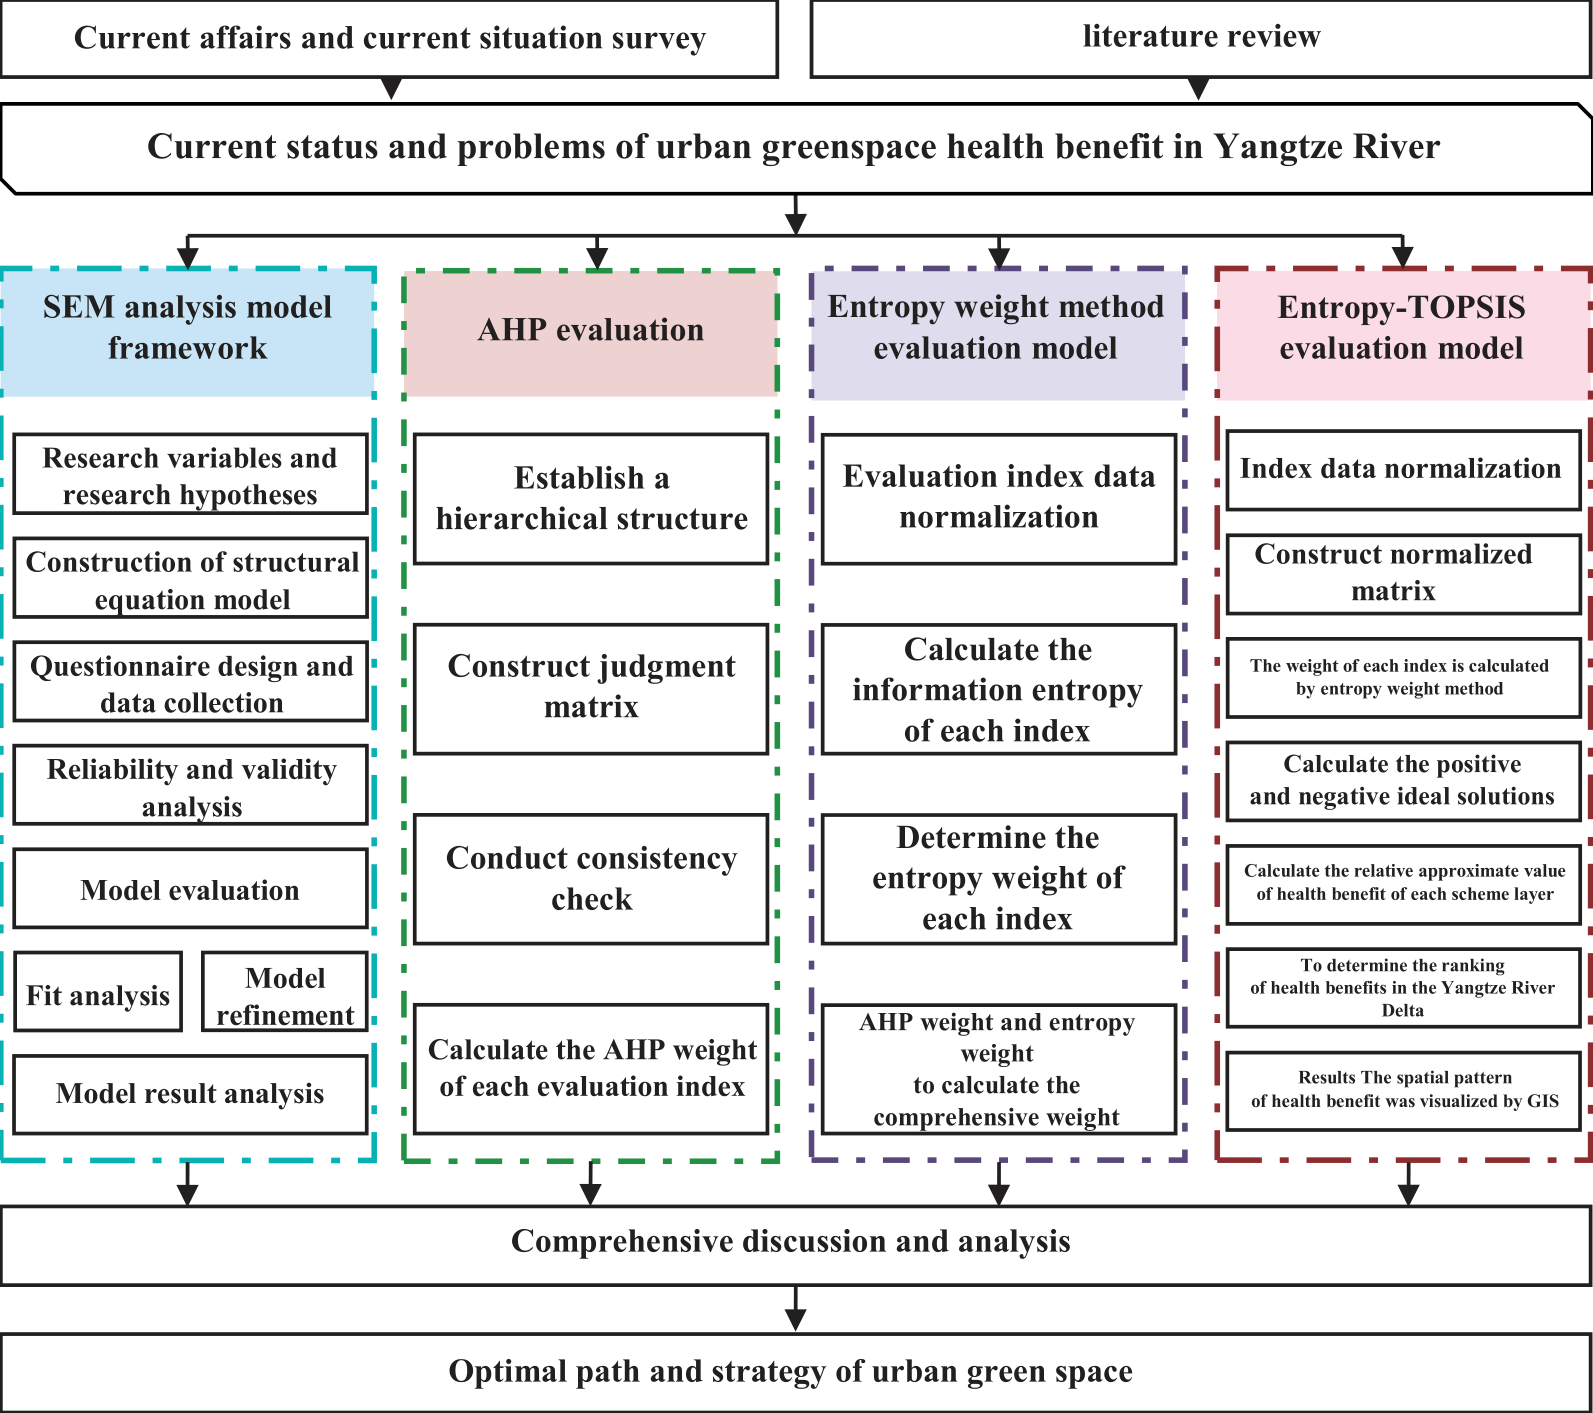
Technique for Ordering Preference by Similarity to Ideal Solution (TOPSIS)
Technique for Ordering Preference by Similarity to Ideal Solution is a multi-criteria decision-making method that was proposed by the Turkish mathematician Hakimi as a method for solving multi-attribute decision-making problems. The method determines the degree of superiority or inferiority of each decision-making solution by calculating the distance of each decision-making solution from the optimal and inferior solutions [28,29]. In this paper, TOPSIS is used to assess the strengths and weaknesses and spatial differentiation of health benefits in the Yangtze River Delta regions. The combined use of these methods can scientifically assess the health benefits of urban green space in the Yangtze River Delta from multiple perspectives, and thus construct the research framework of this paper (Fig. 2), which will enhance guidance and reference for the improvement programmed of the relevant sectors.
Analysis of the Relationship between the Impact of Urban Greenspace Health Benefits
Structural Model Construction
This study selects the greenspace in the city of the study area as the research object. Place dependence is a useful need. Humans typically have greater interactions with useful locations that are nearer to them, as a result triggering enhanced region dependence. Place dependence is without delay associated to the formation of place identity. Research have additionally proven that place dependence influences people’s assessment and mindset towards their surroundings thru the mediation of place identity, and that effective thoughts promote rest and enhance the evaluation of health benefits.
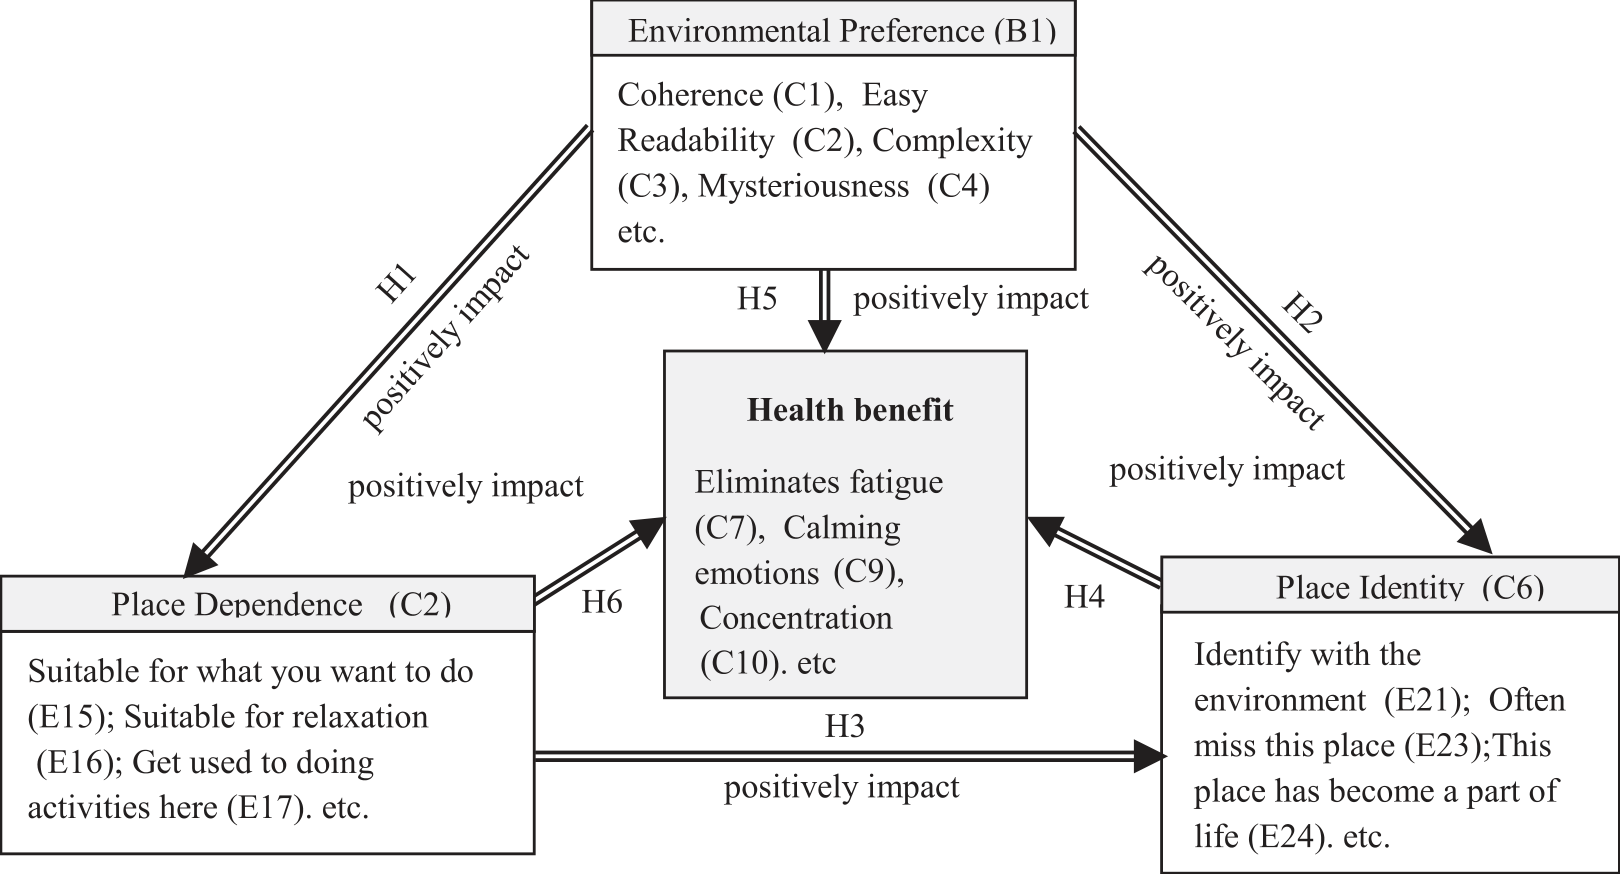
Combining the above analyses, this study proposes the following research hypotheses and constructs a conceptual model - Health benefit assessment model for urban green space recreationists (Fig. 3), and includes out an affirmation find out about with distinct inexperienced areas in the town as the lookup object. The following hypotheses have been made as a result:
H1: Environmental preferences have a significant positive impact on place dependence.
H2: Environmental preference has a significant positive impact on place identity.
H3: Place dependence has a significant positive impact on place identity.
H4: Place identity has a significant positive impact on health benefit assessment.
H5: Environmental preference has a significant positive impact on health benefit assessment.
H6: Place dependence has a significant positive impact on health benefit assessment.
H7: Environmental preference can positive impact health benefit assessment through the mediating effect of place attachment.
Questionnaire Design and Data Collection
This paper takes the recreationists in the city inexperienced house of Yangtze River Delta as the lookup target, and generally makes use of the questionnaire lookup technique to gain the lookup data. The questionnaire consisted of four parts. The first part mainly refers to Kaplan’s environmental preference matrix. Combined with further research by Huang Zhangzhan and other scholars, this environmental preference measurement scale was designed. It includes four dimensions of legibility (easy to find, clearly marked, not easy to get lost), coherence (continuous, hierarchical, sequential), complexity (complexity of elements, richness, irregularity, richness in change), and mysteriousness (attracting further exploration, meandering, mysterious and secluded, novelty) with a total of 14 evaluative indicators. The second part is the Place Attachment Scale, which draws mainly on Williams’ study and examines Place dependence and identity, respectively, with a total of 10 evaluation indicators [30]. The final section is the Health Benefits Assessment Scale, which draws on the study by Peschardt et al.. It includes four indicators: elimination of fatigue, rejuvenation, calming of mood and concentration [31]. The latter three measurement scales were all appropriately modified based on reference to existing established scales, taking into account the landscape environment of the research subjects and the language expression habits of the research area, and all were assigned values (1 = totally disagree, 9 = strongly agree) using the Likert scale method, respectively. During the data collection period, questionnaires were distributed in different cities to ensure the representativeness of the data. A random sample of residents with different gender, age and activity preferences was also conducted.
The questionnaire was distributed online in May 2023, and 634 questionnaires were returned, of which 125 samples were considered invalid as “non-Yangtze River Delta urban area”, and 509 samples were valid. Among the valid samples obtained, Zhejiang urban area accounted for the largest proportion of 53.83%, Shanghai urban area accounted for 29.08%, Jiangsu urban area accounted for 21.81%, and Anhui urban area accounted for 22.00%. Males accounted for 49.71% and females for 50.29%, and the numbers of males and females were roughly the same. In terms of age structure, young and middle-aged people aged 18-46 were the main group, accounting for 70.53% of the total. Those with high school, undergraduate and college education are the main recreational group, accounting for 78.78%, and the overall knowledge and cultural level of the sample is medium. The top five in terms of frequency of visiting urban greenspaces, in descending order, are: once a week (17.29%), once every six months (16.50), three times a week (14.54%), daily (13.36%), irregular (12.18%), and other (12.18%).
Table 1.
Environmental preference, place attachment and health benefits measurement scales (adjusted).
On the whole, the questionnaire sample showed diversity in terms of gender, age group, education level, and frequency of leisure, which to a certain extent reflects the representativeness and randomness of the sample data.
Structural Model Analysis
Suitability Analysis
The reliability of the scales was examined using the SPSS software program. The Cronbach’s alpha covered by the three latent variables ranged from 0.893 to 0.894, which met the minimum threshold criterion of 0.7, indicating that the scale has high internal reliability. The overall Cronbach’s alpha of the scale was 0.901, which is greater than 0.7; the KOM was 0.942>0.7, and the Bartlett the significance of the spherical test was 0.00<0.05, indicating that the data could be analyzed in depth.
SPSS 25.0 and AMOS 23.0 were used for sample data processing and structural relationship model validation analysis. Parameter estimation of the structural model using the great likelihood method yielded a ratio of degrees of freedom of 2.060, an RMSEA of 0.046, an RMR of 0.136, a CFI of 0.974, an NFI of 0.901 and an NNFI of 0.966. All tests met the review criteria and the model can be seen to be appropriate (Table 2).
Table 2.
Model goodness-of-fit test.
| Model Fitting Metrics | Cardinality of freedom ratio | GFI | RMSEA | RMR | CFI | NFI | NNFI |
|---|---|---|---|---|---|---|---|
| Ideal value | <3 | >0.9 | <0.10 | <0.05 | >0.9 | >0.9 | >0.9 |
| Actual value | 2.060 | 0.950 | 0.046 | 0.136 | 0.974 | 0.950 | 0.966 |
Table 3.
Path coefficient estimation and hypothesis testing.
Hypothesis Testing and Analysis of Results
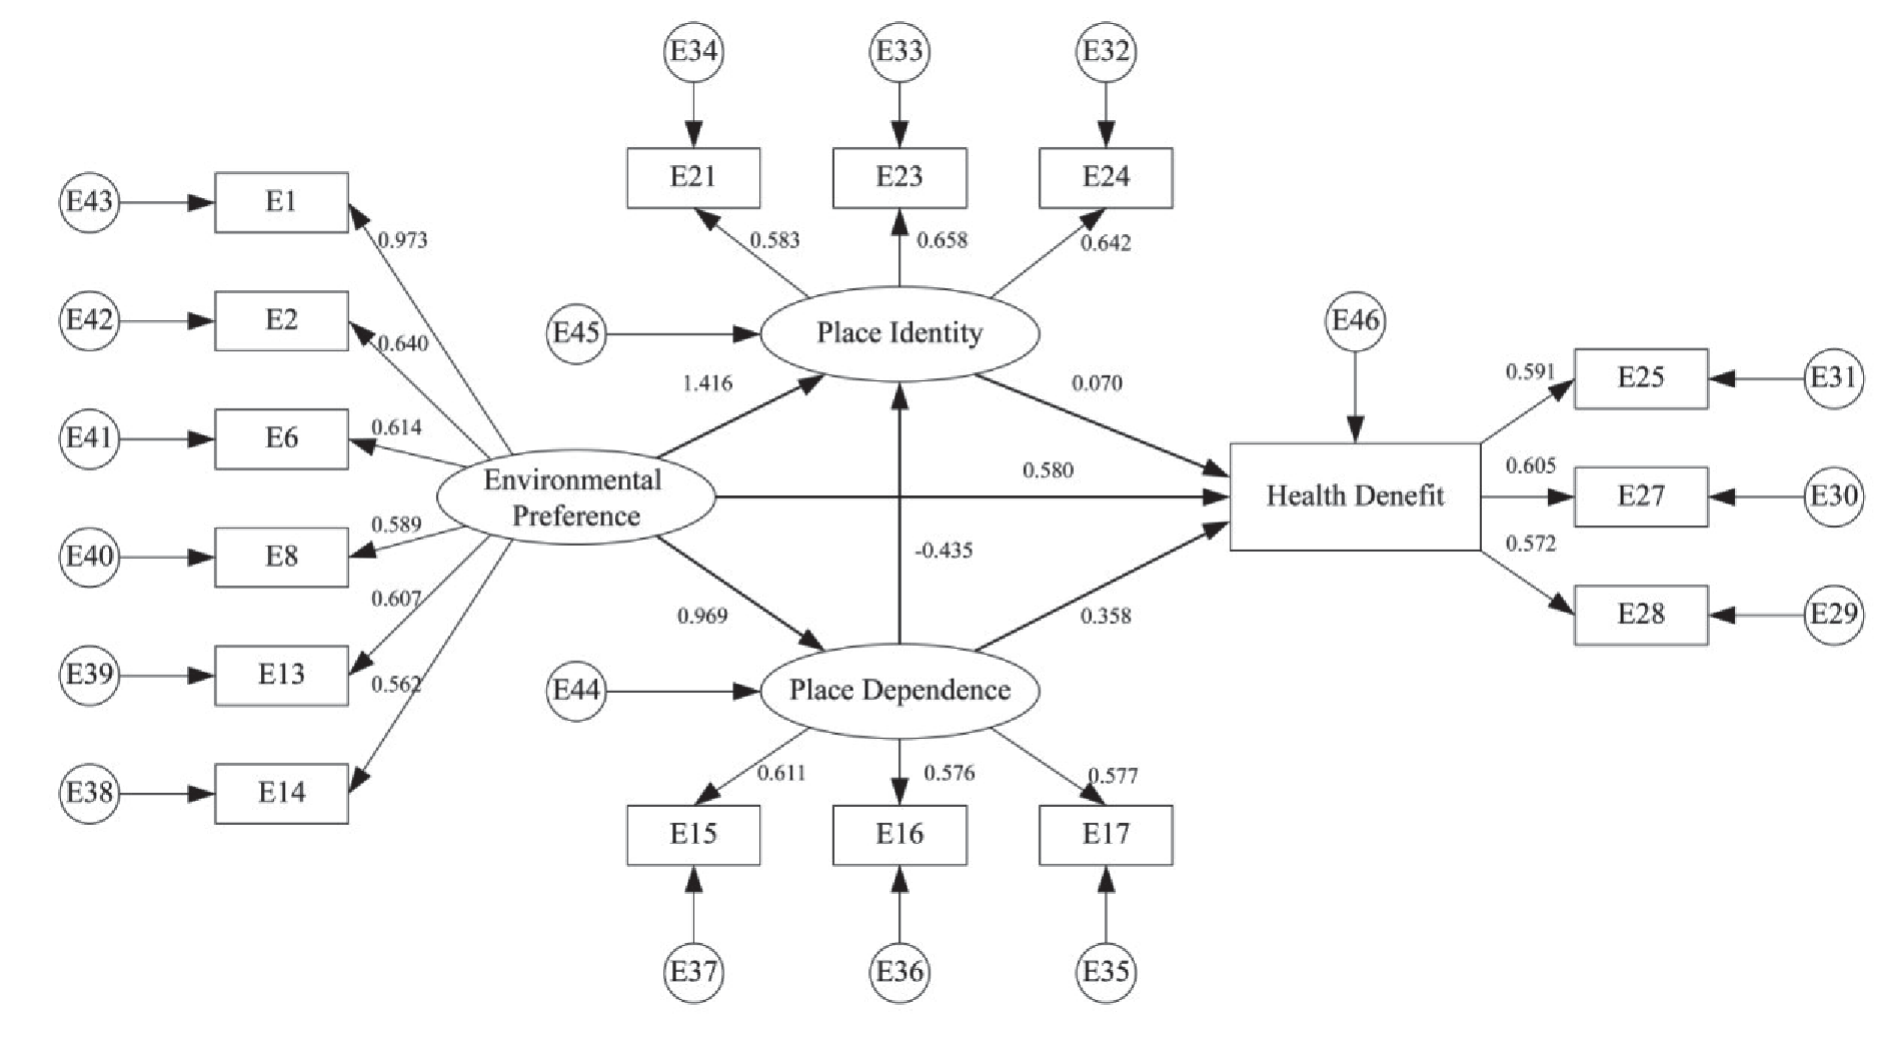
The evaluation of the parameters shows that it is clear that although the measured variable of environmental preferences contains 14 sub-objects. However, not every item can effectively predict environmental preference. In this study, only five sub-topic items, E1, E2, E6, E8 and E13, can effectively predict environmental preferences. In descending order of the magnitude of the factor loadings of the observed variables based on environmental preferences: E1 (1)>E2 (0.869) = E6 (0.869)>E8 (0.843)>E13 (0.838); Environmental preferences are most influenced by E1, which indicates that continuity of the landscape is the most important driver of individual recreation environmental preferences. While E1 and E2 belong to C1 coherence, E6 belongs to C2 legibility, E8 belongs to C3 complexity, and E13 belongs to C4 mystery. Therefore, this study found that pleasant environments need to have coherence and legibility rather than complexity and mystery. In other words, hierarchical and orderly green spaces are more likely to generate environmental preferences. In this study, urban green spaces in the Yangtze River Delta were used as a source of information reception. Due to the different specifics of the study area, there is a slight deviation from the results of previous studies. Combined with the above analysis, based on the four qualities of consistency, legibility, complexity, and mystery, focusing on improving consistency is more likely to stimulate recreationists’ environmental preferences in urban greenspaces (Table 1, Fig. 3).
By comparing the structural equation models, it can be considered that environmental preference has a considerable effective impact on place dependence (β = 0.967, p<0.001) with an impact stage of 96.9%, and hypothesis H1 holds. It shows that for every 1 unit increase in environmental preference, place dependence will increase by 0.969 units accordingly. The degree of influence of environmental preferences on place identity was 141.6%, with a remarkable positive influence (β = 1.359, p<0.02), and hypothesis H2 holds. It shows that for every 1 unit increase in environmental preference, there is a subsequent increase of 1.416 units in place identity, which shows that environmental preference has a remarkable impact on place identity. There was a remarkable positive influence of environmental preference on health benefit assessment (β = 0.560, p<0.001) with an effect of 58%, and hypothesis H5 held. It shows that for every 1 unit increase in environmental preference, there is a subsequent 0.580 unit increase in health benefit assessment (Table 3, Fig. 3).
At the same time, the study concludes that tourists’ environmental preferences not only have a remarkable positive influence on their assessment of the health benefits, but also positively influence these benefits through their attachment to the region. The Bootstrap approach used to be used to check the mediating impact of environmental preferences in positively influencing the evaluation of health benefits through place attachment. The Bootstrap number was set to 1000 and the confidence interval was 95%. the 95% confidence interval [0.244,0.442] of the Boot CI did not contain 0 and satisfied c’ ∈ [0.244,0.442]. This indicates that the mediation effect is fully mediated. In this case, the direct effect of environmental preferences on health benefits in the standardized context is 0.413, the indirect effect on health benefits is 0.342 and the total effect on health benefits is 0.755 (0.342 + 0.413). Hypothesis H7 is thus confirmed (Table 4).
From the final results, it can be seen that recreationists’ experiences in the environment are oriented to three branching paths of place dependence, place identity, and health benefit assessment, respectively, starting from environmental preferences, which is similar to the relevant findings of previous scholars [32]. An environment is more likely to elicit environmental preferences from visitors if it possesses a strong consistency, along with qualities of legibility, complexity, and mystery. Preferred environments are extra probably to create an emotional and purposeful connection between the tourist and the environment, thereby improving the individual’s evaluation of the health benefits of the greenspace. At the identical time, having environmental preferences by myself can additionally enhance an individual’s evaluation of the health benefits of the greenspace.
Urban Greenspace Health Benefits Superiority Assessment
Construction of Urban Greenspace Health Benefits Evaluation System
According to the role of greenspace on population health, the comprehensive evaluation and analysis results of four related fields, namely natural elements, activity space, service facilities and spatial experience, were transformed into a progressive hierarchical model with reference to the study of Liu Jiangxiu et al. [33].
Natural elements: the natural landscape of urban parks has an important influence on enhancing the health value of greenspace. Green plants can make people feel happy and relaxed; changes in the form and texture of plants can enrich people’s visual experience.
Activity space: According to the function of space, it is divided into interaction activity space and physical activity space. The interaction activity space provides social interaction activity places for residents’ chatting and drinking tea, touring and meditation, chess and cards, etc. The park greenspace with good environment, energetic, beautiful landscape and interesting has high health service benefits.
Service facilities: the distribution density and richness of rest facilities, activity facilities, and the configuration of shade facilities have a great influence on the time and frequency of residents’ use of urban greenspace. For example, fitness and shade facilities are more attractive and inspire users to carry out physical activities. Interactive facilities can inspire users to carry out physical exercises and promote physical and mental health.
Spatial experience: good spatial experience has positive significance for users’ mental health. Urban greenspace with low risk, good experience of activities and high safety of space health service benefits.
In the selection of index establishment, by collecting relevant literature and experts’ suggestions, the Yangtze River Delta urban greenspace health benefits evaluation index system is finally established as 1 target layer, 4 criterion layers, 14 sub-criterion layers and 4 program layers, and the construction process is as follows:
In the first step, the green health benefits of Yangtze River Delta cities are set as the target layer, which is represented by V. In the second step, “natural elements”, “activity space”, “service facilities” and “spatial experience”, which are the roles of greenspace on people’s health, are set as the guideline layers, which are indicated by J1-J4 respectively. In the third step, “vegetation diversity”, “topographic complexity”, “waterfront ecological environment”, “density of interaction space”, “richness of interaction space”, “density of physical activity space”, “richness of physical activity space”, “number of leisure facilities”, “richness of leisure facilities”, “number of fitness facilities”, “richness of fitness facilities”, “spatial safety”, “spatial atmosphere”, and “spatial comfort” are set as sub-criteria layers and expressed by T1-T14 respectively In the fourth step, the four provincial-level administrative regions (Shanghai, Zhejiang, Jiangsu and Anhui) in this study area were used as the programmed layer. Represented by F1-F4, to construct an evaluation index system for the Evaluation index system of greenspace health benefits in Yangtze River Delta cities.
The questionnaire was designed in a scale scoring format. Each question consisted of a set of statements, each of which was assigned a 9-point scale. They were categorized into 1, 2, 3, 4, 5, 6, 7, 8, and 9 levels in order of comparative influence, with each level indicating how the respondents compared the statements to the questions. Participants were asked to rank the importance of each attribute using a nine-level scale. Specific questions are derived from the 14 indicators in the indicator layer. For example, the question for T1 Vegetation Diversity is “How rich do you think the vegetation is in the local green space?” T2 Terrain Complexity is “How complex do you think the terrain is in your local green space?” and so on (Table 5).
Table 5.
Description of the questionnaire on the health benefits of greenspace in Yangtze River Delta cities.
Questionnaire Statistics and Reliability Analysis
Questionnaire Statistics
A complete of 331 questionnaires have been amassed from the public, and 308 questionnaires had been received via except for invalid questionnaires from “non-Yangtze River Delta urban areas”. The valid sample has the largest proportion of Shanghai urban area with 30.84%, Zhejiang urban area with 27.6%, Jiangsu urban area with 25.32%, and Anhui urban area with 16.23%. Men accounted for 55.52% and women 44.48%. In phrases of age structure, most of them are placed in the younger and middle-aged team between 18 and forty-six years old, with 214 people, accounting for about 69.48% of the complete number, accompanied by means of the team between forty-six and fifty-five years historical with forty-seven people, accounting for about 15.25% of the whole number. High school, undergraduate and college educated people are the main recreation group, accounting for 80.51%, the overall knowledge and culture level of the sample is moderate. In phrases of the frequency of visiting urban greenspaces, the age structure is dominated by young and middle-aged people aged 18-46 (70.53% of the total). People with high school, bachelor’s degree and college education are the main group, accounting for 78.78%. The overall knowledge and culture level of the sample is moderate. In phrases of the frequency of journeying urban greenspaces, the top five in descending order are: twice a week (16.88%), once a month (15.58), irregularly (13.31%), once a year (10.39%), three times a week (9.42%), once every six months (9.42%), other (4.55%) and once a week (4.55%). Overall, the sample showed diverse representations in terms of gender, age group, education level, and frequency of recreation, reflecting to a certain extent the representativeness and randomness of the sample data.
Reliability Analysis
In this paper, SPSS was once used to habits the reliability check analysis, and the standardized Cronbach alpha coefficient was once 0.936, which is larger than 0.8, for that reason indicating that the questionnaire has an excessive satisfactory of reliability. The KMO sampling health measure was once 0.955, which shows that the learn about facts is nicely ideal for extracting data and can be used for issue analysis. Also, the consequences of Bartlett’s sphericity take a look at confirmed a value p-value equal to 0.000. In summary, the reliability of the learn about facts meets the survey prerequisites and can be used for similarly follow-up analysis (Table 6).
Evaluation and Analysis of Greenspace Health Benefits
Data Calculation
The first step is to construct a judgment matrix. For the elements on each progressive level in the evaluation index hierarchy, a series of judgment matrices can be established by comparing two by two with the elements of the previous level that are linked to them in turn. According to the elements J1-J4 in the target layer V Yangtze River Delta urban greenspace health benefits assessment and the guideline layer and the indicator layers T1-T14, and then construct the comparison judgment matrix of the corresponding layers:
In Equation (1): rij>0, rii = 1, rij is the proportional scale of the importance of ai and aij relative to the upper level, representing the importance of elements ai and aj in comparison. rij is usually assigned by experts in the relevant field or given based on data from questionnaires, and has rij × rij = 1.
In the second step, consistency tests are performed and weight sets are calculated. To ensure that there is no logical error in the content of the importance determination, the consistency test is performed on the determination table. The values of the coherence index and coherence ratio were used for the test, and the formula for the calculation was as follows:
In Equation (3), CI is the consistency index, and λmax is the most attribute root of the judgment matrix R. If CI = 0, there is entire consistency. If CI is shut to 0, the diploma of great consistency is high; the large the CI, the extra serious the inconsistency.
In Equation (4), RI is the common random consistency index fee, and CR is the take a look at coefficient. If the check coefficient CR≤0.1, the matrix is viewed to mirror a regular diploma of importance; Otherwise, the price of the significance dedication desires to be adjusted till it meets the necessities of the consistency take a look at results.
Accordingly, the data for indicators T1-T14 were tested, and the maximum eigenvalue λmax obtained by the calculation was 14.000 with CI = 0. Calculated according to the average random consistency index, it was concluded that when n = 14, RI = 1.58 and CR = < 0.1, so it was determined that the determination passed the consistency test (Table 7).
After satisfying all consistency tests, the combined weights of each element were calculated by the judgement matrix (Table 8). The geometric mean method was used to calculate the weight values of the judgement matrix (Equation (4)), which resulted in the set of weights for the evaluation of the health benefits of urban green spaces in the Yangtze River Delta.
In the third step, the entropy weight technique is brought to calculate the entropy weight of every indicator. Let aij be the authentic facts and Yij be the value of the jth evaluator’s ith indicator after normalization. Since negative indicators are not included in this study, data normalization is used to standardize each indicator, and the calculation system is as follows:
The entropy price is calculated by using the attribute weight. let ej be the entropy price of the jth contrast index. Let the attribute weight be Pij, and Pij be the share of the normalized cost Yij to the complete normalized value. Then the calculation method of entropy price ej is as follows:
Calculate the entropy weight of every index, and let Sj be the entropy weight of the jth contrast index, then its calculation components are as follows:
In the fourth step, the AHP weights are corrected by using the entropy weight approach and the complete weights are derived. Based on the weighting effects of the indications via the above two methods, the built-in weight Cj is calculated with the following formula:
Table 7.
Summary of results of consistency tests.
| Maximum characteristic root | CI value | RI value | CR value | Consistency test results |
|---|---|---|---|---|
| 14.000 | 0.000 | 1.580 | 0.000 | pass |
Table 8.
Judgement matrix for the analysis of evaluation indicators.
In Equation (9), Wj and Sj characterize the complete weights of every contrast index calculated by way of the hierarchical evaluation technique and the entropy weight method, respectively. The effects of each subjective and goal assignments are synthesized and calculated.
In the fifth step, the standardized matrix is developed by using integrating the entropy-weight-TOPSIS method. And calculate let Zij be the standardized fee of the ith index of the jth evaluated object, then the judgment matrix can be constructed:
The distance between the jth comparison object and the most price is Djmax, the distance between the jth contrast object and the minimal price is Djmin. Zimax is the most preferred fee of the ith index, and Zimin is the minimal popular fee of the ith index.
The sixth step is to decide the proximity of every assessment object to the most useful solution, i.e., the relative proximity cost Mj. The proximity displays the proximity of one-of-a-kind contrast objects to the superb best answer and the poor best answer in phrases of the alternate of posture. The particular calculation is shown in Equation (7).
The options are ranked through the magnitude of Mj (j ∈ m), the large the cost of Mj, the nearer the answer is to the fine best solution, and the higher the answer is. Conversely, the smaller the fee of Mj, the nearer the answer is to the terrible best solution, and the worse the solution is.
Statistical Analysis
(1) Analysis of the weight of each indicator. The hierarchical analysis method of assignment uses a subjective evaluation method, and the entropy method of assignment uses an objective evaluation method. In order to make up for the defects of the hierarchical analysis method and improve the scientific of the evaluation results, the comprehensive subjective and objective assignment method was selected. The weight calculation of hierarchical evaluation approach and entropy weighting approach are combined, and sooner or later the two task strategies and complete weight values are derived. According to the weight values of the criterion layer, it can be considered that the comparison indexes are ranked in order of significance as J2 activity space (0.388)>J3 service facilities (0.215)>J1 natural elements (0.203)>J4 spatial experience (0.194). It indicates that in the Yangtze River Delta, activity space dominates the health benefit assessment of urban greenspaces, with its overall weight much higher than that of the other upstream indicators that have a greater influence on the health benefit assessment of urban greenspaces. Secondly, recreationists also care about the service facilities in urban greenspace. In activity space and service facilities, recreationists care more about the natural elements in urban greenspace. And spatial experience has the least influence on the health benefit assessment of urban greenspace. The focus should therefore be on enhancing recreational areas and carrier facilities in greenspaces (Table 9).
According to the weight price of the index layer, it can be considered that the pinnacle 5 vital rating of contrast indexes are: T4 interaction activity space density (0.128)>T5 interaction activity space type richness (0.119)>T14 environmental comfort (0.114)>T2 terrain complexity (0.107)>T6 physical activity space density (0.093) in order. It shows that in the health benefit assessment of recreationists for urban greenspace in the Yangtze River Delta, recreationists care most about the density of interaction activity space in urban greenspace It also means that the density of interaction activity space has the greatest impact. In addition to this, the combined weights of T5, T14 and T2 are higher than 0.1, and the difference with T4 interaction activity space density is smaller, indicating that recreationists also care about the richness of interaction activity space type, environmental comfort and topographic complexity in urban greenspace. The last five ranks of evaluation indexes in order of importance are: T7 physical activity space type richness (0.017)<T9 leisure facilities type richness (0.023)<T3 waterfront ecological environment (0.038)<T10 fitness facilities quantity (0.041)<T13 spatial atmosphere sense (0.053). Among them, the combined weights of T7, T9, T3 and T10 are all below 0.05, which are at a low level. It indicates that the richness of physical activity space type, the richness of leisure facility type, waterfront ecological environment and the number of fitness facilities have the weakest influence on the assessment of health benefits of urban greenspace. In view of this, the process of improving the health benefits of urban greenspaces should focus on improving the density and diversity of spaces for the exchange of activities, ecological comfort and the complexity of the topography of greenspaces (Table 9).
(2) Evaluation of program-level superiority and spatial differentiation of health benefits. According to the weights of the AHP, its programmed layers are ranked F1>F2>F3>F4. It shows that the health benefits of urban greenspaces are highest in Shanghai, higher in Zhejiang and Jiangsu and lowest in Anhui. In terms of entropy weights, the ranking of their scheme layers is F2>F4>F1>F3 in that order. It indicates that the health benefits of urban greenspace are highest in Zhejiang, higher in Anhui and Shanghai, while Jiangsu had the lowest health benefits. The assessment results of the above two different methods are clearly different. This reflects that the use of different methods will inevitably lead to different evaluation results. In order to avoid the defects of subjective assignment put and objective assignment method to the maximum extent. In this paper, only the calculation results of hierarchical analysis method and entropy weighting method are used as the control, and the calculation results of comprehensive weighting are used as the output. Thus, the limitations of a single method are circumvented (Table 9).
In phrases of the combined weights, the Yangtze River Delta regions were ranked in the following order of weights: F2 (0.317)>F1 (0.262)>F4 (0.241)>F3 (0.179). It shows that for urban recreationists, Zhejiang urban greenspace has the highest health benefits, followed by Shanghai and Anhui, while Jiangsu urban greenspace has the lowest health benefits (Table 10).
Table 9.
The weights of evaluation indexes determined by the comprehensive subjective and objective assignment method.
In terms of relative proximity values, the programmed layers have the following order: F1 (0.915)>F2 (0.784)>F3 (0.513)>F4 (0.000). The relative proximity values of greenspace health benefits in the Yangtze River Delta cities ranged from 0 to 1 with a maximum amplitude of 0.915. The relative proximity value in Shanghai was at the peak of 0.915. the relative proximity value in Anhui was at the trough with a relative proximity value of 0 (Table 10).
In summary, the health benefits of urban greenspace in the Yangtze River Delta are divided into three gradients according to the mean of health benefit index and spatial pattern characteristics. The first gradient includes Shanghai and Zhejiang, with the mean of health benefit index ranging from 0.4 to 0.5. The second gradient includes Jiangsu, with the mean of health benefit index ranging from 0.2 to 0.4. the third gradient includes Anhui, with the mean of health benefit index ranging from 0 to 0.2. This indicates that Shanghai has the highest health benefits in the urban greenspace of the Yangtze River Delta, followed by Zhejiang and Jiangsu, while Anhui has the lowest health benefits in the urban greenspace.
The criteria for dividing relative proximity values can be defined from the legend, and the pattern of distribution of green spatial health benefits in cities in the Yangtze River Delta can be clearly differentiated. The specific ranking of its health benefits is as follows: Shanghai>Zhejiang>Jiangsu>Anhui (Fig. 1b). From this spatial distribution, it can be seen that the health benefits of urban greenspace are positively related to the rate of urbanization and the degree of economic development of a city. The reason is due to the fact that the degree of development of a city affects the planning and development of local greenspace to a certain extent. Economically developed cities have more population, capital and supporting facilities to provide continuous support for the healthy development of local greenspace, while economically backward cities have less population, capital and supporting facilities than developed cities, and have fewer resources to promote the development of local greenspace. The outcomes of the find out about additionally point out that we want to center of attention on enhancing the health benefits of greenspaces in less developed cities, focus on improving urban greenspaces in Anhui, and promote super monetary improvement in Anhui cities. At the same time, we hope to strengthen dialogue between the cities of Shanghai, Jiangsu, Zhejiang and Anhui to standardize and integrate greenspace construction. In this way, they can make contributions to the wholesome and sustainable improvement of city inexperienced areas in the Yangtze River Delta.
Discussion
This study has many associations with previous scholarly research, as well as certain points of innovation and difference. In terms of similarities;
(1) the hypotheses of this study fully draw on environmental preference, place attachment, and health benefit theories, and ultimately use structural Equation modeling to argue for a series of hypotheses in the text. Previous studies by scholars have used structural Equation modeling, a comprehensive evaluation method, which well predicts the complex relationships among different variables and provides insights for this paper. (2) The health benefit assessment indicators and theoretical models presented in this document are based on relevant health benefit assessment studies. The indicator system for the evaluation of the health benefits of greenspaces was taken directly from the evaluation indicator system of Liu Jiangjiu et al. The authors’ study provides a large number of references for this article and provides a sufficient reference for the present article.
From the point of difference: This study adopts analytic hierarchy process, entropy method and entropy TOPSIS to conduct research, fully considering the difference of subjective and objective distribution methods, and comprehensively verifies and explores the health benefits of urban greenspace in the Yangtze River Delta.
In the process of the study, we also found a series of problems and defects, including two specific aspects:
(1) H1, H2, H5 and H7 of the article’s hypotheses hold, while the rest of the hypotheses do not hold. It can be seen that there are some problems with the assumptions at the beginning. Moreover, in the later model construction, some indicators were removed in this paper in order to make some assumptions hold. Among them, only five sub-topic items, E1, E2, E6, E8 and E13, can effectively predict the effects produced by environmental preferences. It is evident that the research hypotheses and the original scales (Environmental Preference Measurement Scale, Place Attachment Scale, and Health Benefit Assessment Scale) in this paper lack some research feasibility. This is where the biggest flaw of this paper lies. (2) This study used people’s subjective ratings in the evaluation of the health benefits of urban greenspace, and did not use objective index data. The final data are the results of people’s subjective evaluations, and although the entropy the closing records are the outcomes of people’s subjective evaluations, and though the entropy weighting method, a goal task method, is used, the goal comparison facts are no longer blanketed in this study. In the future, the health impacts of urban greenspaces in the Yangtze River Delta should be studied from a broader perspective. To make sure the objectivity and rationality of the find out about results, the lookup programmed must be monitored greater intently and site-specific research must be blanketed in the study.
Conclusions
This paper analyzes the health advantages of urban green spaces in four regions of the Yangtze River Delta urban agglomeration (Anhui, Shanghai, Jiangsu and Zhejiang). Suggestions are made for the construction, form and management of urban green spaces in the Yangtze River Delta urban agglomeration. The following three conclusions are drawn.
Firstly, environmental preferences have a remarkable positive influence on Place dependence, place identity and evaluation of health benefits. At the same time, not only do recreational users’ environmental preferences have a remarkable positive influence on their assessment of the health benefits of urban greenspaces, but they also positively influence health benefits through place attachment. The overall effect of environmental preferences on health benefits is 0.755 (0.342 + 0.413). In the standardized framework. In summary, this study concludes that recreationists’ experiences in the environment are oriented to three branching paths of place dependence, place identity, and health benefit assessment, respectively, starting with environmental preferences. An environment is more likely to elicit environmental preferences from excursionists if it possesses strong consistency, but also has qualities of legibility, complexity, and mystery. Preferred environments are then more likely to create emotional and functional connections between the visitor and the environment, thereby improving the individual’s assessment of the health benefits of the greenspace. At the same time, having environmental preferences alone can also improve an individual’s assessment of the health benefits of greenspace.
Secondly, the activity space dominates and has the greatest influence on the health benefit assessment of urban recreational greenspaces in the Yangtze River Delta. Secondly, recreationists also care about the service facilities in urban greenspace; after activity space and service facilities, recreationists care more about the natural elements in urban greenspace. Although spatial experience has the least impact on evaluations of the health benefits of urban greenspace; the process of enhancing the health benefits of urban greenspaces should focus on improving activity spaces and service facilities within the greenspace. Meanwhile, recreationists care most about the density of interaction space in urban greenspace. It also means that the density of interaction space has the greatest influence on the evaluation of health benefits of urban greenspace. Besides, recreationists additionally care about the richness of interplay house type, environmental relief and topographic complexity in city inexperienced space. In the manner of enhancing the urban greenspace, the focal point ought to be on enhancing the density of interplay pastime space, the richness of interplay pastime house types, environmental alleviation and topographic complexity in greenspace.
Thirdly, the health benefits of urban greenspace in the Yangtze River Delta are broken down into three gradients: the first of these comprises Shanghai and Zhejiang, with the average health benefit index ranging from 0.4 to 0.5; the second gradient includes Jiangsu, with the average health benefit index ranging from 0.2 to 0.4; and the third cline includes Anhui with the mean health benefit index ranging between 0 and 0.2; The spatial pattern of health benefits shows that Shanghai has the highest health benefits of urban greenspaces in the Yangtze River Delta, followed by Zhejiang and Jiangsu, while Anhui has the lowest health benefits of urban greenspaces. The spatial distribution of health benefit indices in the Yangtze River Delta is roughly proportional to the urbanization rate and degree of development of each city. The specific ranking of their health benefits is: Shanghai>Zhejiang>Jiangsu >Anhui. The results also show that we need to focus on improving the urban greenspace in Anhui and promoting the exceptional monetary improvement of Anhui cities. At the equal time, we additionally want to improve the conversation between Shanghai, Jiangsu, Zhejiang and Anhui cities to standardize and combine the development of greenspaces. In this way, we can promote the wholesome and sustainable improvement of city inexperienced house in the complete Yangtze River Delta.

