

Introduction
With the acceleration of urbanization and modern industrialization, resource consumption is accelerating, pollutant emissions are increasing, and ecological damage and environmental pollution problems are becoming increasingly serious [1]. Under the dual goals of economic development and environmental protection, environmental friendliness has gradually become a recognized prerequisite for economic growth. To transform the mode of economic growth and improve the quality of economic development, countries are also actively exploring sustainable economic growth models [2, 3]. Along with the modernization of its governance system and capacity, China is also trying to improve environmental quality through various environmental regulatory policies. The Measures on Environmental Information Disclosure by Enterprises and Institutions, which regulates the norms of EID and the penalties for non-compliance, have largely changed the situation of weak implementation of EID policies. Then, can China’s EID policy balance economic development and environmental protection as well as reduce greenhouse gas emissions? This is the initial goal of China’s implementation of this policy and the core issue of concern in this paper.
Nowadays, environmental pollution has become a bottleneck that restricts sustainable economic and social development, and problems such as global warming have raised awareness of environmental pollution [4]. Aiming at reducing pollutant emissions, scholars have explored the influencing factors of environmental pollution from several perspectives, which can be divided into two main categories. First, analysis from the perspective of economic activities. Energy prices, technological innovation capacity, economic growth, industrial development and renewable energy use, the development of digital economy are considered as factors that influence environmental pollution [5-9]. Second, examine the influencing factors of environmental pollution based on environmental regulations or institutions. For example, Clean Air Policy, Managing Marine Plastic Pollution Policy, Abatement of Nuisances Law, Smart City Policy, Urban Motor Vehicle Restriction Policy, Fuel Price Policies, Carbon Emission Trading Pilot Policy [10-16]. The above studies have a single indicator of environmental pollution, mostly using industrial pollutants or a single exhaust gas emission, carbon emission and sulfur dioxide emission to measure pollutant emissions. Meanwhile, some studies characterize pollutant emissions by industrial pollutant emissions, ignoring the role of living pollutants on environmental pollution. The formation mechanism of living pollution and industrial pollution has a large deviation, if we neglect the role of living pollution, it may make the environmental policy analysis biased. It provides experience in the selection of the object of our study.
And research on EID can be traced back to the late 1990s. At that time, high-level corporate, environmental and government officials came together to discuss the growing trend of EID as a tool to increase public participation [17]. After that, Stephan [18] clarified the theoretical framework of EID schemes and their functioning. Bulanova and Petrovskaya [19] further define the meaning of “accuracy of environmental information”, and then analyze the information and composition issues of EID as well as its functional framework. Existing studies mainly focus on the policy effects of EID, such as the magnitude of EID is positively related to political and labor regimes and negatively related to financial regimes [20], EID not only can enhance corporate financial performance and profitability [21, 22], but also it has a positive effect on firms’ export value and export intensity in cleaner production industries [23]. In addition, scholars have also focused on exploring the factors influencing EID. Directors’ foreign experience, company profitability level, CEO tenure, gender diversity audit committee size are known to affect the transparency of EID [24-27]. In summary, existing research on EID is mostly relevant to enterprise performance. Compared with policies such as carbon emissions trading policy, EID is more flexible and more diverse. This providing greater incentives for firms to publicize information on pollutant emissions, environmental investments and environmental planning.
The above studies provide thoughts and methodological references for the theoretical analysis and empirical tests in this paper, but there is still room for improvement. First, the existence of endogeneity problems caused by reverse causality and omitted variables. EID can improve green energy efficiency [28], which in turn reduces environmental pollution; environmental performance also affects the quality of EID [29]. Therefore, the article treats EID as an exogenous experiment and incorporates the dummy interaction term of policy implementation into the model, which solves the reverse causality problem. Meanwhile, the article uses fixed effects for estimation, which mitigates the omitted variable bias to a certain extent. Second, studies on the impact of EID on environmental performance have focused on toxic chemical emissions, sulfur dioxide, air pollution, water pollution, and few studies have focused on carbon emissions [30-33]. Here, we use CO2 emissions as the dependent variable and focus on the impact of EID on CO2, which opens the “black box” of the relationship between the two and provides empirical evidence for the implementation of informal environmental regulations in other developing countries. Third, as a voluntary policy initiative, EID is not an effective constraint on corporate environmental behavior [34], so there are natural barriers to examining the impact of this policy on corporate CO2 emissions. Given this, we extend the study of EID to the city level. At the same time, we can examine the panoramic transmission pathways of the effects of EID on CO2 more directly, which in turn helps to design a more effective mechanism pathway for urban carbon reduction.
Literature Review & Hypothesis Development
EID, as an integral part of national environmental regulatory mechanisms, is also an environmental regulation tool often used in international environmental agreements. International experience shows that improving the transparency of EID can help reduce pollutant emissions [35, 36]. From the perspective of macro control, the government can monitor pollution emission behaviors through EID. Meanwhile, it can also impose penalties on illegal emissions and false environmental protection input behaviors, thus reducing pollutant emissions, especially CO2 emissions. From the viewpoint of the production chain, EID can guide the flow of production factors to low-pollution and high-value-added segments [37], thus forcing high-polluting industries to reduce pollutant emissions and then reduce carbon emissions. In terms of external monitoring, environmental pollution information disclosure raises households’ concerns about pollution [38], enhances the public’s marginal willingness to pay for green products, and guides firms to increase investment in environmental consumption, which in turn helps to reduce environmental pollution. Accordingly, this paper proposes Hypothesis 1.
Hypothesis 1: EID can contribute to the reduction of CO2.
Innovation is the primary driver of development, which helps to reduce pollutant emissions [39]. According to the weak Porter hypothesis, environmental regulation can promote technological innovation [40, 41]. As a voluntary environmental regulation policy, EID can promote corporate green technology innovation [42], and green technology innovation has a suppressive effect on haze pollution, but the mediating effects of green technology innovation between EID and haze pollution have not been verified [43]. Based on the “signaling theory”, we believe that corporate EID reveals the responsibility of the enterprise to reduce emissions and sends a good signal to society. On the one hand, it establishes the reputation and image of the enterprise, earns good social trust, helps to increase the amount of business credit financing. This can provide support for the enterprise’s green technology innovation, thus realizing the optimization of energy consumption structure and the improvement of utilization efficiency, and ultimately reducing CO2. On the other hand, EID expands the scope of information about enterprise energy saving and emission reduction, and releases positive feedback signals to the government. With the incentive of tax incentives such as green technology innovation, the motivation for green technology innovation is stronger, which is conducive to improving energy efficiency and clean energy use, thus reducing CO2 emissions. Accordingly, this paper proposes Hypothesis 2.
Hypothesis 2: EID can impact CO2 emissions through green technology innovation.
EID can significantly improve energy intensity [44], and energy intensity is an important factor in curbing CO2 emissions [45], while there is a bidirectional relationship between energy use and environmental pollution [46]. Because information disclosure raises public awareness of environmental issues, this provides a tool for the public to identify and address environmental risks [47], which alerts firms to take action and develop low-carbon industries. As a voluntary environmental regulation, although the Chinese government does not currently regulate the quality and intensity of EID, companies will spontaneously shift to a cleaner and more efficient production model when faced with policy shocks. Cleaner production, i.e., shifting the priority of pollution control from end-of-pipe treatment to the whole production process. Efficient energy use covers both cutting costs and improving efficiency. Both clean production and efficient energy use will increase the proportion of clean energy use, reduce the use of fossil energy, and ultimately reduce CO2 emissions. Accordingly, the article proposes hypothesis 3.
Hypothesis 3: EID can influence CO2 emissions through energy intensity.
Methods & Variables
Variables Selection
Dependent variable: carbon dioxide (CO2). There are two main sources of urban carbon emissions, one is generated by fossil energy consumption and the other is produced by electrical energy and heat consumption. Referring to the study of Wu and Guo [48], the energy consumption of transportation, electrical energy consumption, and centralized heating in each city was calculated separately. Subsequently, according to the conversion of IPCC2006, the carbon emission factor of 1 kg of raw coal is 2. 53 kg, and after calculating the carbon emission, it is summed up to obtain the CO2 emission of each city. In the measurement process, some missing values are filled in by linear interpolation.
Independent variable: environmental information disclosure policy (PITI). The article treats EID policy as a quasi-natural experiment, and the grouping variable takes the value of 1 if the city is on the Pollution Information Transparency Index list, and 0 otherwise. The time dummy term for the year in which the index is made public and for subsequent years takes the value of 1, and 0 otherwise. Doing the crossover term between the grouping variable and the time dummy variable, the PITI is obtained. Among them, 113 cities made the PITI index public in 2008 and 120 cities in 2013.
Control variables: referring to relevant studies [49], this paper considers the following variables that may have an impact on CO2 emissions. The regional economic development (PGDP), measured by GDP per capita. External openness (FDI): the share of actual foreign investment used in each city to GDP. Industrial structure (IND): measured by the ratio of the share of tertiary industry in GDP to the share of secondary industry in GDP. Industrial Accessibility (GQ): Measured by the number of industrial enterprises above the scale. R&D intensity (RES): Measured using the proportion of science expenditure to GDP. Waste treatment capacity (CN): The harmless treatment rate of domestic waste is used for characterization.
Mediator variables: (i) Green technology innovation (GI). Green patents can reflect green technology innovation activities more intuitively. In this paper, the number of green invention patent applications is used to portray the green technology innovation activities in cities. To avoid the influence of zero value and simplify the calculation, the number of green invention patent applications is processed by adding one and taking the natural logarithm, and included in the model for calculation. (ii) Energy intensity (EI). Referring to the study by Fu and Jing [50], we adopt the sum of total natural gas supply, total liquefied petroleum gas supply, and electricity consumption of the whole society to represent. Given that the three indicators have different magnitudes, according to the conversion of GB/T25892008, they are converted into standard coal with the conversion factors of 10,000 m3 of natural gas = 13.3 tons of standard coal, 1 ton of LPG = 1.7143 tons of standard coal, and 10,000 kWh of electricity = 1.229 tons of standard coal, and finally the data are summed up to obtain the total energy consumption.
Research Methods
Time-Varying DID Model
Considering that the list of cities in the Pollution Information Transparency Index increased in 2013, referring to the study of Beck et al. [51], the article uses the time-varying DID model to study the impact of EID on CO2. The Time-varying DID model was constructed as follows.
where i denotes city, t denotes year, Z denotes control variables, μ is the individual fixed effect, τ is the time fixed effect, and ε denotes random error term.
Mediating Effect
If the effect of X on Y is achieved through the variable M, then M is said to be the mediator variable. In this paper, green technology innovation and energy intensity are used as mediator variables to explore the channels of the effect of EID on CO2. The mediating effect model is expressed as follows.
where M denotes mediating variables. φit, φit are random perturbation terms, respectively. The remaining variables are explained as previously.
Data Description
This article selects city-level data in China from 2006 to 2020 for research. The data used in this article are mainly from the EPS database, city statistical yearbooks, and the National Intellectual Property Administration. Among them, the number of green invention patent applications is obtained from the National Intellectual Property Administration, and the rest of the data required are obtained from the EPS database, supplemented by the city statistical yearbook data. The relevant data are matched and integrated by city name and year, and the data with badly missing information are eliminated, and the data of 282 cities are obtained in total.
Considering that if a balanced subset of panel data is extracted from the unbalanced panel data and subsequently processed, some of the sample capacity is lost and the estimation efficiency is reduced. If the artificially “dropped” individuals are not completely random, the randomness of the sample will also be destroyed. In addition, unbalanced panel data do not affect the within estimator [52], so this paper uses unbalanced panel data for regression to ensure a representative sample.
Results and Discussion
Results of Time-Varying DID Model
The article uses the Time-varying DID model for testing, and the regression results are shown in Table 1. According to Table 1, the coefficient of PITI is significantly negative regardless of whether the control variables are added or not, indicating that EID reduces CO2 emissions. After considering factors such as regional economic development and industrial structure, the regression coefficient for PITI is -0.1256. This implies that cities implementing the EID policy reduce CO2 emissions by an average of 0.1252 percentage points compared to cities that not implementing the EID policy. And this finding provides preliminary evidence for hypothesis 1.
The regression results show that EID reduces CO2 emissions. Possible reasons for this policy effect are that EID strengthens the environmental supervision of pollution sources and imposes penalties on enterprises that violate emissions, which reduces pollutant emission behavior to some extent. In addition, under the constraint of the goal of high-quality economic development, cities carry out environmental credit evaluations for enterprises with high total pollutant emissions, high environmental risks, and high ecological impact, and urge emission units to rectify the situation, which helps reduce CO2 emissions. In this process, heavy polluting enterprises may accelerate equipment renewal, purchase energy-saving and environmental protection equipment, reduce the intensity of fossil energy use, and thereby reduce CO2 emissions by improving production processes. However, the above hypothesis needs further empirical testing.
Robustness Tests
Parallel Trend Test
The parallel trend assumption is an important premise of DID [53]. To test the difference between the time trend of the treatment group under the policy intervention and the control group, referring to Jacobson et al. [54], the article adopts the event study method for examination and plots the dynamic effect coefficients, as shown in Fig. 1. Fig. 1 demonstrates the significant divergence of CO2 emissions between the control and treatment groups before and after the policy. According to Fig. 1, the CO2 emissions of cities in the treatment group decreased significantly after the implementation of EID relative to the control group, and there was a one-year lag in the policy effect. The above results passed the parallel trend test and verified the validity of the DID model.
Replacing the Dependent Variable
Considering that the CO2 emissions data used in the article are calculated, the results may be biased. Referring to Zhong et al. [32], the article uses sulfur dioxide to measure urban pollutant emissions and regresses the model, and the results are shown in columns 1 and 2 of Table 2. According to Table 2, the PITI coefficients in columns 1 and 2 are still significantly negative, indicating that EID significantly reduces urban pollutant emissions, which verifies the robustness of the above findings from the sideline.
Substitution of Independent Variables
Considering that the binary used in this paper may not adequately capture the quality of environmental information disclosure in cities, we further adopt the Pollution Information Transparency Index published by the Institute of Public and Environmental Affairs (IPA) as an alternative policy variable and re-run the regression using a two-way fixed effects model. It is important to note that the cities published by IPA are limited in number and time, resulting in a small number of observations. The regression results are presented in columns 3 and 4 of Table 2. According to the regression results, the coefficient remains significantly negative, with a value of -0.0266. This indicates that the carbon emissions of the cities that have disclosed the environmental information index are lower than the non-disclosed cities by an average of 0.0266 percentage points. This finding confirms hypothesis 1.
PSM-DID
In the article, considering that there may be potential differences between pilot and non-pilot cities, referring to Guo et al. [55], the PSM-DID model is selected for robustness testing to avoid endogeneity problems caused by selectivity bias. Mismatched samples were excluded and regressed again based on the use of one-to-one nearest neighbor matching, and the results are shown in columns 5 and 6 of Table 2. According to the regression results, the PITI coefficient is significantly negative, indicating that there is no significant difference between the regression results of the treatment group and control groups after matching. With the control variables and other aspects being the same, the regression coefficient of PITI is -0.1124. This means that the carbon emissions of cities with EID policy are reduced by 0.1124 percentage points on average relative to those without EID policies, this confirms hypothesis 1 again.
Excluding Low-Carbon Policies’ Interference
As it is known, China implemented the Low-carbon City Pilot Policy and the Carbon Emission Trading Pilot Policy in 2010 and 2013, respectively. To avoid the impact of the above policies on CO2 emissions, the article further excludes the above pilot cities and re-runs the regressions, and the results are shown in columns 7 and 8 of Table 2. According to the regression results, after including control variables, the coefficient of PITI is significantly negative at the 1% level, and the value is -0.1617. This indicates that the carbon emissions of cities that disclose environmental information are 0.1617 percentage points higher than those of cities that do not disclose, which again verifies hypothesis 1.
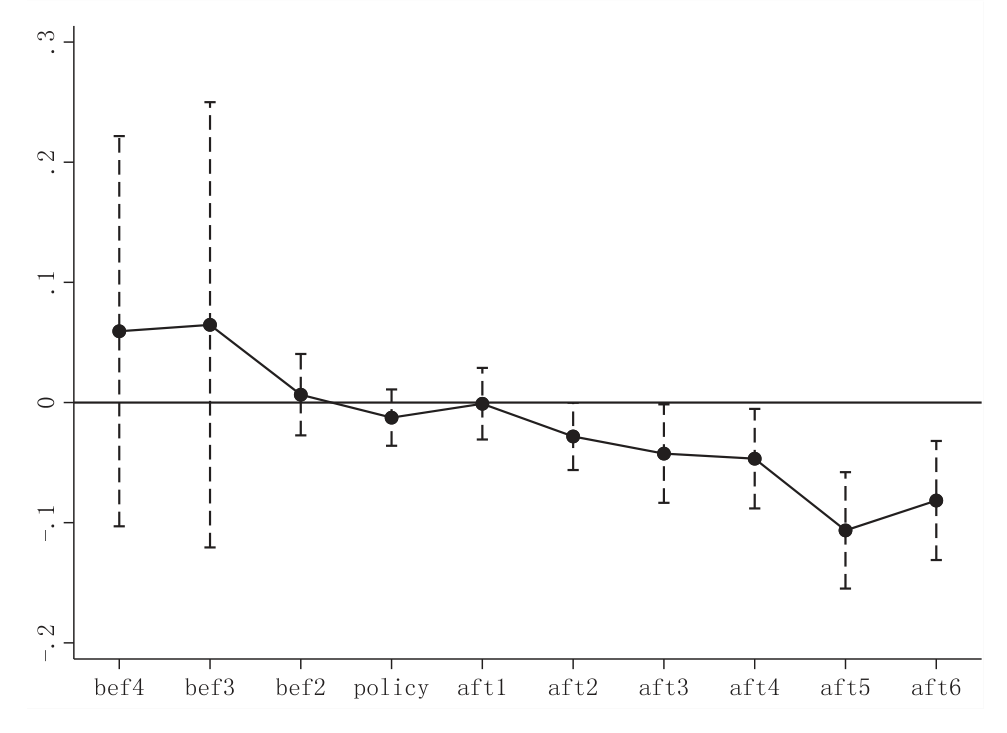
Table 2.
Robustness tests.
Placebo Test
To avoid the impacts of other unobservable factors, 120 cities were randomly selected from 282 cities as the “pseudo” treatment group, and the remaining cities were used as the “pseudo” control group to re-run the DID model regression. To avoid the disturbance of small probability events, the article conducted 500 random samples and extracted the coefficients of PITI to plot the kernel density [56], as shown in Fig. 2. According to Fig. 2, the estimated coefficients are approximately nomically distributed and the mean value is approximately 0, which is significantly different from the original estimated coefficient -0.1252. The analysis shows that the DID estimation results are not disturbed by omitted variables or other policies, which again verifies the robustness of the original regression results.
Heterogeneity Analysis
The preceding section examines the effect of EID on CO2 and provides evidence of robustness. However, it remains to be answered whether this emission reduction effect is heterogeneous with regard to differences in city location and low-carbon policy intensity. The article develops a heterogeneity analysis in two dimensions: regional and low-carbon policy intensity.
Regional Heterogeneity
To investigate the regional heterogeneity of the effect of EID on CO2 emissions, according to the criteria of China’s Seventh Five-Year Plan in 1986, this paper divides 282 cities into three economic zones, namely, Eastern, Central and Western. Then, we conduct DID estimation, the results are shown in Table 3. According to Table 3, after considering the control variables, the coefficient of PITI is significantly negative only in the eastern and western regions, which indicates that EID has a stronger effect on CO2 emissions in the eastern and western regions. This may be because the central region has eight major coalfields such as Datong and Ningwu, which are the production and export bases of many energy raw materials and thus have higher pollutant emissions. In addition, the central region has undertaken a large number of industrial transfers from coastal areas, and the jurisdiction has a high proportion of secondary industries and high carbon emissions. The EID, as a voluntary environmental regulation, is not restrictive and incentivized, and thus has a limited impact on CO2 reduction.
Heterogeneity of Low-Carbon Policy Intensity
To examine whether there is heterogeneity in the effect of EID on CO2 emissions in terms of low-carbon policy intensity, this paper divides cities into three groups according to whether they have implemented a Low-carbon City Pilot Policy and a Carbon Emissions Trading Pilot Policy, and then performs regression estimation, the results are shown in Table 4. According to Table 4, cities that have implemented a single low-carbon policy show insignificant PITI coefficients, while cities with dual regulation exhibit the highest absolute coefficients. This indicates that EID can significantly reduce CO2 emissions when no or multiple low-carbon policies are implemented. This may be because, in the absence of low-carbon policies, EID serves as a voluntary regulation that increases the micro-level entities’ awareness of carbon emissions and helps lower CO2 emissions. In regions where there is a dual effect of policy constraints, EID exhibits the strongest carbon reduction effect. This is likely due to the combined influence of three types of environmental regulation: command-and-control, market-based incentives, and voluntary measures. Under these triple constraints, micro-level entities have a stronger motivation to reduce emissions to lower production costs and improve economic efficiency.
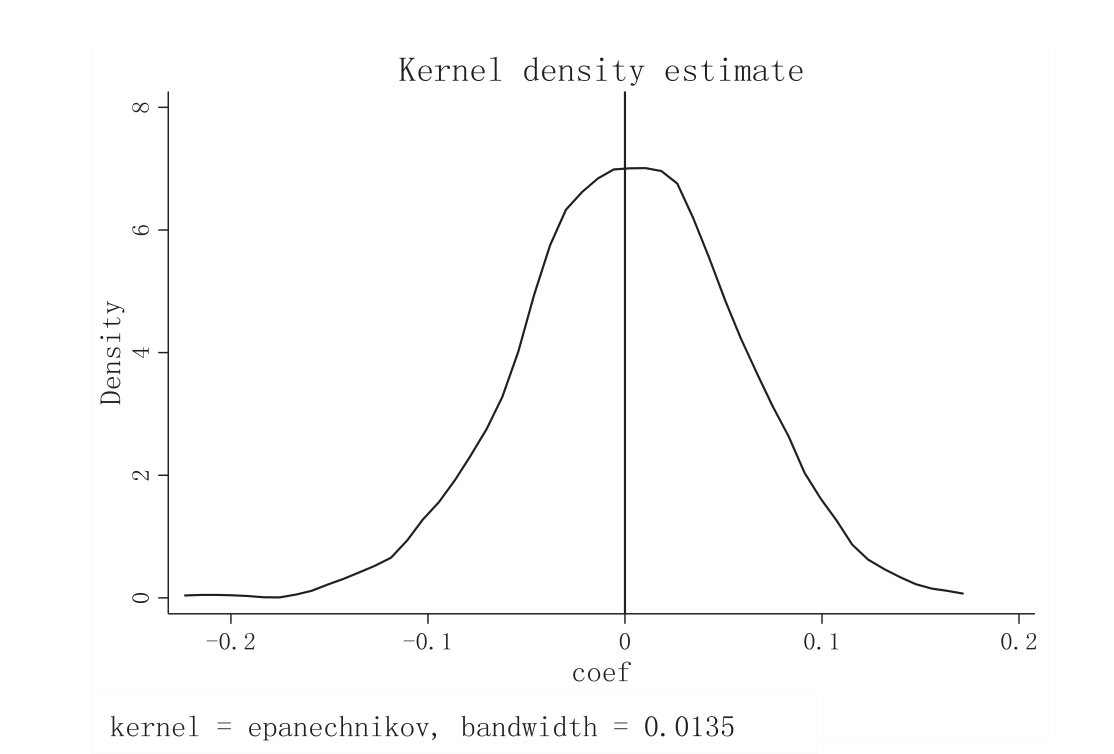
Table 3.
Regional heterogeneity.
Table 4.
Heterogeneity of low-carbon policy intensity.
Mediating Effect
According to the previous hypothesis, the article considers green technology innovation and energy intensity as mediating variables and uses Bootstrap model to explore the function of the two in EID on CO2 emissions, and the regression results are shown in Table 5.
Lines 1 and 2 of Table 5 show the results of the mediation test for green technology innovation. The confidence interval of the indirect effect does not contain 0, indicating that the mediating effect is significantly present and the proportion of the mediating effect to the total effect is about 27.14%, which verifies hypothesis 2.
The results of the mediation test for energy intensity are presented in lines 3 and 4 of Table 5. Among them, the confidence interval of the indirect effect does not contain 0, indicating that the mediating effect is significantly present, and the percentage of the mediating effect in the total effect is about 17.94%, which verifies hypothesis 3.
The above analysis only verifies the existence of mediating variables, but how EID affects the mediating variables and how it affects CO2 emissions through mediating variables has not been answered. To clarify the above questions, the article further analyzes by the stepwise regression method, and the results are shown in Table 6.
In Table 6, (1), (2), and (3) are the results of the three-step regression with green technology innovation as a mediating variable. In the first step, the coefficient of PITI is significantly negative, which indicates that EID can reduce CO2 emissions. In the second step, PITI is positive and passes the significance test, indicating that EID can promote green technology innovation. The coefficient of GI in the third step is significantly positive, which indicates that CO2 emissions decrease with the increase of green technology innovation in the policy context of EID. According to the judgment condition of the three-step test, EID can reduce CO2 emissions by promoting green technology innovation, which again verifies H2.
Table 5.
Mediation mechanism tests.
Table 6.
Stepwise regression tests.
Columns (1), (4), and (5) of Table 6 show the results of the three-step regression with energy intensity as a mediating variable. In column (4), the coefficient of PITI is significantly negative, indicating that EID can reduce energy use intensity. In column (5), the coefficient of EI is significantly positive, indicating that CO2 emissions increase with energy intensity in the policy context of EID. In other words, EID can reduce CO2 emissions by reducing energy use intensity, again verifying H3.
Discussion
The contribution of formal environmental regulations on carbon emission reduction in China has been confirmed at the macro, meso and micro levels [57-59], but studies on informal environmental regulations are still late, few, and from a single perspective, and the effect of informal environmental regulations on carbon emission reduction has not been verified at the city level. We speculate that the reason for the results is that formal environmental regulations are enforced by the government “from the top down”, which are mandatory and binding and have a more observable effect on carbon emission reduction, causing scholars to overlook the role of informal environmental regulations represented by Environmental Non-Governmental Organizations (ENGOs). In addition, the effectiveness of informal environmental regulation is difficult to measure, and therefore, it is difficult to quantify. So, this paper treats the implementation of EID as a quasi-natural experiment and uses a Time-varying DID model to verify the effect of EID on CO2 at the city level.
As an informal environmental regulation, EID is a manner for the government or enterprises to proactively disclose their environmental impacts and environment-related information to the outside, and accept the supervision of social organizations and the public. Given that EID reveals the usage of environmental resources and the management of environmental pollution, the implementation of this policy is usually considered effective for pollution management [60], and the findings of this study are consistent with that conclusion. In the context of the effects that have already worked, exploring the transmission path of EID to CO2 becomes a critical issue for discussion. We consider that EID as an informal type of environmental regulation, has a significant trickle-down effect on green technological innovation and energy intensity. Under the cumulative causal effect, the reduction of CO2 is effectively secured by technological progress and clean energy use.
The central region of China is the site of eight major coalfields, and the superimposed effect of multiple environmental regulatory policies is stronger. Therefore, in the empirical results, the carbon reduction effect of EID is not significant in the central region, and is strongest in the cities with multiple policy overlays.
Conclusions & Policy Recommendations
In this study, we use panel data of 282 cities in China from 2006 to 2020, evaluate the carbon reduction effect of EID by a Time-varying DID model, and analyze the mechanism and the heterogeneity of its impact under different regional and low-carbon policy intensities. The results suggest the following conclusions. EID can reduce carbon emissions, and the conclusion remains robust after a series of robustness tests. From the perspective of regional heterogeneity, this CO2 reduction effect is more prominent in the eastern and western regions. And the reduction effect is more apparent in cities than that do not implement low-carbon policies and multiple policy combinations. In addition, green technology innovation and energy intensity are important mechanisms, and this policy can reduce CO2 emissions by promoting green technology innovation and reducing energy use intensity.
Policy Recommendations
Some policy recommendations can also be drawn from the findings of this research.
(1) Expand the scope of EID in an orderly manner and utilize the role of informal environmental regulation in carbon emission reduction. Specifically, it means including more cities in the public list of EID. By disclosing environmental pollution information, emissions from key enterprises, and other relevant information, the pressure for environmental governance is shifted to the market and businesses while regulatory pressure is delegated to local governments. This dual approach can effectively reduce CO2 emissions.
(2) Place greater emphasis on the green technology innovation and energy intensity. Firstly, prioritize the role of green technology innovation. Under the goal of Carbon Peaking” and “Carbon Neutral” in China, cities should actively build high-tech development zones and create innovative incubators to foster a favorable environment for green technology innovation by enterprises. Additionally, governments at all levels can introduce favorable policies that reduce the cost and risk of green technology innovation, thereby stimulating the enthusiasm for innovation among companies. Secondly, improve the energy structure and reduce the intensity of fossil fuel usage. The government can promote the use of clean energy and develop solar energy, geothermal energy, wind energy, hydropower, biomass energy, etc., in a location-specific manner to optimize the energy structure and gradually shift away from China’s heavy reliance on coal as a primary source of energy consumption.
(3) Develop differentiated EID guidelines based on location and policy stringency. Firstly, for the central regions rich in coal resources, emphasis should be placed on mining industry disclosure guidelines. Efforts should be made to accelerate green coal mining, develop and utilize green mining technologies, replace outdated and inefficient capacity, and achieve key technological breakthroughs in coal utilization for power generation, smelting, and other industries to reduce energy consumption and improve efficiency. Secondly, employ a combination of formal and informal environmental regulations. With the comprehensive launch of China’s carbon trading market and the constraints of the dual carbon targets, the government should adopt a balanced approach and design macro policies for carbon reduction and emissions control to enhance environmental quality.
Although this study provides useful theoretical and empirical evidence, some limitations deserve further study. The focus of this study is on city-level data in China. Future research can expand this study to other countries and compare the differential impacts of environmental information disclosure on carbon reduction across different nations. Furthermore, it would be beneficial to conduct interviews with experts from the IPE in China and Natural Resources Defense Council (NRDC) in the United States to obtain more intermediary channels and enrich relevant research.

