Introduction
Economically maize and sugarcane are considered important crops worldwide and provide vegetable protein for millions of people. The food crops, such as maize, sugarcane, and rice, primarily provide for the world's fundamental dietary requirements [1]. Among the most extensively grown crops globally, maize produced 1161 metric tons (MT) in 2022, followed by sugarcane (177 MT) [2], while in Pakistan maize (10.3 MT) and sugarcane (78.5 MT) [3]. The diet of farm animals, especially proteins, is of plant origin; maize products play a significant role in this regard. Asia, Europe, Africa, and America are the most prominent growers of maize crops, while the EU and China import most of the sugarcane [4, 5].
Heavy transport load on roads is one of the major sources of generating heavy metals [6]. Dust comprises dense and tiny particles and a very fine state of division so that the particles are small enough to be carried away by the wind. Heavy metals present in dust may originate from car exhausts, tear and wear of tires, and vehicular emissions, which are less manageable and can cause heavy metal contamination in roadside dust [7]. Road dust contaminated with metals is subject to a variety of stationary and mobile sources, including vehicle emissions, industrial facilities, oil burning, power plants, waste incineration, demolition, and construction activities [8, 9]. Zinc (Zn) and cadmium (Cd) metals come from tire scuffs, lubricants, manufacturing, and furnace emissions, while lead (Pb) is known to discharge through leaded gasoline and engine oils [10, 11]. The copper (Cu) and nickel (Ni) end up in road dust through the corrosion of automobile parts [12].
Plant behavior changes under air pollution, showing various damaging signs like disability and premature maturation [13]. High road traffic generates road pollution that adversely affects the morphology and physiological parameters of plants that grow along the roads [14]. The gases emitted from vehicles influence plant growth and have toxic effects on human health as well [15]. The dust particles emitted from these sources contain various heavy metals, which affect plant physiology and growth [16, 17]. These dust particles have a diameter of less than 50 μm and cover long distances due to low density and stick to the leaves of plants, [18] while heavier and coarse particles deposit on the soil [19].
Dust particles adhered to leaf surfaces are influenced by plant morphological characteristics such as texture, leaf size, and hair, in addition to the quantity and sources of dust pollutants [20]. The long-term deposition of dust particles affects plant growth and development by disrupting the photosynthetic ability of plants [21, 22]. It may also lead to possible alteration in morphological characteristics like damaging root structure, cell membrane, concentration of photosynthetic pigments, and damaging antioxidant process of leaves [23]. The dust causes clogging of leaf stomata or even a reduction in stomatal conductance, [24, 25] or sometimes dust causes leaf shedding [26]. Aerial parts of plants are directly damaged by dust, and particle size decides the leaf injury, whereas plants have different tendencies to capture dust particles from the air [27].
The antioxidant defense may get seriously out of balance as a result of the metal-contaminated dust stress in the cell compartment [28]. Plants have a variety of enzymatic and nonenzymatic defense mechanisms to lessen the damaging effects of the oxidative state in the cell. The enzymatic antioxidants, superoxide dismutase (SOD), peroxidase (POD), and catalase (CAT) safeguard the cells from distinct heavy metal injuries [29]. When the antioxidant defense mechanism is overworked, the cell membranes experience oxidative stress [30]. To avoid this, metal ion reduction must be stopped [31]. To assist plants in surviving the harmful effects of ROS in the cell, catalase and peroxidase convert hydrogen peroxide (H2O2) into water and oxygen [32, 33].
This study was designed (1) to assess the impact of dust particles on the growth parameters, antioxidant enzymes, and physiological attributes, (2) to assess heavy metals in root, shoot, and leaf influenced by foliar applied dust, and (3) effects of heavy metals-contaminated dust on soil physical and chemical properties.
Materials and Methods
Dust Collection for Foliar Application
The dust samples were collected from different distances at the road edge, i.e. 0, 10, 60, and 120 meters from the M4 motorway. The Sargodha road interchange at Faisalabad, Pakistan, was selected for four dust sample collections due to the high traffic load and high vehicular emissions. Four plain plastic sheets of known weights were placed daily from 6 am to 6 pm for a week at selected points to collect the dust samples. The dust deposited on the sheets was collected, weighed, and tagged according to their weight. Dust collected from 0, 10, 60, and 120 m distances were 44, 39, 24, and 9 g, respectively, and pre-analyzed for heavy metals concentration (Table S1).
Soil Collection and Characterization
The normal (0-15 cm) soil was collected from the research area of the Institute of Soil and Environmental Sciences (ISES), University of Agriculture Faisalabad (UAF), Pakistan. Before pot filling, the soil was air dried, grounded, and sieved with a 2 mm sieve. The physical and chemical characteristics of the soil were determined (Table S2), including soil texture [34], soil saturated paste pH (pHs), soil electrical conductivity (ECe) [35], soil available heavy metals (ammonium bicarbonate-diethylene triamine penta-acetic acid (AB-DTPA) extractable) [36], and dust and soil total heavy metals were determined by aqua regia method [37].
Pot Experiment
A pot experiment was conducted in the glasshouse (size 20 × 40 ft) to avoid the wind effect that blows away applied dust to plant surfaces. The five treatments (control and 4 levels of dust application) and three replicates of each treatment were applied to both test crops. Sieved soil (10 kg) was filled in each pot and each pot received dust (44, 39, 24, and 9 g). Eight seeds per pot of Maize (Ghoar-19) were sown with the dry sowing method. The maize seedlings underwent a thinning after 15 days, which left only four plants per pot. However, sugarcane (CPF -251) was sown in pots with three pieces of sugarcane sticks in each pot. Maize and sugarcane crops were fertilized with recommended doses of NPK for maize (92-58-37 kg/ha) and for sugarcane (227,143 and 91 kg/ha). The N was administered in three equal doses, phosphorus (P) and potassium (K) were applied immediately. The first irrigation of sugarcane was given immediately after sowing with tap water, while the maize crop was irrigated after ten days of germination. Subsequent irrigation was given according to the crop water requirements. Every seven days, or until crop maturity (12 weeks), the collected dust from distances 0, 10, 60, and 120 m from the M4 motorway was applied with hand to the maize and sugarcane plants growing in pots. Following fifteen days of crop germination, foliar dust spraying was initiated.
Harvesting and Samples Collection
The maize crop was harvested after 80 days of germination, while the sugarcane was harvested after 120 days. Maize and sugarcane agronomic data and physiological parameters were recorded after an interval of 40 and 80 days. After crop harvest, the samples were cleaned with distilled water; the shoots and roots were then heated at 65°C for constant weight and dry weight measurements. Leaf area was calculated as:
Leaf Area = Lenght of leaf × Leaf width × C.F.
C.F. representing a constant factor of 0.75.
Physiological Parameters
On maize and sugarcane leaves, physiological parameters including photosynthetic rate (mol of CO2 m-2 s-1), transpiration rate (m mol O2 m-2 s-1), stomatal conductance (m mol H2O m-2 s-1) and internal CO2 concentration (µ mol mol-1) were recorded using, portable LI-6400 XT infrared gas analyzer (Li-Cor) with a fluorescence chamber (LI6400-40) that served as an illumination source. The chlorophyll contents were measured using a SPAD meter (SPAD-502, Konika Minolta Detecting, Japan).
Antioxidant Enzymes Assay
A tissue grinder was used to extract the enzymes from 0.5 g of fresh leaf samples, which were then crushed in 5 ml of 50 mM cooled phosphate buffer (pH 7.8) before being submerged in an ice bath. Centrifuging the homogenate for 20 minutes at a speed of 32953× g at 4°C. The supernatant was used for the determination of antioxidant enzymes. The superoxide dismutase (mg- 1 protein) activity was measured through the Spitz [38] technique. The following were inserted in cuvettes, 0.05 ml riboflavin, 0.1 ml L-methionine, 0.1 ml triton X, 0.05 ml NBT, 0.4 ml distilled water, 1 ml potassium phosphate buffer, and 0.05 ml sample extract. The absorbance of sample solutions was measured at 560 nm. Moreover, the Chance [39] technique was followed for peroxidase (mg-1 protein), and the following materials were added as 0.1 ml reaction mixture with peroxidase activity, 0.1 ml guaiacol, 0.1 ml hydrogen peroxide, 50 microliters of maize and sugarcane leaves sample extract and 750 microliters of phosphate buffer. The absorbance at 470 nm was noticed for 0, 30, 60, and 90-second intervals. However, for catalase determination, the Chance [39] method was the most efficient for assessing enzymatic activity. The absorbance was taken at 240 nm with the 0, 30, 60- and 90-second intervals by adding 1.9 ml chilled potassium phosphate buffer, 1 ml H2O2, and 1 ml extract of plant sample in the cuvette. The spectrophotometer Model 6850, Jenway, USA, which assessed various sample absorbances used to analyze antioxidant enzyme concentrations.
Determination of Plant Heavy Metals Concentrations
Di-acid (HNO3+HC1O4) was used for the plant sample (0.5 g) digestion [40] The samples were digested on a hot plate; the temperature of the hot plate was gradually ramped to 140°C and heated until white fumes appeared. After cooling, the digested plant samples were filtered, and 50 mL volume was made by adding distilled water. The Cd, Cu, Ni, Pb, and Zn concentrations in roots, shoots, and leaves were determined using an atomic absorption spectrophotometer.
Post-Harvest Soil Sampling and Analysis
After plant harvesting, soil samples were taken, air-dried, and sieved using a 2 mm size sieve. The soil total and available Cd, Cu, Ni, Pb, and Zn concentrations were measured as described by Shehzad et al. [37]. Briefly, the dust and soil samples (0.5 g) were wet digested using a mixture of HNO3 and HCI (3:1 v/v). The sample was taken in the 100 mL Pyrex digestion flask added with 10 ml aqua regia mixture and heated on a hot plate at a temperature of 150°C for 30 min. The Soltanpour [36] technique was used to identify the available metals in soil. For the AB-DTPA (ammonium bicarbonate-diethylenetriaminepentaacetic acid) extractable concentration of heavy metals, 1 g soil in a polypropylene centrifuge tube filled with 20 mL of freshly made extractant solution (left uncovered while the suspension agitated for 15 min) was centrifuged at 3000 rpm for 15 min. After some time, the solution was filtered with Whatman filter paper 42 and stored in a plastic bottle for further proceeding. An atomic absorption spectrometer (Solar S-100, Thermo Electron, USA) was used to determine the heavy metals concentrations.
Statistical Analysis
The CRD design with three replicates of each treatment was used in the statistical analysis of the obtained data by applying the analysis of variance (ANOVA) method and Tukey HSD; tests for multiple comparisons of treatments and principal component analysis were performed using the R studio.
Table 1.
Effect of foliar applied metals contaminated dust on growth parameters of maize and sugarcane crops.
Results
Growth Parameters of Maize and Sugarcane
Foliar application of collected dust from the M4 motorway at different distances affected the crop's growth, as presented in Table 1. After the 40 days, the maximum leaf area (483 and 375 cm2) was recorded in control, whereas, the minimum leaf area (370 and 310 cm2) was recorded when the 44 g dust treatment was applied to maize and sugarcane crops, respectively. Maize and sugarcane shoot lengths (95 and 71 cm, respectively) and fresh weights (24 and 108 g, respectively) were recorded minimum in 44 g dust treatment, while control treatment showed maximum shoot length (158 and 120 cm, respectively) and fresh weights (148 and 128 g, respectively). However, after 80 days, the maximum leaf area of maize and sugarcane in control (no dust) was 645 and 575 cm2, while the lowest were 478 and 425 cm2, respectively under the 44 g dust treatment. Furthermore, the highest shoot lengths, 241 and 145 cm, and fresh weight, 190 and 165 g of maize and sugarcane were observed in the control treatment. Whereas minimum shoot lengths of 155 and 115 cm, and fresh weight, 156 and 127 g, were observed in 44 g dust treatment for maize and sugarcane, respectively. The results showed that the foliar application of dust with more mass significantly reduced the growth of both crops as compared to the control.
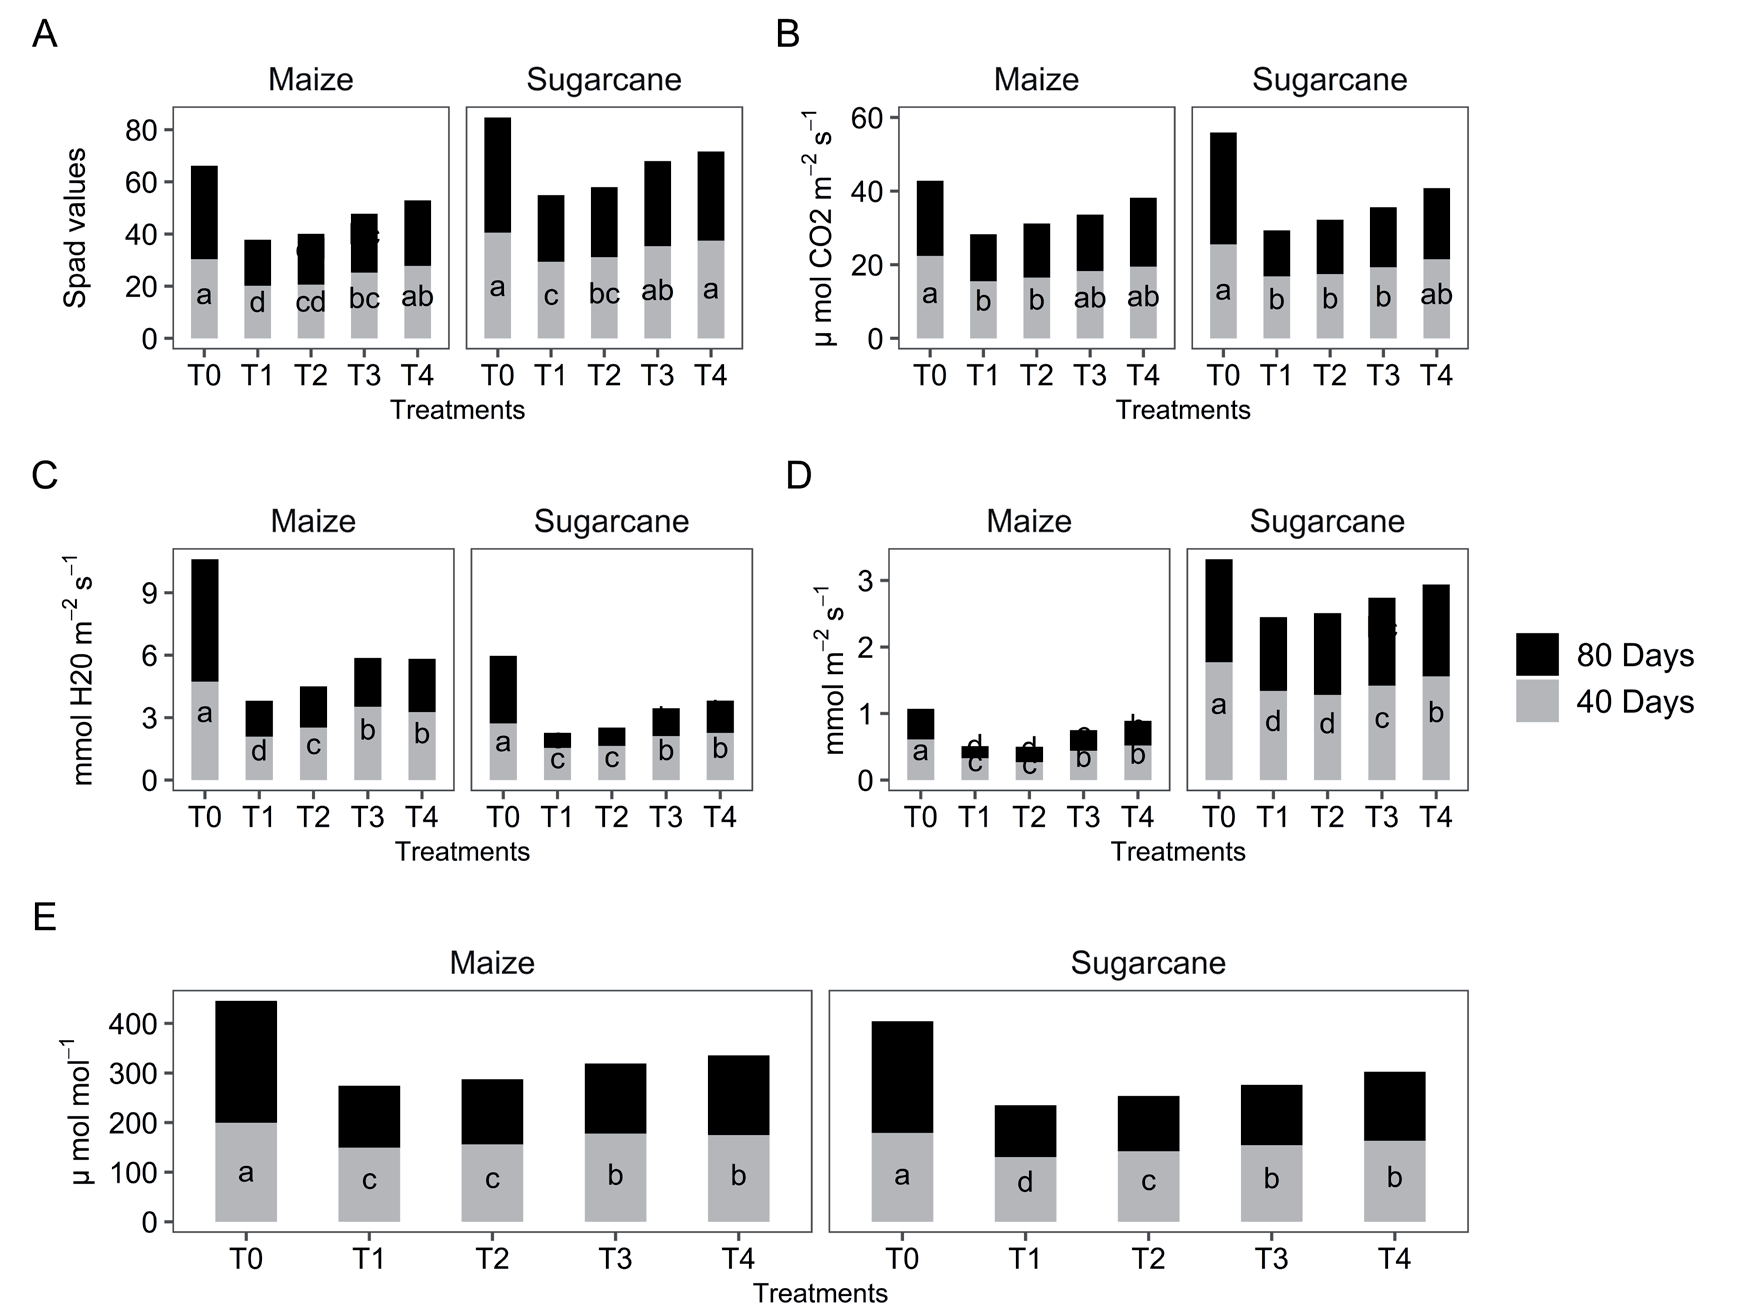
Fig. 1.
Effect of metals contaminated dust on maize and sugarcane plant physiology. Different letters represent significant differences among treatments (p≤0.05); A = Chlorophyll content; B = Photosynthic rate; C = Transpiration rate; D = Stomatal conductance; E = Internal CO2 T0 = Control; T1 = 44-gram dust; T2 = 39-gram dust; T2 = 24-gram dust; T4 = 9-gram dust All treatments were compared with the control (no dust)
Physiological Parameters of Maize and Sugarcane
The chlorophyll contents and gas exchange parameters of both crops are illustrated in Fig. 1. The foliar application of heavy metals containing dust decreased chlorophyll contents and gas exchange characteristics after 40 days of germination. The highest SPAD values (30.3 SPAD in maize and 40.3 SPAD in sugarcane) were recorded in control compared to the 44 g dust treatment, where maize showed 20.2 SPAD and sugarcane showed 29.5 SPAD values, which were minimum in all the applied treatments. Maize and sugarcane photosynthetic rate 15.5 and 16.8 µmol CO2 m-2 s-2, transpiration rate 2.9 and 1.55 mmol H2O m-2 s-1, stomatal conductance 0.27 and 0.72 mmol m-2 s-1 and internal CO2 149.6 and 130.5 μ m mol-1 recorded in 44 g applied dust were the minimum photosynthetic activities. A similar pattern was observed after 80 days. The chlorophyll content of maize and sugarcane in control (no dust) was 35.8 and 44.2 SPAD, while the lowest was 15.5 and 25.4 SPAD under the 44 g dust treatment, respectively. Maize and sugarcane photosynthetic rate 22.4 and 29.2 µmol CO2 m-2 s-1, transpiration rate 2.9 and 5.88 and 3.75 mmol H2O m-2 s-1, stomatal conductance 1.55 and 0.46 mmol m-2 s-1 and internal CO2 245.7 and 225.2 μ m mol-1 were recorded in 44 g dust treatment. The maximum decline was observed in the 44 g dust treatment, followed by the 39 g dust application rate, while the highest values were observed in the control, where no dust was applied.
Antioxidant Enzymes Activity in Maize and Sugarcane
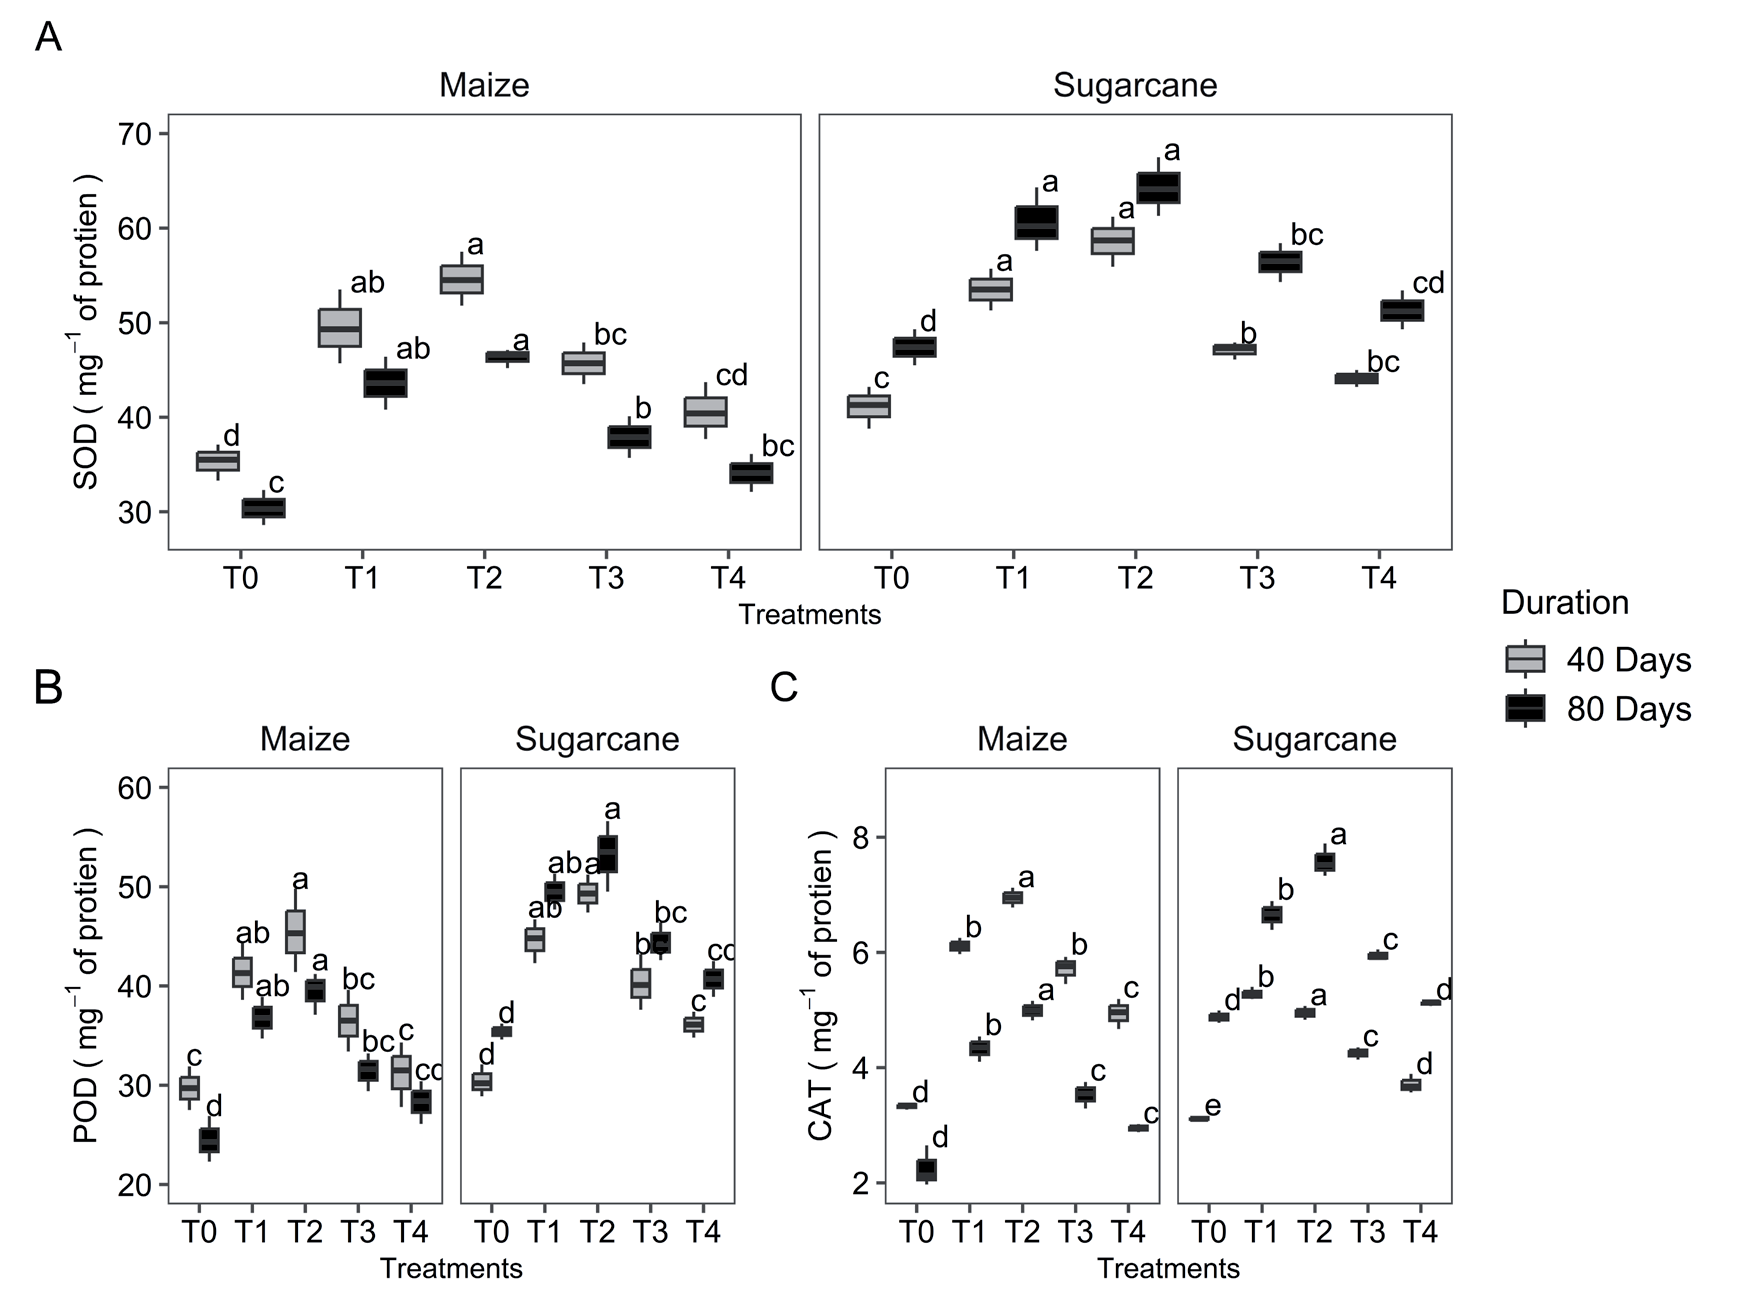
Foliar application of collected heavy metal-contaminated dust has affected the antioxidant enzymes activities in both crops (Fig. 2). After 40 days, the maize and sugarcane SOD, POD and CAT were 54.5 and 58.6, 43.2 and 49.3, 6.52 and 5.28 mg-1 of protein recorded in 39 g dust treatment, while control treatment showed minimum values were 35.3 and 42.2, 29.7 and 35.3, 6.52 and 5.28 mg-1 of protein. However, after the interval of 80 days, the maize and sugarcane SOD, POD, and CAT were 46.3 and 63.3, 39.3 and 53.5, 4.85 and 7.58 mg-1 of protein recorded in 39 g dust treatment, while control treatment exhibited minimum values were 30.2 and 47.4, 24.3 and 38.2, 4.52 and 3.28 mg-1 of protein. The enzymatic activity was boosted in the 39 g dust treatment, while the minimum was observed in the control treatment, where no dust was applied.
Fig. 2.
Effect of metals contaminated dust on antioxidant activity of maize and sugarcane plants. Different letters represent significant differences among treatments (p≤0.05); A = Superoxide dismutase; B = Peroxidase; C = Catalase. All treatments were compared with the control (no dust) T0 = Control; T1 = 44-gram dust; T2 = 39-gram dust; T2 =24-gram dust; T4 = 9-gram dust.
Heavy Metals Concentrations in Maize and Sugarcane
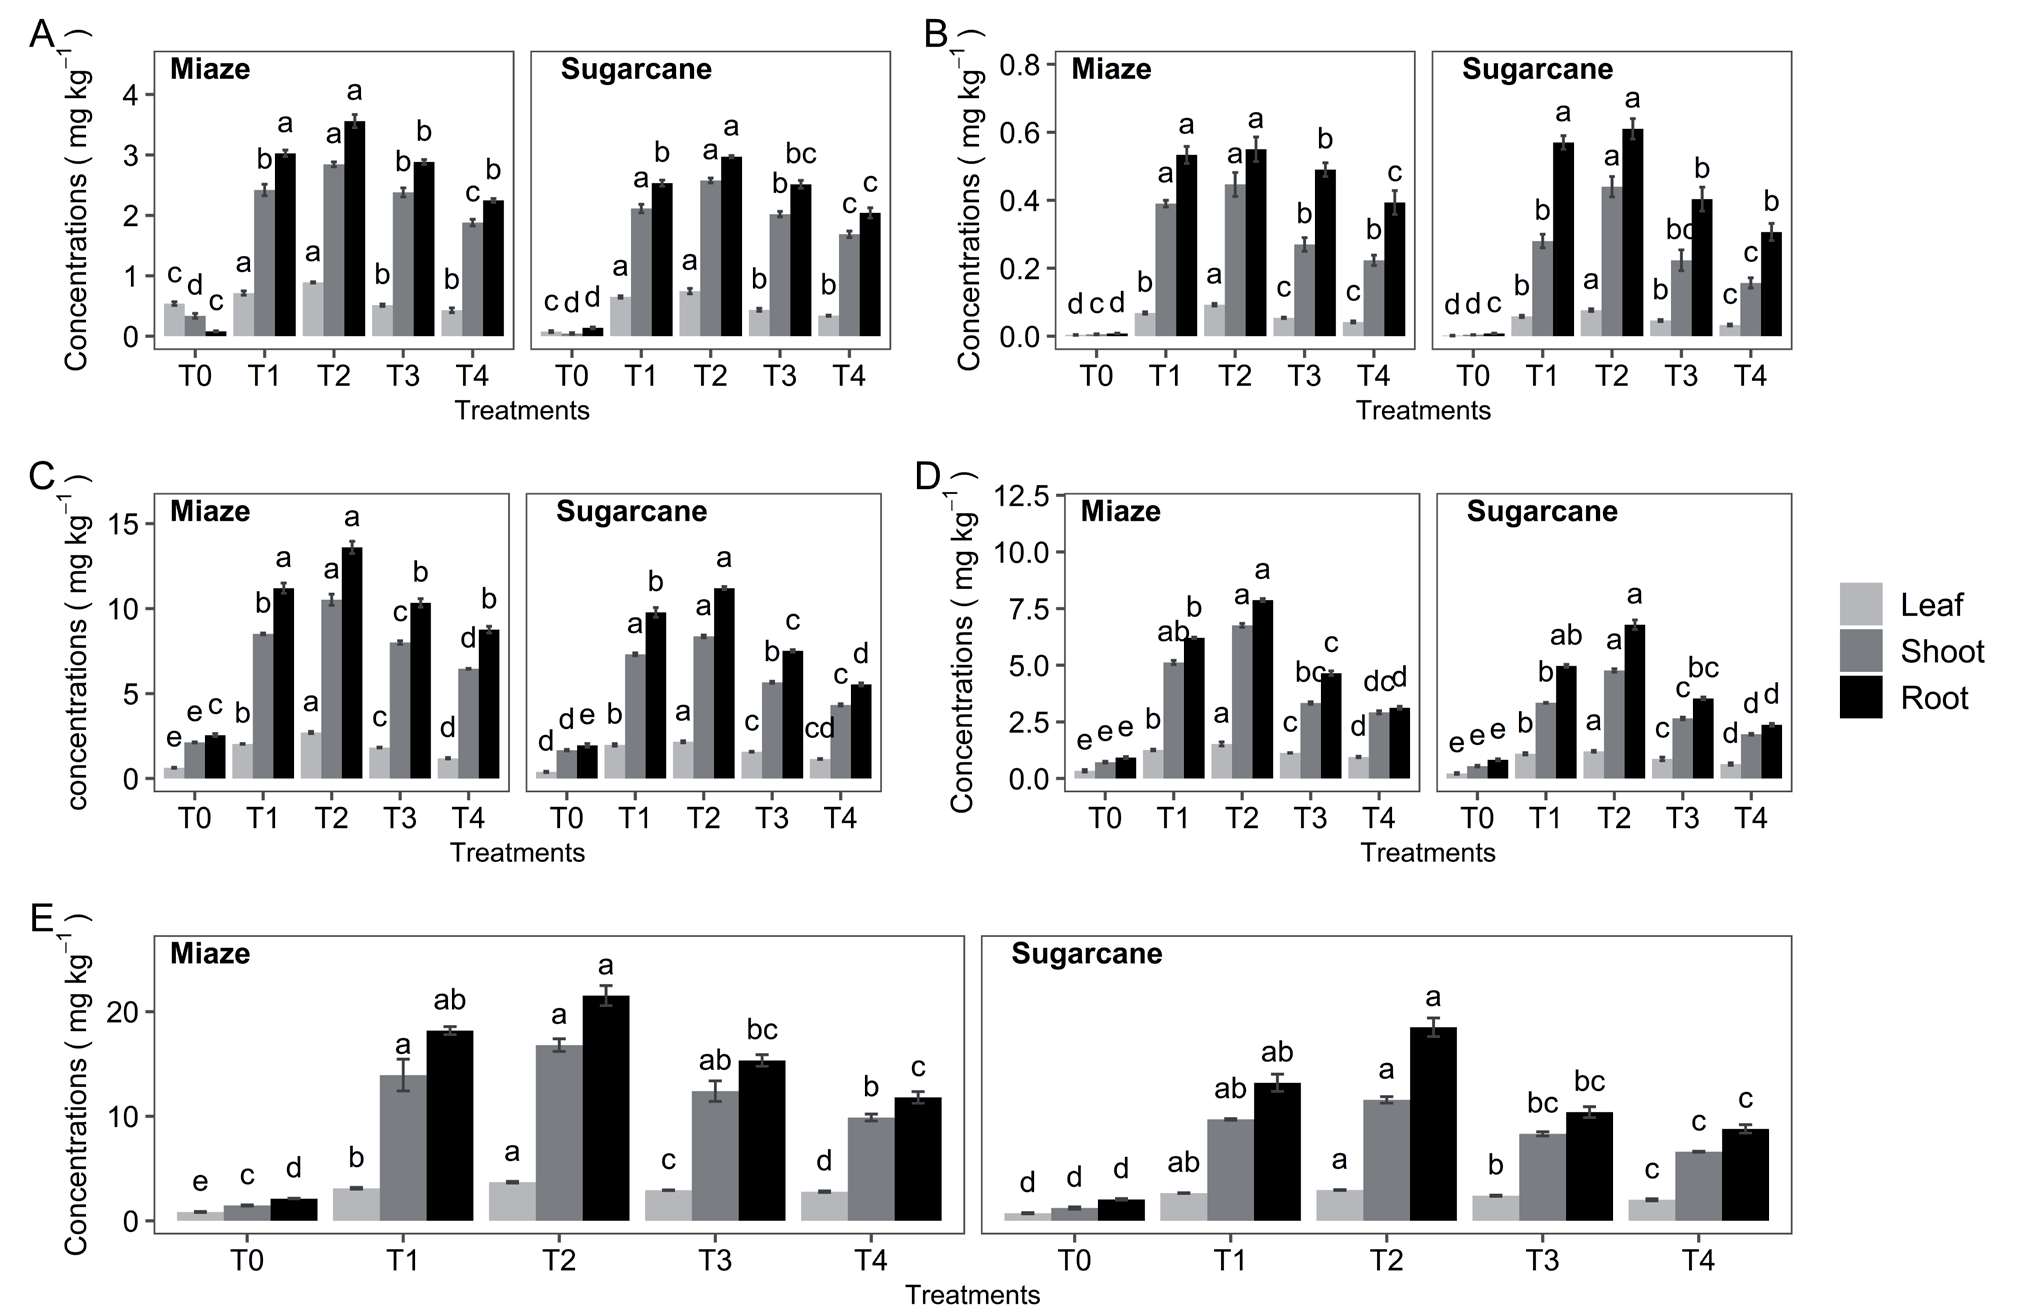
The heavy metals-polluted dust caused contamination in the leaves, shoot and root of maize and sugarcane (Fig. 3). Cadmium concentrations observed in maize and sugarcane plants were lowest (0.003 and 0.00 2 mg kg-1 in leaves, 0.03 and 0.04 mg kg-1 in shoot and 0.8 and 0.12 mg kg-1 in roots, respectively) in the control treatment where no dust was applied, while it was highest (0.092 and 0.076 mg kg-1 in leaves, 0.005 and 0.004 mg kg-1 in shoot and 0.75 and 0.62 mg kg-1 in roots, respectively) where 39 g dust was applied. The copper concentrations observed in leaves, shoot and root were 0.61, 2.12, and 2.55 mg kg-1 in control and 2.62, 9.75, and 13.7 mg kg-1 in 39 g foliar applied dust treatment to maize and 0.39, 1.67 and 1.196 mg kg-1 in control and 2.22, 8.3 and 11.2 mg kg-1, respectively in 39 g foliar applied dust treatment to sugarcane. The nickel concentration in maize and sugarcane leaves was 0.35 and 0.23 mg kg-1 in the control and 1.54 and 1.24 mg kg-1 in 39 g foliar applied dust treatment, in the shoot was 0.72 and 0.55 mg kg-1 in the control and 6.48 and 4.55 mg kg-1 in 39 g foliar applied dust treatment, and roots were 0.93 and 0.88 mg kg-1 in the control and 7.32 and 6.21 mg kg-1 in 39 g foliar applied dust treatment, respectively.
The lead concentration in maize and sugarcane leaves was 0.054 and 0.008 mg kg-1 in the control and 0.81 and 0.72 mg kg-1 in 39 g foliar applied dust treatment, in shoot was 0.03 and 0.04 mg kg-1 in control and 2.88 and 2.44 mg kg-1 in 39 g foliar applied dust treatment, and in roots was 0.8 and 0.12 mg kg-1 in the control and 3.22 and 2.94 mg kg-1 in 39 g foliar applied dust treatment, respectively. Data indicated that the maize and sugarcane leaves had accumulated minimum Zn concentrations (0.84 and 0.72 mg kg-1) in the control, whereas maximum Zn concentration (3.62 and 3.12 mg kg-1) was observed in the leaves of crops plants affected with the 39 g foliar applied dust. Similarly, the Zn concentration in the shoot of maize (1.48 mg kg-1) and sugarcane (1.22 mg kg-1) was minimum in control, while the maximum (16.5 and 11.4 mg kg-1) in 39 g foliar applied dust treatment. The minimum concentration of Zn stored in roots of maize and sugarcane was 2.12 and 2.02 mg kg-1, in the control treatment, while the maximum was 21.7 and 13.3 mg kg-1, respectively, in the 39 g foliar applied dust treatment.
Soil Basic Characteristics in Post-Harvest Soil
Foliar application of collected heavy metal-contaminated dust influenced the basic soil properties (Table S3). The soil pH was maximum (8.14 and 8.21) in the 39 g foliar applied dust treatment and minimum (7.55 and 7.06) in the control treatment of maize and sugarcane, respectively. Furthermore, the maximum soil EC 3.35 and 3.46 dS m-1 and SAR 5.82 and 5.91 (mmol L-1)1/2 was observed in post-harvest soil from the 39 g foliar applied dust treatment, whereas minimum EC of 1.78 and 1.92 dS m-1 and SAR 2.76 and 2.53 (mmol L-1)1/2 was observed in post-harvest soil from control treatment.
Fig. 3.
Heavy metals concentrations in plant tissue of maize and sugarcane. Different letters represent significant difference among treatment (p≤0.05); A = lead (Pb); B = cadmium (Cd); C = copper (Cu); D = nickel (Ni); E = zinc (Zn). All treatments were compared with the control (no dust) T0 = Control; T1 = 44-gram dust; T2 = 39-gram dust; T2 = 24-gram dust; T4 = 9-gram dust.
Heavy Metals Concentrations in Post-Harvest Soil
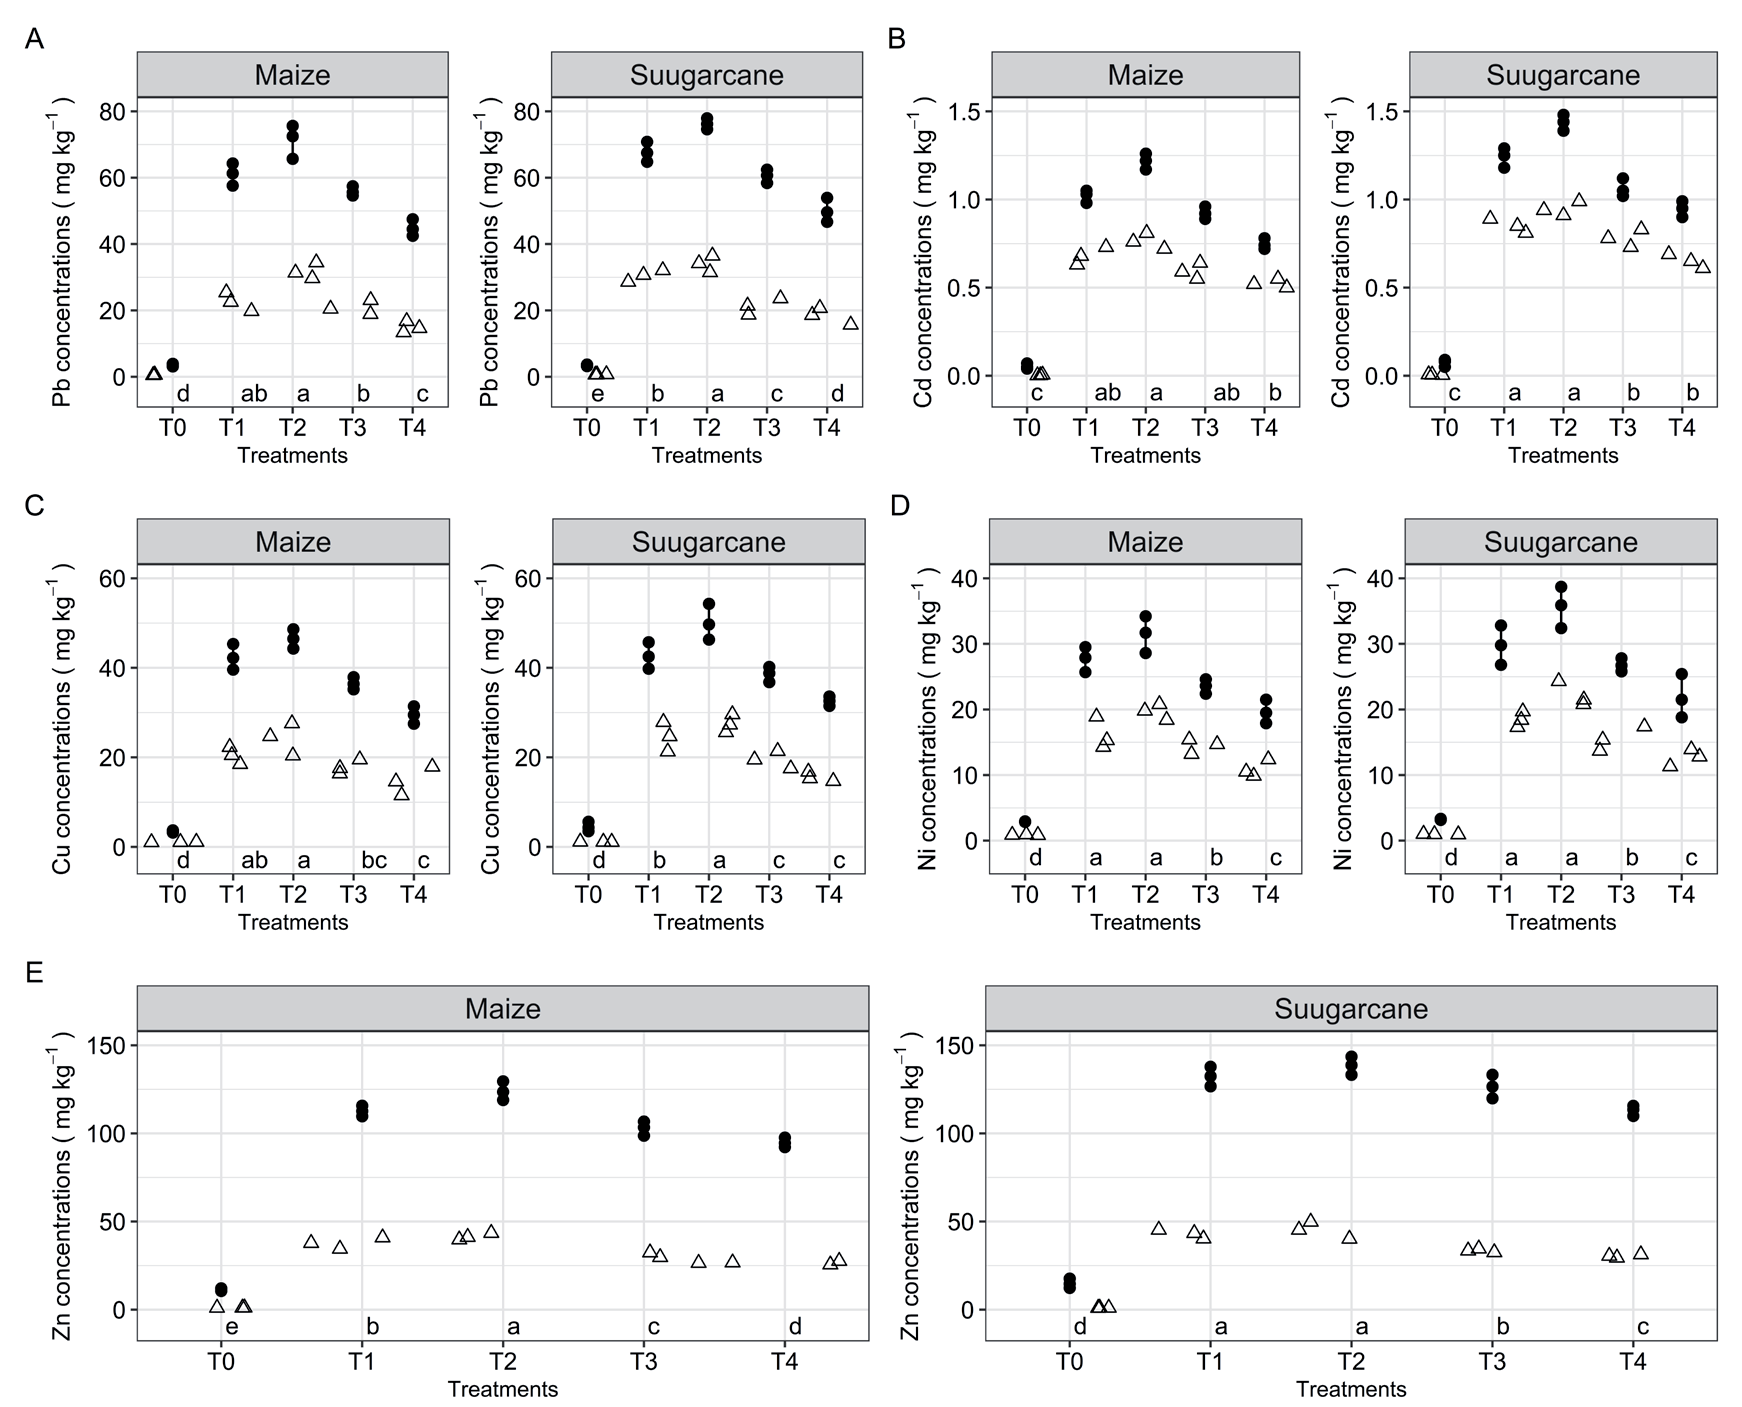
Heavy metal concentrations in post-harvest soil increased as the dust was applied foliarly as represented in Fig. 4. Data indicated that the post-harvest soil of maize and sugarcane had the lowest soil available Cd (0.003 and 0.002 mg kg-1) and total Cd (0.007 and 0.004 mg kg-1) in control, while highest soil available (0.76 and 0.96 mg kg-1) and total Cd (1.21 and 1.44 mg kg-1) were recorded in the soil with 39 g foliar applied dust. It was observed that the available (1.07 and 1.13 mg kg- 1) and total Cu (3.5 and 4.12 mg kg-1) concentrations in the post-harvest soil were minimum in the control, while maximum available (24.3 and 27.6 mg kg-1) and total Cu (46.6 and 49.5 mg kg-1) concentrations were observed in soil treated with the 39 g foliar applied dust. Data indicated that the post-harvest soil of maize and sugarcane had the lowest soil total Ni (2.89 and 3.26 mg kg-1) and available Ni (0.88 and 0.97 mg kg-1) in the control treatment without dust application rate, while the highest soil total Ni (31.8 and 35.9 mg kg-1) available Ni (18.8 and 20.4 mg kg-1) were observed in the 39 g dust treatment. The post-harvest soil of maize and sugarcane had the lowest soil total Pb (3.9 and 3.5 mg kg-1) and available Pb (0.56 and 0.67 mg kg-1) in control treatment without dust, while the highest soil total Pb (70.4 and 76.5 mg kg-1) and available Pb (31.4 and 34 mg kg-1) were observed in the 39 g dust treatment. From a result perspective, the post-harvest soil of maize and sugarcane had the lowest soil total Zn (6.5 and 7.4 mg kg-1) and available Zn (1.8 and 1.3 mg kg-1) in the control treatment without dust application, while maximum soil total Zn (123.3 and 139.6 mg kg-1) available Zn (41.3 and 36.8 mg kg-1) were observed in the 39 g dust treatment. The metal concentration in post-harvest maize and sugarcane soil was high in the soil treated with a 39 g dust application rate due to the finer particle size.
Fig. 4.
Heavy metals concentrations in post-harvest soil of maize and sugarcane crops. Different letters represent significant difference among treatment (p≤0.05); Δ = Extractable metals; • = Total metals; A = lead (Pb); B = cadmium (Cd); C = copper (Cu); D = nickel (Ni); E = zinc (Zn). All treatments were compared with the control (no dust): T0 = Control; T1 = 44-gram dust; T2 = 39-gram dust; T2 = 24-gram dust; T4 = 9-gram dust.
Principal Component Analysis of Maize and Sugarcane
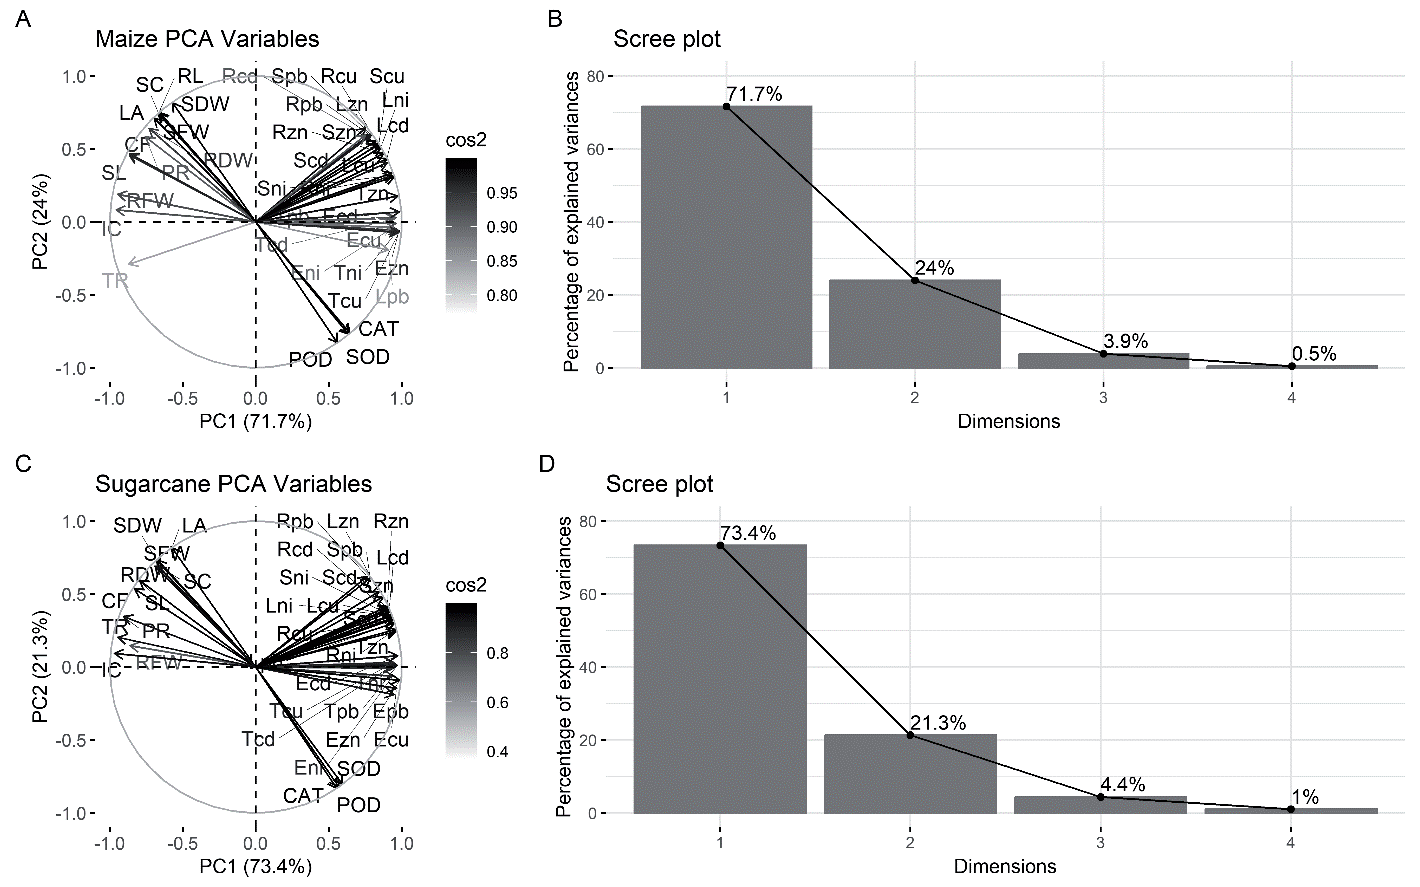
The principal component analysis identified the parameters of maize and sugarcane crops affected by foliar applications of motorway dust, as shown by variable and scree plots (Fig. S1). The scree plots show substantial variation among treatments for the provided variables of sugarcane and maize; PCA1 accounts for 71.7% and 73.4% of the variability, whereas PC2 accounts for 24% and 21.3% (Fig S1b, d). A more evident visualization of the relationship and the large variation across all the analyzed variables was revealed by the PCA loading plot (Figure S1a, c). Strong correlations were found between metals in plant tissue and enzymatic parameters; hence, high metal concentrations in plants were linked to elevated SOD, POD, and CAT levels. Negative correlations were found between plant growth characteristics and plant-heavy metals (leaf, shoot, and root), but less between plant physiology and metals in plant tissue. Growth and physiology reveal conflicting inclinations against oxidative stress in plants and soil-borne heavy metal toxicity. PCA overall showed that dust polluted with heavy metals damages plant physiology and growth via enhancing plant stress.
Discussion
Metal-contaminated dust reduced the growth parameters of maize and sugarcane. The line of evidence with other studies, the sugarcane [41, 42] maize [43, 44], growth was affected by dust. In this investigation, the dust contaminated with metals declined the root-shoot length, plant biomass as well as leaf area of the plant. Moreover, leaf area decreased in 44 g dust treatment compared to control because continuous dust exposure with more mass on the leaf surface of maize and sugarcane forms a layer on leaves. Heavy metals from dust caused stunted development, chlorosis, blocking of stomata, and lower plant mass. The dust application rate affects the growth parameters in the following order: 44 g > 39 g > 24 g > 9 g. The treatment with 44 g dust application rate adversely affects plant growth compared to dust treatment 9 g. The reduction in growth parameters was due to either aberrant root top cell proliferation or enzyme inactivation caused on by cortical cellular injury [8] protein denaturation might have been caused by breaking H-S bonds, resulting in plants' stunted development. According to Sytar et al. [31] heavy metals have devastating effects on plant growth by altering photosynthetic pigments and may cause photo-oxidative damage. Another study found that the presence of metals in plants reduced their ability to photosynthesize and resulted in irregular growth patterns [45]. Heavy metals in dust influence plant total biomass, resulting in lower productivity and poor development [46].
Heavy metals in dust influence plants' physiology, resulting in lower plant functioning. In maize and sugarcane, the maximum SPAD values were 20.2 and 29.5, photosynthetic rate 15.5 and 16.8 µmol CO2 m-2 s-2, while transpiration rate 2.9 and 1.55 mmol H2O m-2 s-1, stomatal conductance 0.27 and 0.72 mmol m-2 s-1 and internal CO2 149.6 and 130.5 μ m mol-1 recorded in treatment receiving 44 g dust. The maximum reduction was noted in photosynthetic pigments with a 44 g dust application rate compared to the control without dust. The decrease in photosynthetic pigments was caused by the buildup of heavy metals in maize [47, 48]. Dust metals were absorbed into the leaf surface and restricted the stomata opening, resulting in lower photosynthetic activity and stomatal conductance [49, 50]. Heavy metal cause oxidative stress in plants to create ROS, which affects plants' physiological activities [51]. Plant stomata may get partially or entirely clogged by dust deposited on the leaf surface. This restriction is the primary cause of blocking CO2 access, which declines photosynthetic activity [52]. Under metal stress, plant physiological parameters were suppressed in maize and sugarcane [53- 55].
The current research found that plants had maximum levels of overall antioxidant activity. The maize and sugarcane plants' enzymes superoxide dismutase, peroxidase, and catalase activity were recorded higher under dust stress. Results show that plant superoxide dismutase (SOD), peroxidase (POD), and (catalase) CAT maximum concentrations were 54.5 and 58.6, 43.2 and 49.3, 6.52 and 5.28 mg-1 of protein in 39 g treatment, while control treatment showed minimum values were 35.3 and 42.2, 29.7 and 35.3, 6.52 and 5.28 mg-1 of protein. The maximum activity of enzymes was noted under a 39 g dust application rate compared to the control where no dust was applied. A plant anti-oxidative defense system activates and scavenges ROS by developing antioxidants in plant cells to deal with dust stress, whereas by transforming ROS into oxygen and water, these antioxidants detoxify [56]. According to Shahid et al. [57], oxidative stress in plants may be caused by an imbalance between the formation of ROS and the scavenging of ROS by antioxidants. Roadside dust affected plant antioxidant activity in the following order: 10-meter dust (39 g) > 0-meter dust (44 g) > 60-meter dust (24 g), 120-meter dust (9 g). In earlier studies, it was found that under metal toxicity, the antioxidant activities were recorded high in maize [58], and sugarcane [59], According to Shah et al. [60], vegetation may experience oxidative stress as a result of dust, whereas this stress increases plant antioxidant activity, a protective reaction against stress.
The maximum concentrations of maize and sugarcane were observed Pb (0.81 and 0.072), Cd (0.092 and 0.076), Cu (2.62 and 2.22), Ni (1.54 and 1.24), Zn (3.62 and 3.12) mg kg-1 in leaves, Pb (2.88 and 2.44), Cd (0.005 and 0.004), Cu (9.75 and 8.7), Ni (6.48 and 4.55), Zn (16.5 and 11.4) mg kg-1 in shoot and Pb (3.22 and 2.94), Cd (0.75 and 0.62), Cu (13.7 and 11.2), Ni (7.32 and 6.21), Zn (21.3 and 13.3) mg kg-1 in roots with 39 g dust rate. The maximum concentrations of Cd, Cu, Ni, Pb, and Zn in maize and sugarcane were recorded 39 g dust application rate compared to the control where no dust was applied. Moreover, the heavy metals in plants were observed high in the following order 10-meter dust (39 g) > 0-meter dust (44 g) > 60-meter dust (24 g), 120-meter dust (9 g). Numerous research [61-63], showed that road dust was the source of metal deposition and translocation in various plant organs. Plant roots have high metal concentrations compared to leaves and shoots. Plants begin to store metals in their cell walls under metal toxicity, and their roots can do so three times more efficiently than their shoots [28]. Root structure and activity have a significant role in the uptake of metals [64]. The concentrations of metals maximum in 39 g dust treatment in leaves, shoot, and root due to fine dust particle size and more load metals than 44 g dust treatment. Numerous studies have noted metal absorption and translocation of various plant parts receiving road dust increases significantly [65-67].
The post-harvest soil of maize and sugarcane was contaminated with motorway dust. The total concentrations of maize and sugarcane observed maximum were Pb (70.4 and 76.5), Cd (1.21 and 1.44), Cu (46.6 and 49.5), Ni (31.8 and 35.9), Zn (123.3 and 139.6) mg kg-1, and extractable were Pb (0.81 and 0.072), Cd (0.76 and 0.96), Cu (24.3 and 27.6), Ni (18.8 and 20.4), Zn (41.3 and 36.8) mg kg-1 with 39 g dust application rate The present study recorded the maximum Cd, Cu, Ni, Pb and Zn concentrations in maize and sugarcane soil received the 39 g dust rate. The findings of this research are consistent with those of other earlier studies by Olukanni [68]. The number of metals observed in roadside dust was primarily caused by vehicle emissions [69]. The previous reports have also highlighted the issue of soil contamination with metals [70, 71]. The concentrations of metals were low in soil containing 9 g dust collected from a 120-meter distance due to low mass compared to 39 g treatment collected from a 10-meter distance. So, several studies have previously shown that as the distance from the major road increased, the metal concentration in roadside dust decreased rapidly [72-74].
Conclusion
It is concluded that road dust collected from different distances affects soil and vegetation. The dust collected from the motorway edge caused considerable metal contamination in the soil and plants, while dust gathered from 120 meters distance caused low metal pollution due to little dust mass. Plant roots have higher metal concentrations than shoots and leaves, and metal contamination in maize was higher than in sugarcane. However, dust deposition severely affected growth and physiology, causing lower plant biomass and decreased photosynthetic abilities. Contrarily, the metals-contaminated dust boosts up the catalase, peroxidase, and superoxide dismutase enzymatic activities, disrupting the plant's regular functioning. Moreover, the dust with fine particles causes more contamination compared to coarser particles. Generally, dust applications with metals negatively impact soil and plant health and need proper mitigation strategies.