

Introduction
Plastic pollution is a global issue that poses a significant health risk to the environment, marine life, and humans [1]. Currently, people worldwide extensively use plastics in their daily lives. However, a significant amount of plastic is released into the natural environment instead of being efficiently recycled or appropriately disposed of. [2, 3] particularly water bodies. Over time, plastic waste breaks down into smaller fragments due to natural elements like sunlight, precipitation, wind, and biodegradation [4]. These tiny micro-scale materials were known as microplastics. Microplastics (MPs) can be defined as plastic fragments smaller than 5mm [5], encompass both primary microplastics used in industrial production and secondary microplastics created from the degradation of larger plastic items [6]. Microplastics can adsorb other pollutants with their relatively large surface area and hydrophobic nature. Consequently, MPs can continuously adsorb persistent organic pollutants, heavy metals, and pathogens from the surrounding environment over a prolonged period. This accumulation of pollutants on MPs poses a hazard to various organisms in ecosystems, including those in the food chain, ultimately impacting the entire ecological environment. Therefore, developing efficient and sustainable methods for microplastic removal from water has become a critical issue [7].
Currently, available technologies for removing microplastics from water include physical, chemical, and biological approaches[8, 9]. Physical removal technologies primarily involve coagulation, sedimentation, and filtration [10]. Among these methods, coagulation relies on the formation and precipitation of large aggregate structures of microplastics and coagulants. However, studies have demonstrated a low removal efficiency of polyethylene (PE) microplastics, even when high-dosage aluminum salt solutions [11]. The mean removal efficiency of polyethylene particles of various sizes through coagulation was found [12]. Sedimentation can effectively remove high-density microplastics, but their efficiency varies significantly depending on the polymer type and size [13, 14]. In contrast, chemical methods such as photocatalytic oxidation [15] and oxidation removal [16, 17] can eliminate microplastics from water, but they are expensive and energy-intensive. Biological treatment shows promise but is time-consuming for biodegradation to occur [18], and the removal rate can be unstable, leading to secondary pollution [19, 20].
Magnetic field-based attraction has recently been reported as a method for removing microplastics from water [21]. By magnetizing the hydrophobic surface of microplastics using binding nanoparticles, magnetized microplastics can be separated and removed in the presence of a magnetic field [22]. This method has successfully separated microalgae attached to magnetized nanoparticles, offering efficiency and time-saving advantages [23]. In a recent study, researchers utilized synthesized magnetic carbon nanotubes (M-CNTs) to adsorb microplastics, effectively separating them from water using magnetic force [24]. The magnetic separation method shows potential for high efficiency and environmental friendliness in removing microplastics from water [25]. However, microplastics in the environment usually consist of multiple types with different polymer compositions and various sizes [26]. The actual removal efficiency using magnetic technology may vary significantly, but it has not been systematically investigated to date [27].
In recent years, black tea magnetic nanoparticles (BTMNPs) have been used in environmental engineering to remove environmental pollutants. An eco-friendly and less expensive alternative to traditional physical and chemical procedures is the green production of nanoparticles [28]. Nevertheless, no documentation has been found about their use in removing polyethylene (PE) microplastics from water by using BTMNPs. In this study, we utilized black tea-mediated magnetic nanoparticles to magnetize two different sizes of polyethylene microplastics. The morphological features were characterized using scanning electron microscopy (SEM). A comparison was made between the removal rates of microplastics of varying sizes once they were determined. Lastly, the magnetic removal approach was validated and can be implemented in environmental waters. This research aims to develop a technical method for eliminating microplastics from water that uses magnetic nanoparticles made from black tea extract.
Materials and Methods
Extraction of Black Tea
Lipton brand black tea was acquired from the local market, and 10 grams of dried powder was added to 100 mL of deionized water in a 250 mL volume flask at 70 ͦ C. The mixture was allowed to steep for an hour until it turned dark brown. Afterward, it was cooled down and filtered using Whatman No. 1 paper to eliminate any solid materials, and the resulting extract was stored in a refrigerator at 4 ͦ C for future use.
Green Synthesis of BT-Nanoparticles (NPs)
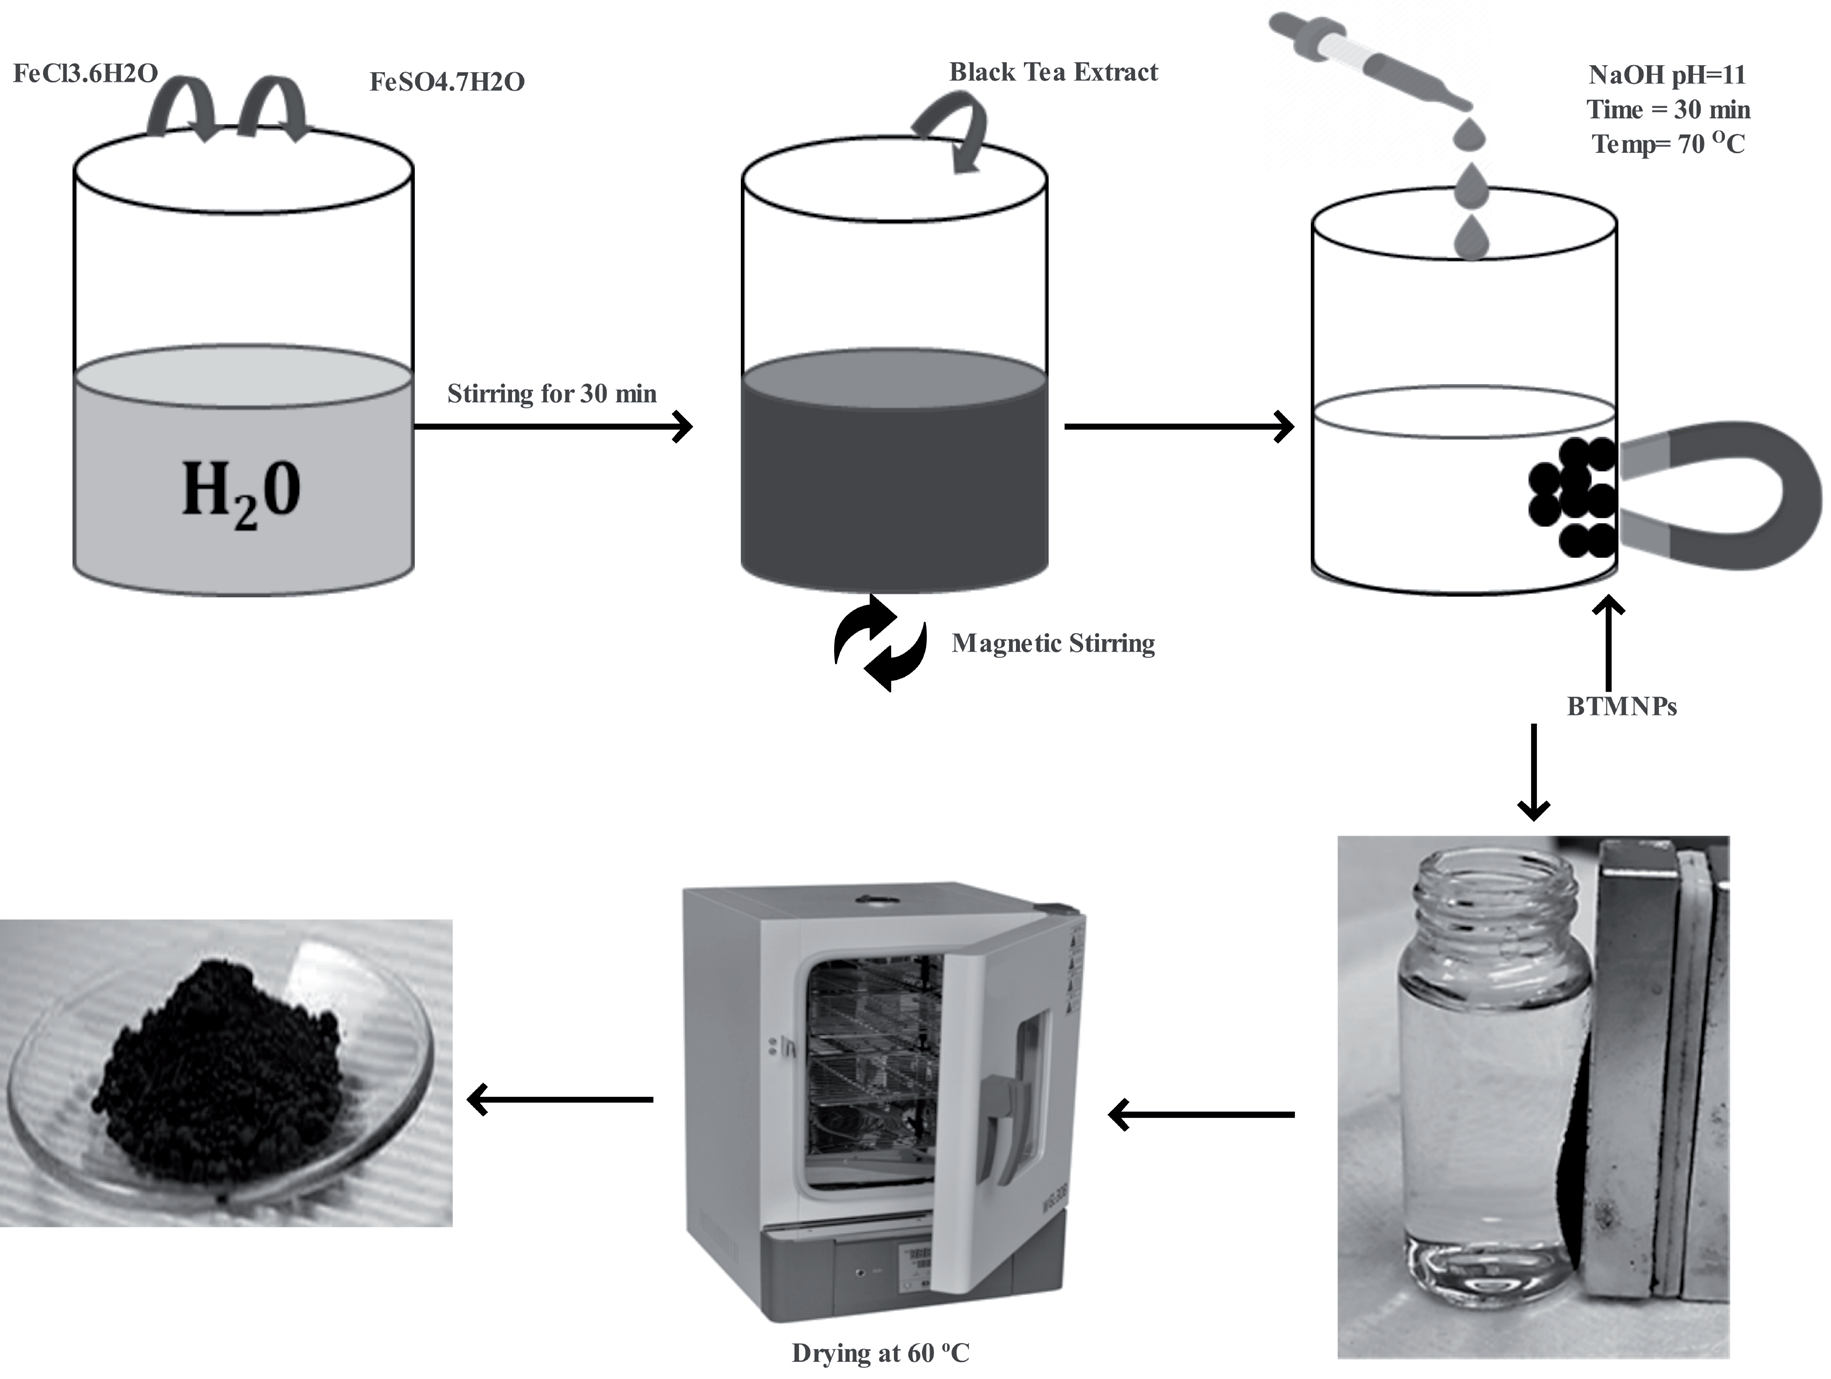
The previously reported synthesis method was employed with some modifications to fabricate BTMNPs [29]. In brief, a solution was made by dissolving Ferrous Sulphate (FeSO4.7H2O) (Duksan Pure Chemicals, South Korea) and Ferric Chloride (FeCl3.6H2O) (Sigma Aldrich) in a 1:2 M ratio in 50 mL of deionized water and heated to 80°C. Black tea extract was added to the solution mixture and stirred for 5 min. Gradually, 1 M freshly prepared Sodium Hydroxide (NaOH) (Samchun Pure Chemicals, South Korea) was added until the pH reached 11, followed by continuous stirring for 30 min. A black-colored product was obtained and allowed to cool at room temperature. The product was separated using a ring magnet and washed several times with deionized water to eliminate impurities. Finally, the BTMNPs were oven-dried at 60°C for 12 h. The complete synthesis procedure is schematically presented in Fig. 1. In addition, Zetasizer Ultra Red label UK/ Malvern instrument 2022 was used to measure the zeta potential of nanoparticles. For morphology analysis, FE-SEM JSM-6390A JEOL 7000F scanning electron microscopy was used. Furthermore, Fourier transform infrared spectroscopy (FTIR, IFS-66/S) [30, 31] was employed to measure the molecular bond stretching of BTMNPs.
Results and Discussion
Before the utilization of as-prepared nanoparticles, the material was characterized in detail. The SEM image of synthesized BTMNPs is presented in Fig. 2 (a). The image shows the particle size and morphology of the material. After analyzing the image, we found that the material had a uniform morphology and possessed nanoscale features. In addition, the FTIR of the synthesized material was presented in Fig. 2 (b). The analysis was carried out further to confirm the purity of the material before further experimentation. 300 to 700 cm-1 bands were usually considered important vibrational bands of ions in the crystal lattice [32]. Therefore, the 574 cm-1 band can be associated with Fe-O stretching vibrational bands of BTMNPs [33, 34]. 1130 cm-1 band is C-O stretching vibration [35]. Furthermore, peaks at 1630 and 3410 cm-1 are also associated with O-H [36, 37]. 2920 cm-1 is an asymmetric stretching of CH2 [38, 39]. Furthermore, 720 cm-1 is the rocking vibration of the ─ (CH2)n─ (n ≥ 4) group. The peak at 1468 cm-1 is associated with the methylene group’s bending vibration [39]. The characterization of the material was further prolonged to zeta potential measurement, as graphically presented in Fig. 2 (c). The materials dispersed in the aqueous solution have different surface charge distributions at various pH levels, so the zeta potentials of BTMNPs and PE microplastics at various pH were measured. When the pH value increased from 3 to 9, the zeta potential of microplastics kept decreasing. The zeta potential of BTMNPs decreased first and then increased with the increase of pH value. When the pH value changed from 3 to 9, the zeta potential of BTMNPs decreased from 8.63 mV to -7.68 mV and then increased to -0.31 mV. The zeta potential of BTMNPs was positive at pH 3 and became negative when the pH value was higher than 3. Based on the zeta potential of BTMNPs and PE microplastics, the nanoparticles attached to the polymer material and adhesion of the material take place [40]. Energy Dispersive X-ray (EDX) analysis was performed on the surface of BTMNPs, as shown in Fig. 2(d). The EDX results of BTMNPs reveal the elemental composition of prepared nanoparticles. The EDX profile shows an intense peak signal of iron, along with other signals observed, including oxygen and carbon. The presence of C and O peaks was related to polyphenols or any other C and O containing a compound in the natural materials’ extract. The existence of elemental iron and oxygen demonstrates that the nanoparticles were essentially present in oxide form. The atomic percentage of detected elements was carbon (C) 18%, iron (Fe) 27%, and oxygen (O) 52%.
Fig. 2.
Characterization of synthesized material. (a) EDS of as-synthesized material, (b) FTIR of MPs and BTMPS nanoparticles (before and after adsorption), (c) zeta potential of the nanoparticles.
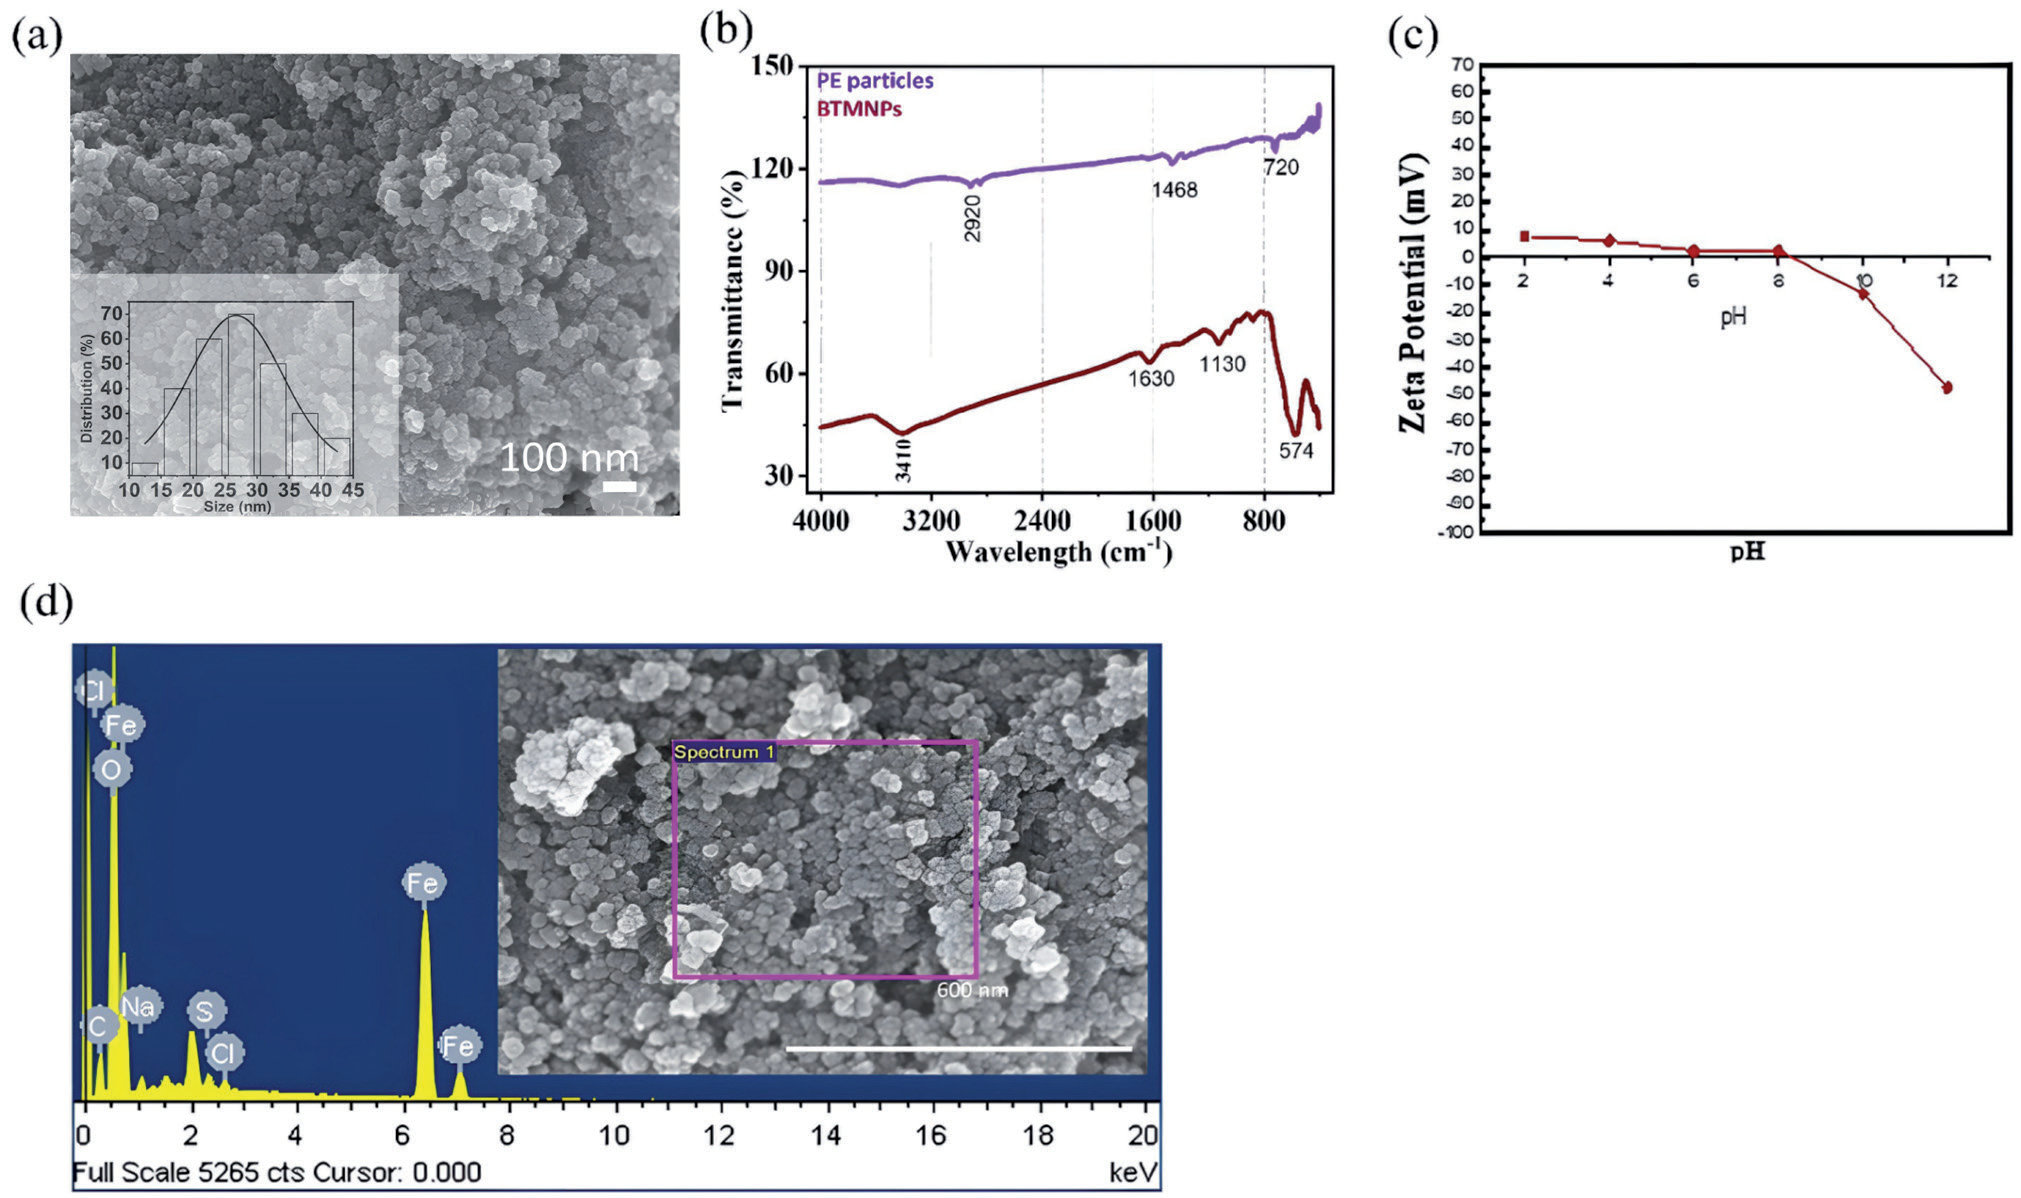
Fig. 3.
Elemental mapping of nanomaterial. (a) EDS data of nanomaterial. (b) Surface of the PE MPs material where nanoparticles were attached. (c) Magnified image in order to observe the presence of nanoparticles. (d), (e), and (f) are the elemental mapping of the nanoparticles to confirm the distribution of the major elements of the material.
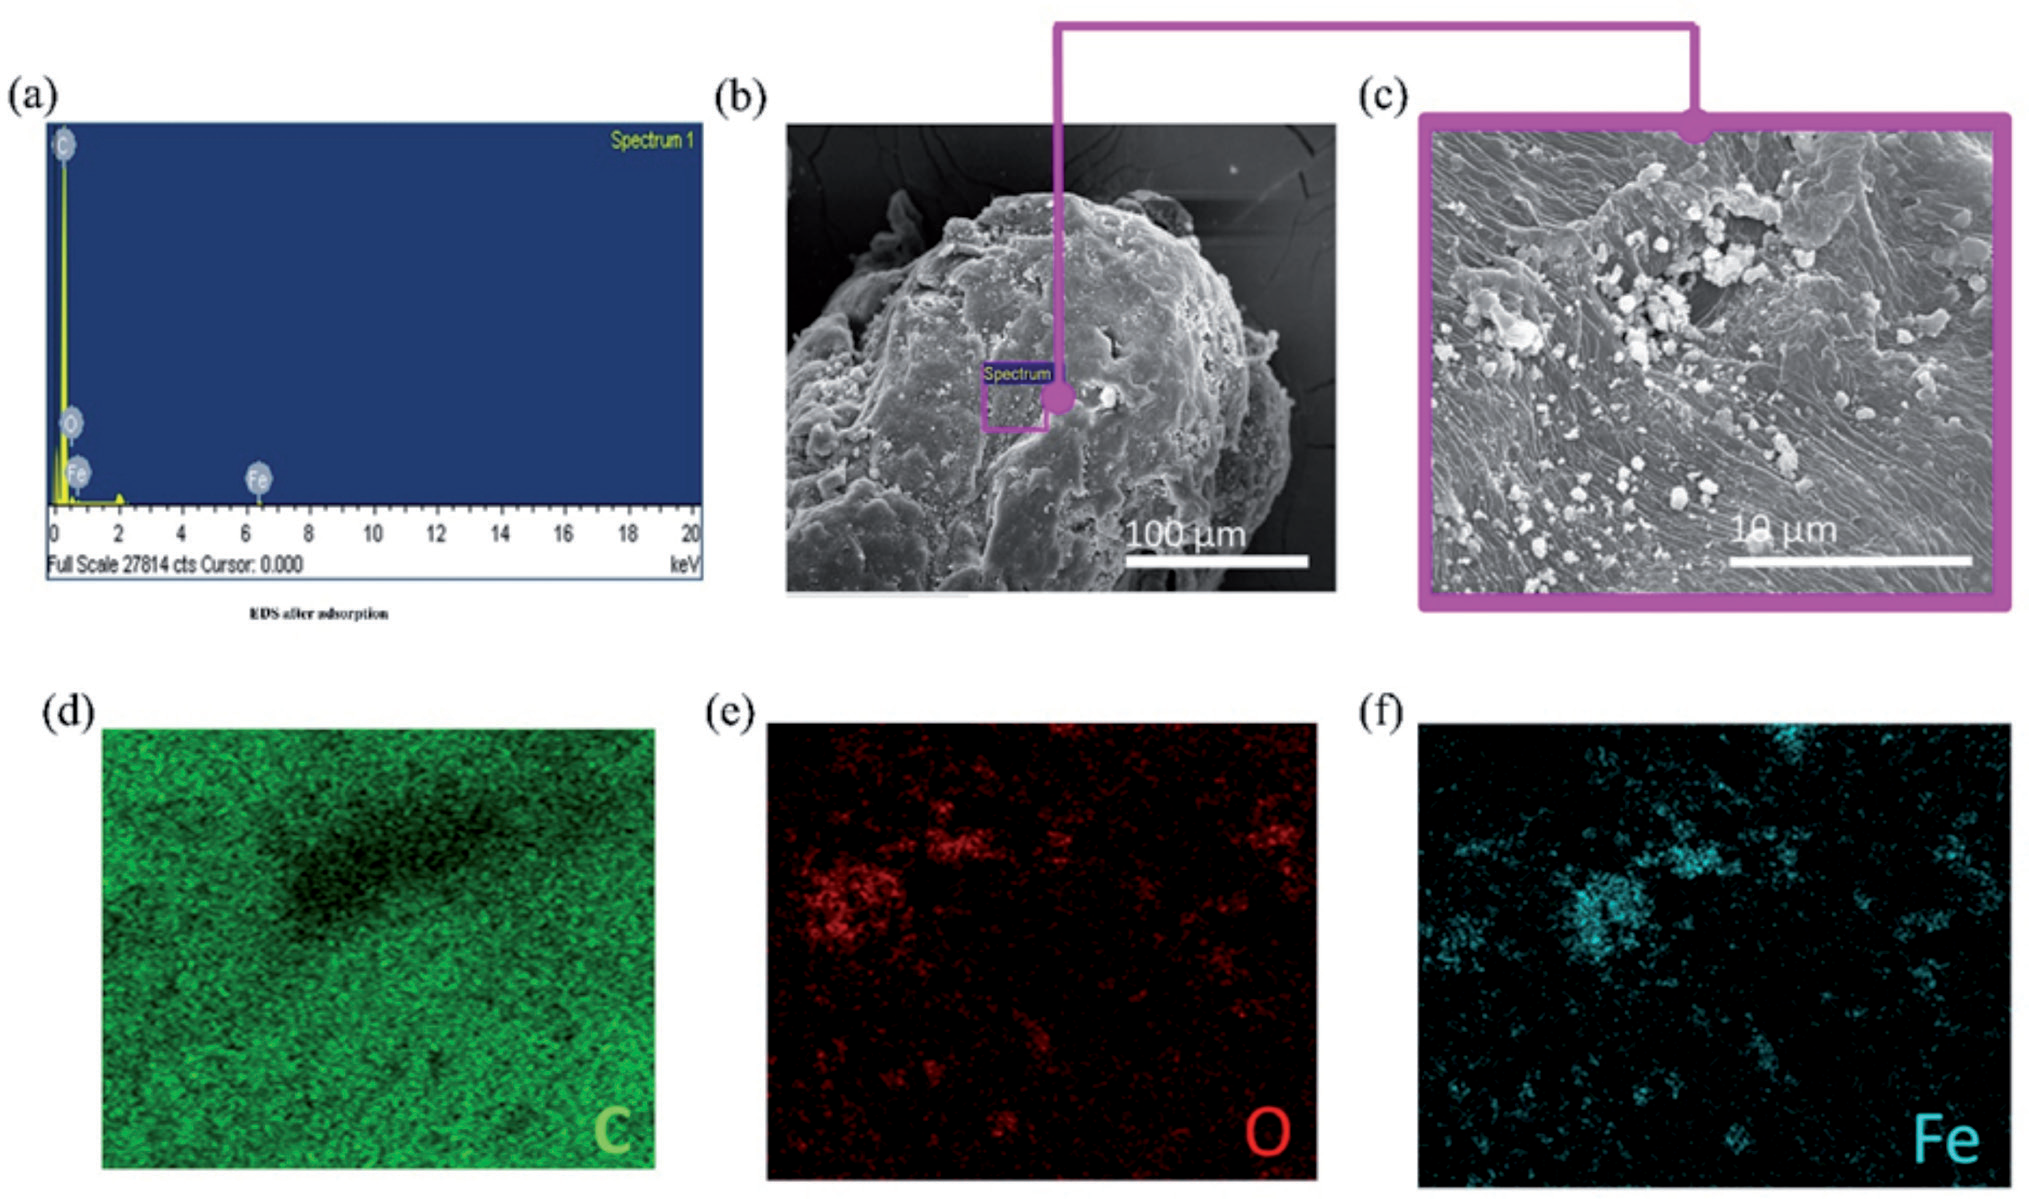
The EDX and elemental mapping data of the nanoparticles were obtained at PE MP's surface. As presented in Fig. 3(a), the sharp peaks confirm the presence of important constituents of the material. This data shows the presence of important constituent elements. In addition, Fig. 3(b) shows the area from which the spectrum was obtained. The magnified view of the area is also presented in Fig. 3(c) for further clarification. The magnified image in Fig. 3(c) depicts the presence of magnetic nanoparticles on the surface of PE particles. Discussing the surface mapping of the magnetic nanoparticles, the image data was presented in Fig. 3 (d-f). As PE particles were present during the characterization of materials, therefore carbon is presented in Fig. 3(d). The elemental mapping data shows that important elements such as oxygen (Fig. 3(e)) and iron (Fig. 3(f)) were present in the as-synthesized material.
Removal of Microplastics
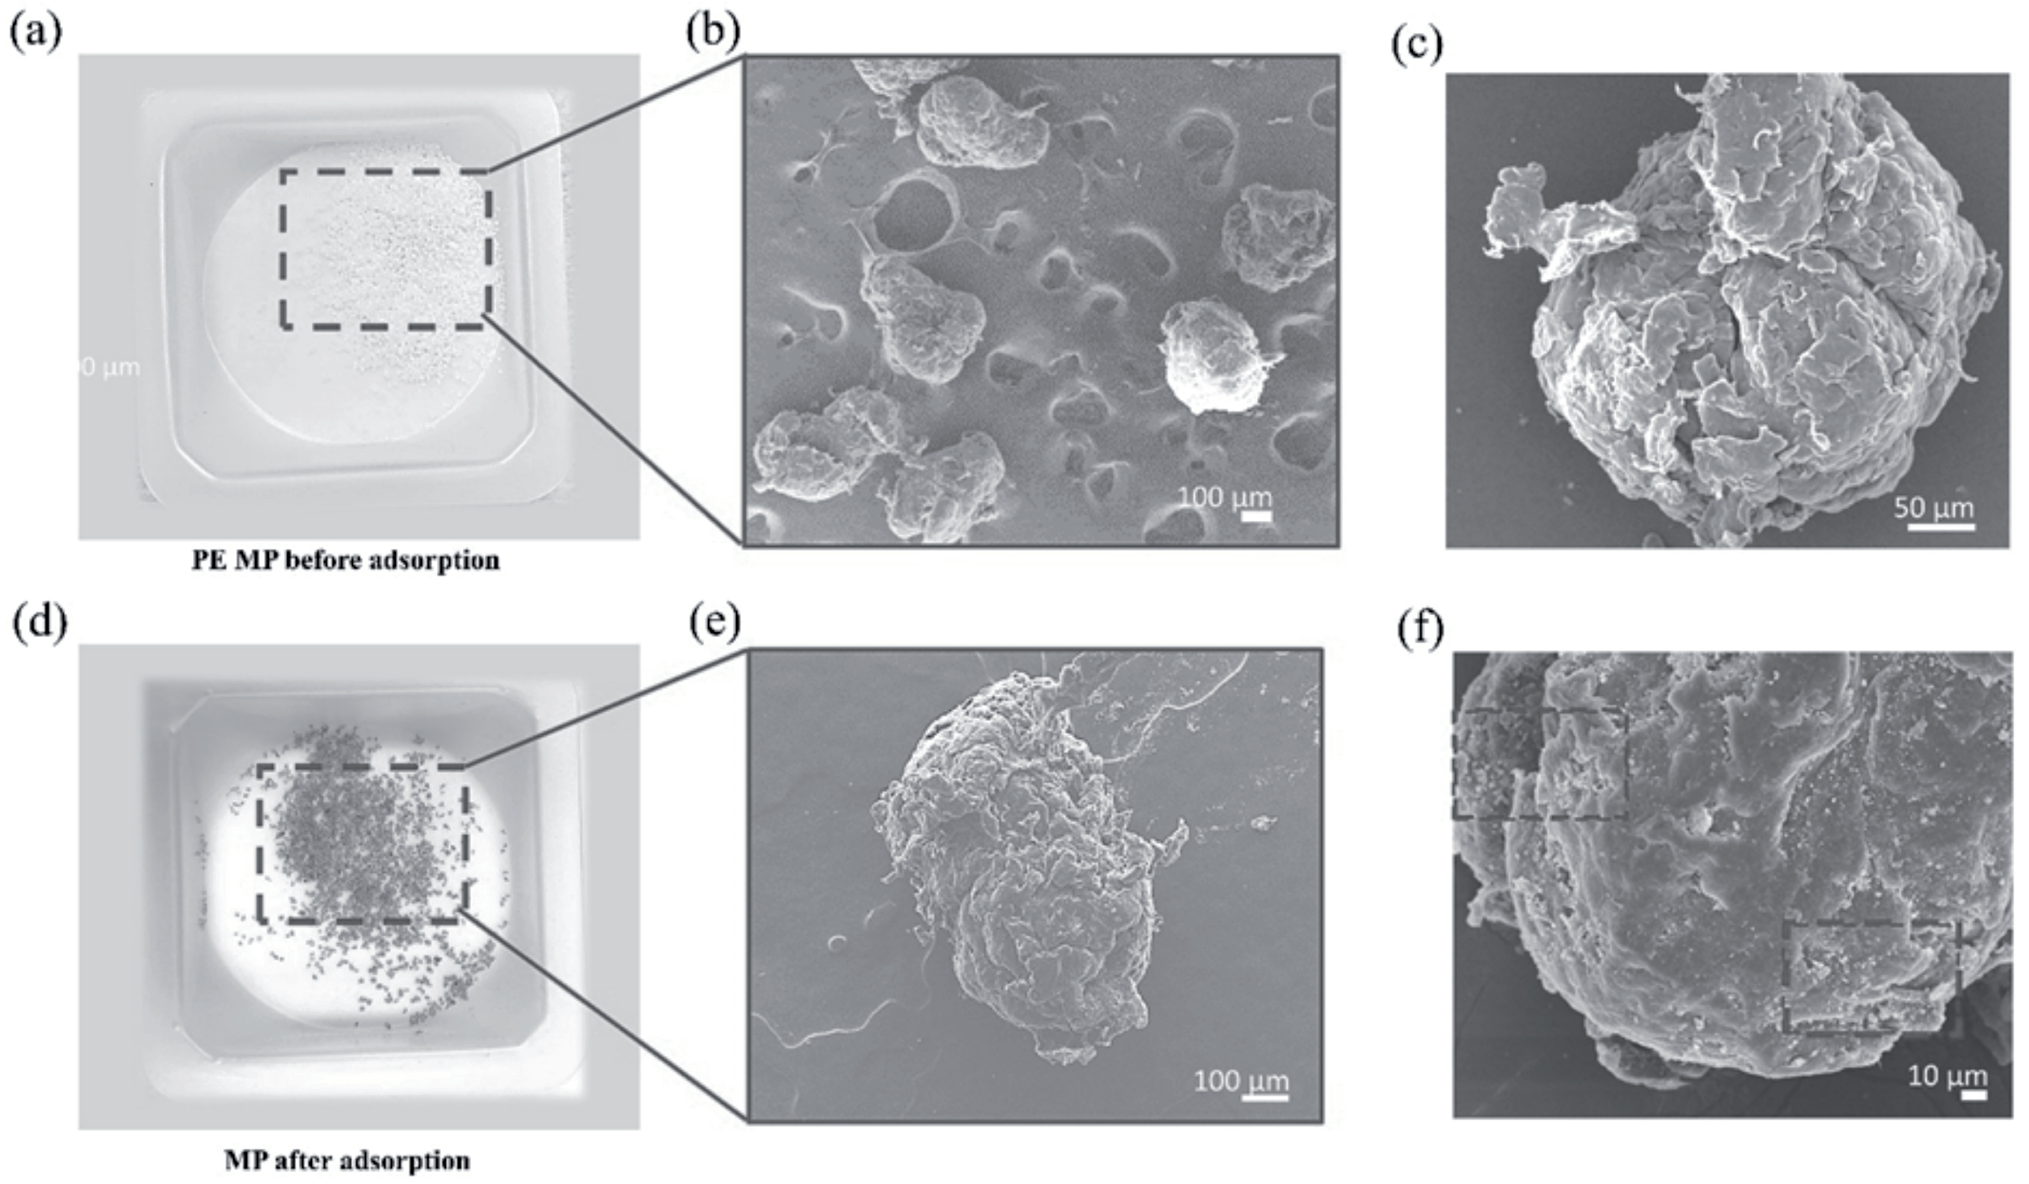
PE of 450 µm diameter was used in the experiment (Fig. 4 (a)). The SEM image of PE MPs in Fig. 4(b) shows the morphology of the polymer materials. Furthermore, the magnified view of the material in Fig. 4(c) confirms the geometrical shape. Through the SEM images, it was confirmed that the material did not possess any kind of sophisticated geometrical structure. Furthermore, magnetic particles adhered to the surface of polymer particles due to the surface charge difference. As the magnetic particles attached to polymer particles, the color of PE particles changed to brown color (Fig. 4(d)). In addition, this adhesion helps us to remove microplastics.
An external magnet has been used to remove PE microplastics from water. Due to magnetic field attraction, these iron-coated polymer particles attract toward the magnet. Thus, the polymer particles were removed from the water. The removed material was also presented in Fig. 4(d). The material was also examined under SEM. The SEM image confirms the attachment of nanoparticles on the surface of the microplastics Fig. 4(e). The magnified SEM image in Fig. 4(f) further confirms the adhesion of nanoparticles on PE particles. The reason behind the adhesion of nanoparticles was further discussed in zeta potential’s Fig. 2(c) explanation. The most important thing in the adhesion of these nanoparticles on the surface of the polymer material was the pH of the water.
pH plays a crucial role in adsorption processes as it affects the surface charge of both the absorbent and adsorbate. Fig. 5(a) shows significant variation in removal percentage at different pH levels, indicating that the adsorption behavior is pH-dependent. It can be observed that at pH 6 and 7, the removal percentage increased to 72% and 90%, respectively.
Fig. 4.
MPs SEM characterization before and after adsorption. (a) Real picture of MPs (b) SEM image MPs (c) magnified view of a single polymer particle. (d) Real image of MPs after adsorption of nanoparticles, (e) SEM image of single polymer particle, (f) magnified image of the single polymer particle showing the nanoparticles adsorption.
Calculations of Removal Rate of MPs
The mass of MPs was used to calculate the removal rate in simulation studies to remove MPs from water. By the following equation (1),
Whereas, η is the removal efficiency of MP, (m) is the final mass of PE MPs removed from water, i.e., absorbing on the magnet, and (M) is the initial mass of PE MPs introduced to the experimental solutions and is the removal rate of MPs (%).
Adsorption is facilitated by near-neutral pH levels, which provide favorable conditions. The reduced presence of protons competing binding sites. This enables the nanoparticles to adsorb PE microplastics effectively. The highest removal percentage was observed at pH 7, 8, and 9 (95% each). Interestingly, at pH 11, the removal % decreased to 20%. The water mixture containing the PE MPs and BTMNPs was set at 0.5 g/l. PE MPs and BTMNPs were treated or subjected to adsorption for different intervals: 0.5, 1, 2, 3, 6, 9, and 12 hours (Fig. 5(b)). The mixture was agitated at 180 rpm using a shaker. The removal percentage of microplastics was observed and recorded at each time interval, resulting in removal percentages of 59%, 95%, 97%, 98%, 98%, 98%, 98%, and 99% at the respective time intervals.
As shown in Fig. 5(c), the concentration of BTMNPs increases from 0.1 g/L to 1 g/L, and the removal efficiency of PE MPs also increases. This suggests that a higher concentration of BTMNPs is more effective in removing PE MPs. The increased adsorption capacity of BTMNPs at higher concentrations likely explains this trend. In Fig. 5(d), the graphical representation of the data also shows that the removal percentage is almost the same. The polymer material of 150 and 450 µm diameter -based -polymer particles were removed using the as-synthesized nanomaterials. The material was highly effective in removing different sizes of polymer materials.
Table 1. compares various magnetic materials used to separate microplastics (MPs), highlighting different magnetization-based capture mechanisms. The table also contrasts the removal efficiencies reported in current studies, which is 95% per hour. Notably, most separation mechanisms are based on surface adsorption, demonstrating the highest percentage of MP removal compared to other methods, such as coagulation-flocculation, phoretic interactions, shoveling effects, and adsorptive bubble separation.
Fig. 5.
(a) Removal of polymer material from water at different pH, (b) number of hrs, (c) dosage of nanoparticles. (d) Two different-sized polymer removal characterized at different numbers of hrs.
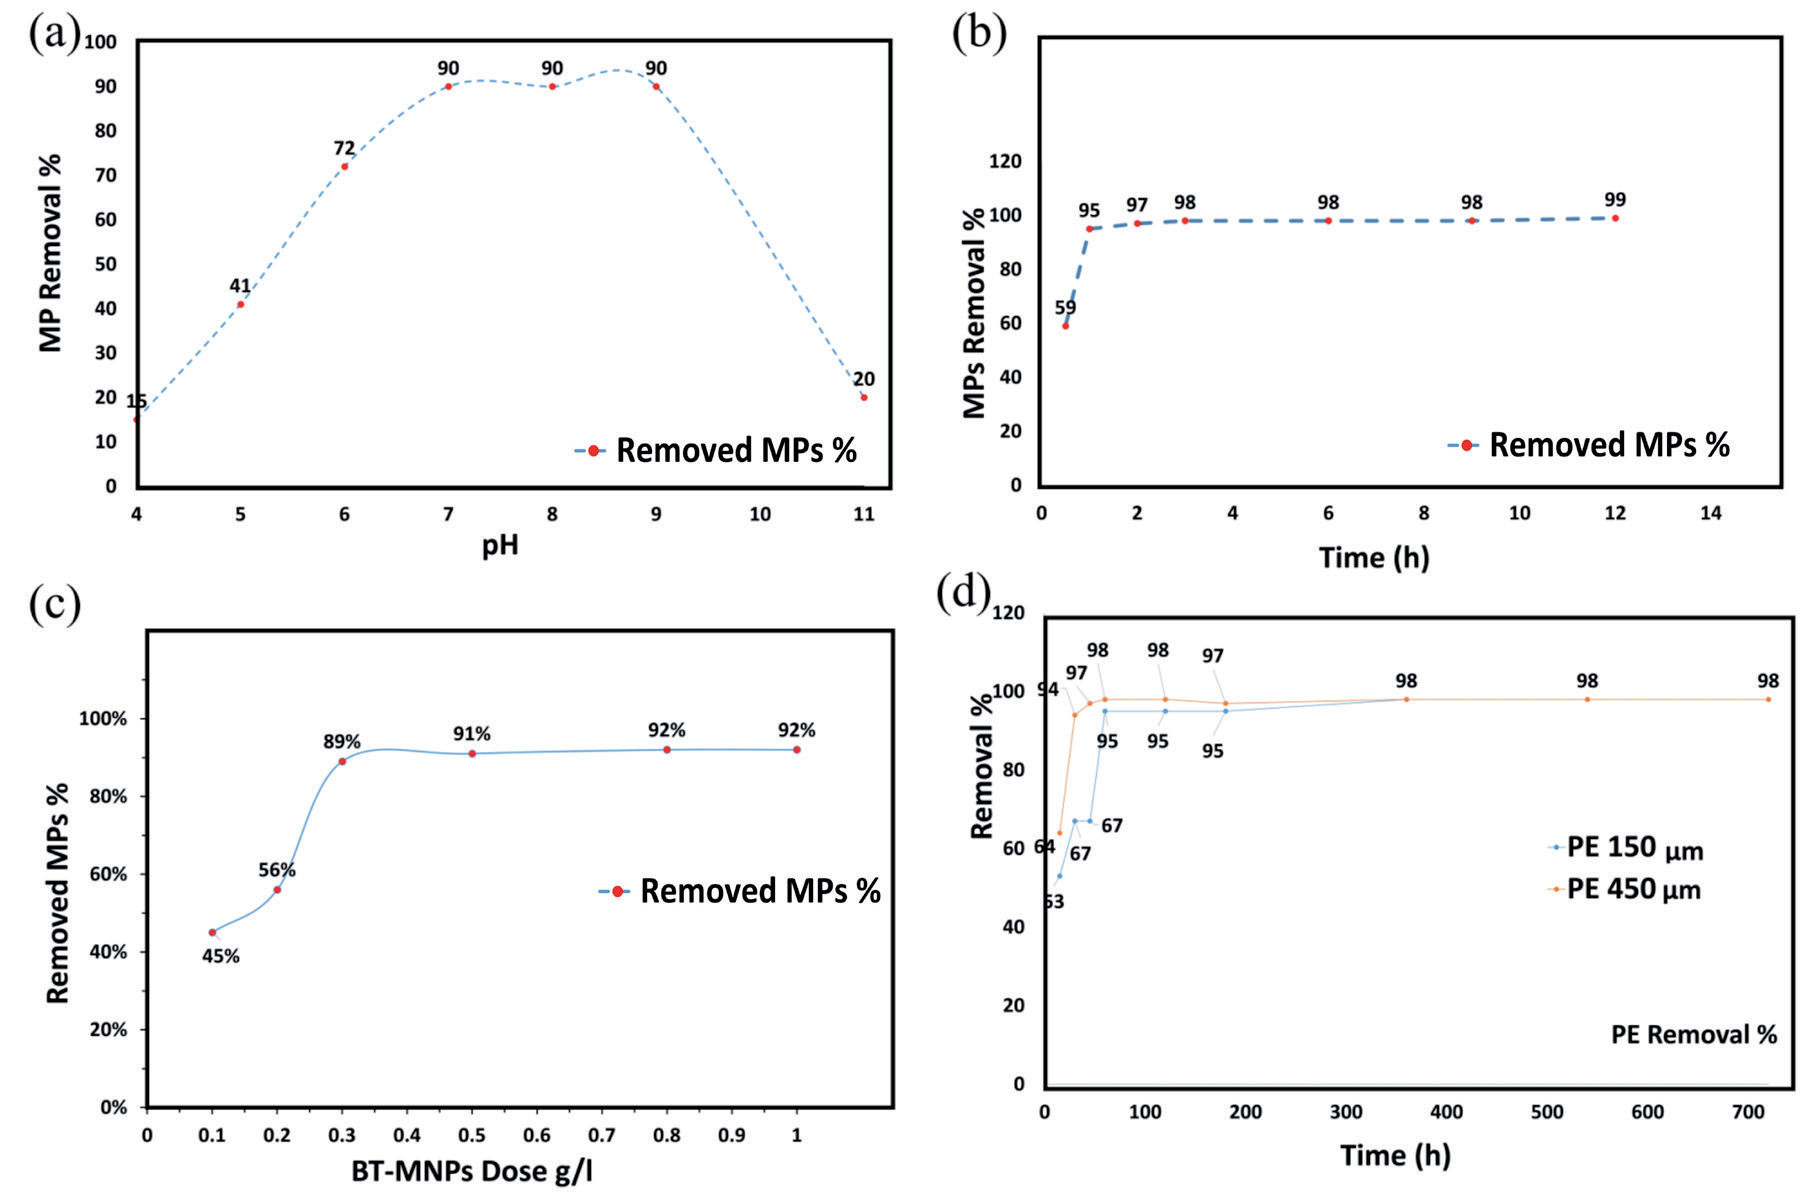
Table 1.
Comparison of MPs separation with different magnetic materials.
Fig. 6.
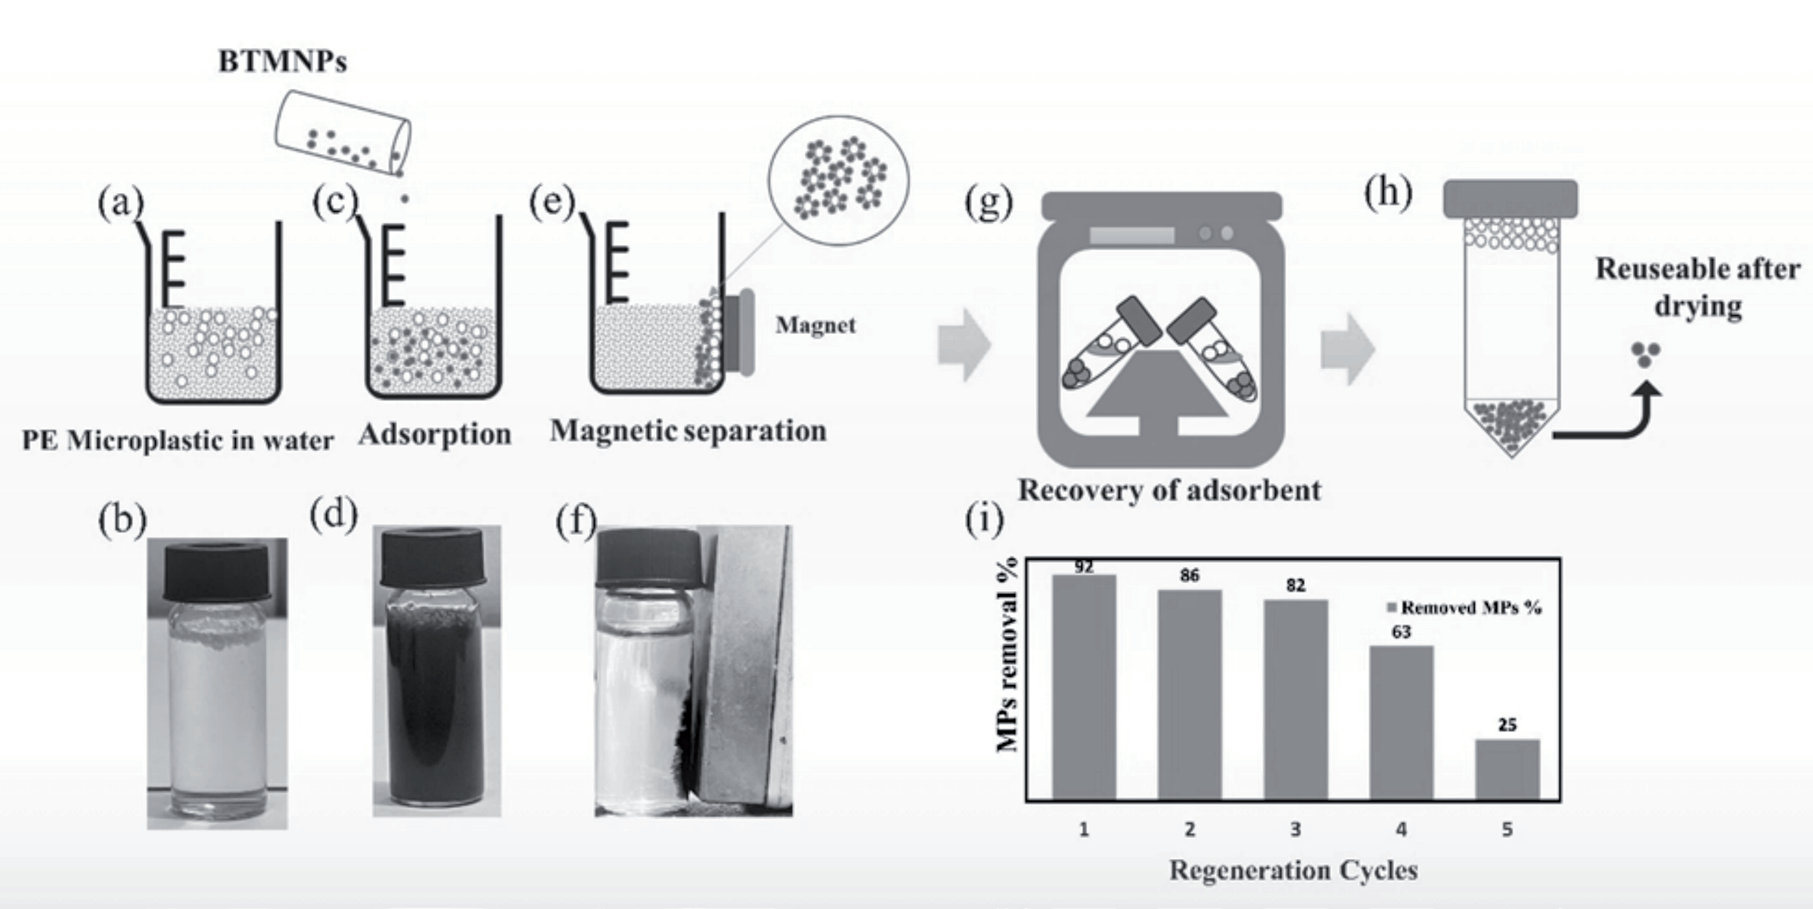
(a) Schematic presentation of mixing of polymer particles in water, (b) real picture of the mixing. (c) Schematic and (d) real image of mixing of BMPNs. (e) and (f) are the schematic and real images of the removal of polymer material through the adsorption mechanism. (g) Centrifuge of the obtained material. (h) Schematic representation of separation of nanoparticles from polymer particles. (i) Reused particles showing the percentage of removal of polymer particles.
Recycling of Nanoparticles and Their Reutilization
The synthesized material was re-utilized to remove MPs. To save the material and reduce the wastage, this part was also highlighted. The scheme was graphically represented in Fig. 4. First, MPs were put into water as presented in Fig. 6 (a), and (b) is the real picture of the mixture. After that, nanoparticles were mixed in the same solution (Fig. 4(c) and Fig. 4(d). To remove MPs, a hard magnet was used to remove MPs from water. The removed material was further placed in a centrifuge at 5000 rpm for 10 minutes to separate nanoparticles from MPs (Fig. 4(e)). After taking out a sample from the centrifuge, MP particles float on the surface of the water, and nanoparticles sink in the water (Fig. 6(f)). Furthermore, the recovered nanoparticles were reused to remove the fresh MP particles. The removal percentage of MPs was graphically presented in Fig. 6(g). From the removal percentage date, it can be said that the BTMNPs were highly efficient in removing MPs during several removal cycles.
Conclusion
In this research work, BTMNPs were successfully synthesized by using black tea. Using prepared BTMNPs as adsorbent for removing PE size 450 µm microplastics from the water sample revealed that the maximum removal percentage was 95 % per hour at pH 7. PE microplastic removal % was higher when the pH was 7-8. Compared to the Situation in acidic and alkaline solutions, PE adsorption capacity decreased in both conditions; this might be due to the surface of BTMNPs containing oxygen-containing groups, which decreased the hydrophobic interaction between PE and BTMNPs. BTMNPs hydrophobicity was less affected in a neutral solution.
pH plays a crucial role in adsorption processes as it affects the surface charge of both the absorbent and adsorbate. Moreover, adsorption PE was favored by electrostatic attraction between positively charged adsorbent surface and negative charges anions of PE in an aqueous solution as the pH of the magnetite nanoparticle was 7.5. pH plays a vital role in enhancing or reducing the removal efficiency. Hence, biosynthesizing BTMNPs using locally available aqueous green (black tea extract) resources is a simple, environmentally friendly, and cost-effective approach. It could be a potential adsorbent for polyethylene microplastic removal from water.

