

Introduction
As one of the three famous black soil regions in the world [1], the black soil region in Northeast China covers a vast area of arable land with a long history of reclamation. It is an important commercial grain production base and an important crop production area, meeting the food needs of more than 216 million urban residents annually [2-4], and has played an essential role in guaranteeing national food supply [5]. However, due to the exploitation of land resources and farming activities, soil erosion and land degradation has become one of the most significant environmental problems in this region [6]. Soil erosion in the northeastern black soil region has been severe, with an erosion area of 216,000 km2 [7]. Slope erosion and gully erosion are generally practiced [8-9], which gravely affects agricultural production in the northeastern black soil region and threatens the national agricultural growth and food security [10]. Therefore, it is of great theoretical significance to conduct and strengthen the monitoring and scientific research on soil erosion in the black soil region of Northeast China to protect the black soil resources and to sustain the agricultural development.
Soil wind erosion is the process of erosion, transport and deposition of fine particles and nutrients in the topsoil layer under the action of wind [11]. Being an important type of soil erosion, soil wind erosion is one of the major environmental problems in many countries and regions of the world [12, 13]. In China, wind erosion affects more than half of the country's land area [14, 15]. The land affected by wind erosion in China is mainly distributed in northern areas, and wind erosion in the black soil region of Northeast China accounts for 21-33% of the total erosion [16] and wind erosion is the primary cause of soil thinning and land degradation in arable land in the black soil region of Northeast China. Soil wind erosion poses a serious threat and damage to soil productivity over time, thus causing profound negative impacts on agricultural production and ecological environment [17]. Therefore, accurate prediction of wind erosion and an understanding of its environmental problems are necessary for soil conservation planning and testing of a variety of controls on soil wind erosion in order to maintain sustainable land use.
The erosion pin method [18, 19], wind erosion disk method [20, 21], sand collector method [22, 23], wind tunnel simulation [24, 25], and indirect analysis methods [26] are presently prevalent in the observation and research of wind erosion processes. Due to the intricate and challenging nature of capturing the wind erosion process, previous studies have relied on sand collector or erosion pin methods, which characterize wind erosion conditions using sand transportation rates, but do not provide a direct quantification of the wind erosion rate on a specific plot [27, 28]. Although the wind erosion circle method and the wind erosion disk method provide information on the wind erosion in a given area, it is necessary to conduct further research. This is due to the small size of the instruments used, which raises questions about the representativeness of the observations, and whether the weighing process damages the soil in-situ [29]. The primary objective of utilizing wind tunnel simulation is to examine wind and sand flow structures at specific wind speeds within the field. Nonetheless, it does not simulate diverse complicated wind and sand activities in the field [30]. The indirect analysis approach involves evaluating wind erosion conditions via comparing differences in soil particle compositions before and after wind erosion. However, because of natural erosion, biological processes, and human intervention, the soil undergoes continual changes in particle size composition in its natural state. Therefore, it is challenging to make an accurate comparison of particle size pre- and post-wind erosion. Various models such as WEQ, RWEQ, and WEPS are utilized to estimate wind erosion rates by taking into consideration various factors that impact the wind erosion process. Many of the factors included in the models are obtained empirically from the observation process, and it is difficult to sort out their independence and connections. Verification of the applicability of the tests necessitates observational data [11, 31-33].
The radionuclide 137Cs has been extensively employed to quantify soil erosion [34, 35]. Afshar et al. [36] estimated the rate of soil reformation in western Iran using 137Cs radionuclides and the erosion and deposition rates are 29.8 and 21.8 t·hm-2a-1, respectively. Amini et al. [37] have investigated the amount of sediment of Holocene in Gorgan gulf and southeastern coast of the Caspian Sea. In China, the impact of 137Cs tracer technology on soil erosion has been studied since the 1980s, and the study area has been extended from the Qinghai-Tibetan Plateau region [38-40] to the Yangtze River Basin [41, 42], the Southern Red Loam region [43], the Loess Plateau region [44], the Northwestern Sandy Wind region [45, 46], the Rocky Desertification region [47, 48], and the Northeastern Black Soil region [49, 50], and the land use has involved forested land [51], grassland [25], sandy land [52], cropland [20], and many other land use types. It involves many land use types such as forestland [51], grassland [25], sandy land [52], and cropland [20]. And the study subjects have developed from the beginning of water erosion to the later wind erosion. An important part of these research results is the determination of the background values in the study area, which provides some theoretical basis for future research in this field. While the 137Cs method does not give a reliable estimate of soil erosion caused by non-continuous hydrological events or over the short-term before 137Cs deposition, it is useful for determining soil erosion and accumulation rates on a medium scale (approximately 60 years).
Therefore, this study has two objectives. The initial objective is to collect and analyze the distribution and profile characteristics of the area activity of 137Cs in the northeastern black soil of Hilltop by using the 137Cs tracer method. The second objective is to quantify the soil erosion rate using the mass balance model. This study aims to promote soil and water conservation measures in the region, while also supporting sustainable development in agriculture and forestry in China’s black soil region.
Materials and Methods
Study Area
The research area is located in hebei Watershed (48°50’N-49°10’N, 125°00’E-125°30’E, Fig. 1) within the Heshan Farm, Jiusan Branch, Heilongjiang General Administration of Agriculture and Reclamation, which belongs to the typical black soil area in Northeast China. The climate is cold temperate continental monsoon climate, with obvious seasonal differences, high temperature and rainy in summer, large temperature difference between day and night in autumn and cold and snowy in winter. The average temperature in January is -22.5ºC, the average temperature in July is 20.8ºC, the frost-free period is short, the freezing period is long, and the frozen soil depth is 1.5-2.0 m. The annual average precipitation was 534 mm, mainly from June to August, accounting for 66.6% of the annual precipitation. There is less precipitation in spring, the average precipitation is 60.4 mm. Located at the southern foot of the Lesser Khingan Mountains, this area is a transition zone from the Lesser Khingan Mountains to the Nenjiang Plain. It is a rolling hilly area with a mean slope of 2%. Most of the landforms are high plains and piedmont alluvial plains that intermittently rose and suffered various degrees of cutting during the modern geotectonic movement. The soil is given priority by the typical black soil, and the crop growth period is short, with one ripe year, mainly planting corn, soybean and spring wheat.
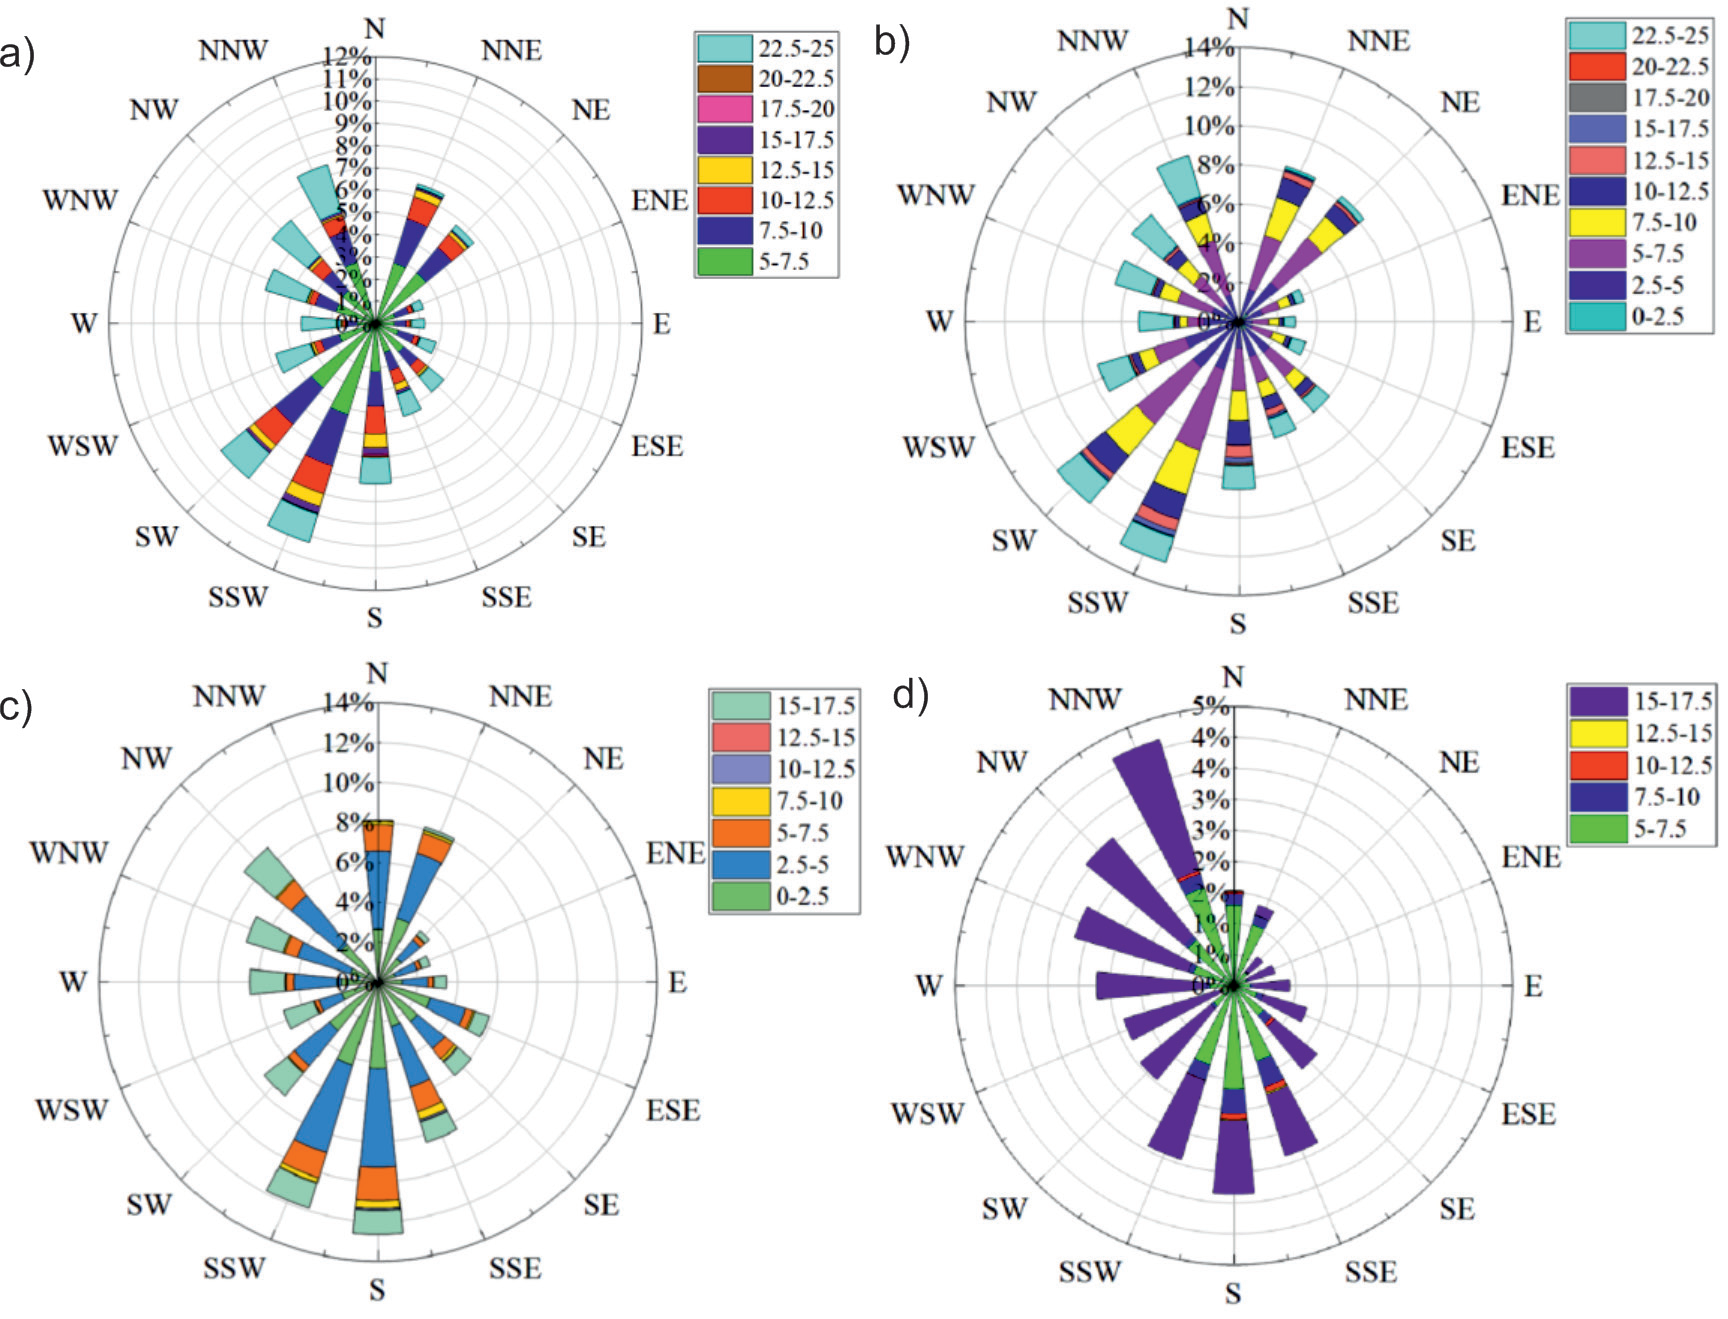
The study area demonstrates an average wind speed of 3.13 m·s-1, with winds concentrated mainly in the northwest and southwest. Fig. 2 shows a relatively high frequency of >5 m·s-1 and maximum wind. Due to the flat landscape and breezy climate, the black soil is vulnerable to wind erosion.
Sample Collection and Processing
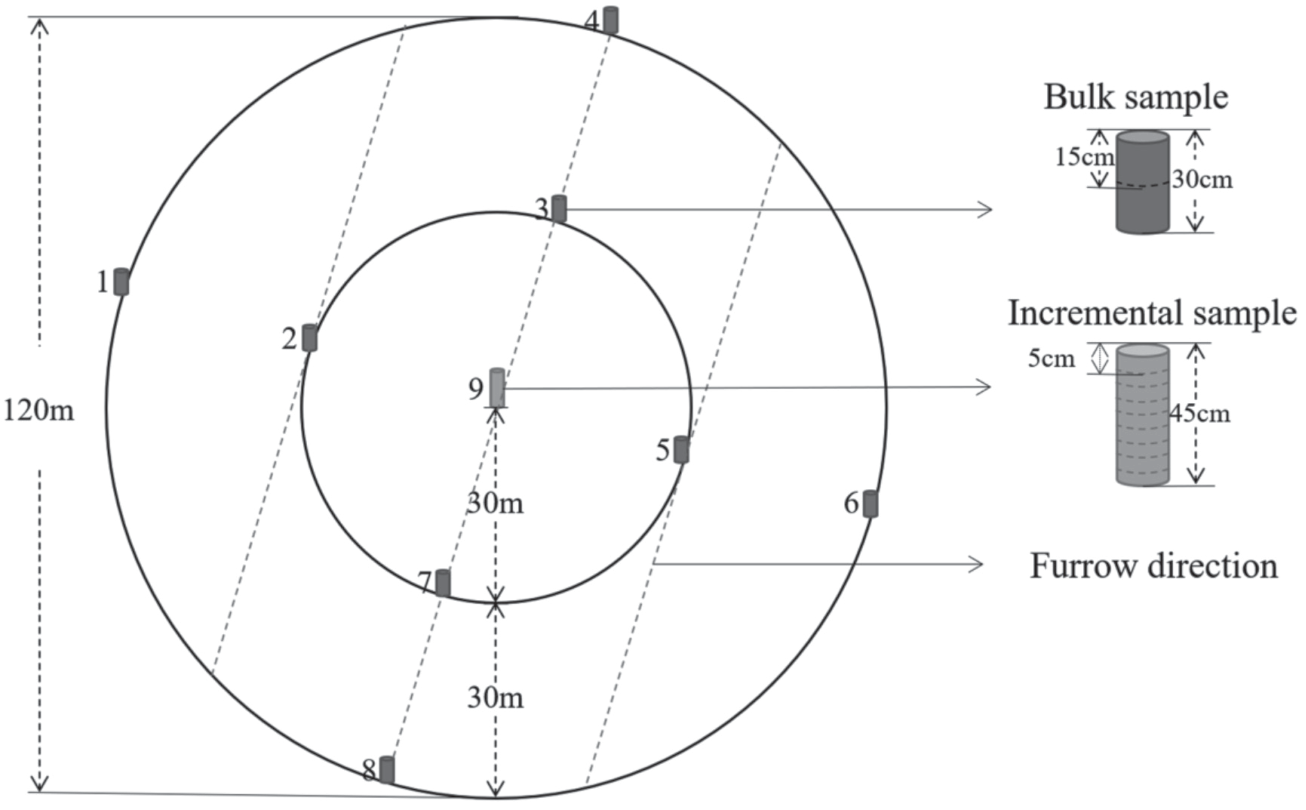
According to the topographical features of the study area, hilltops were selected as the preferred area for arranging sampling points. Although the sampling point itself is situated on a flat hilltop, there are variations in micro-topography across different sampling sites, resulting in depressions in some locations. These, combined with hydraulic factors, lead to abnormal accumulation of 137Cs. Meanwhile, other areas may have small bumps, which accelerate the loss of 137Cs due to hydraulic erosion. Therefore, it is necessary to check the sampling points and remove the anomalies to make the study more accurate. In this study, the Grubbs criterion was used for rejection. This criterion assumes that the observed data follow normal distribution, and the obtained values are arranged in ascending order. In the normal case, data outliers occur under extreme conditions, i.e. minimum or maximum values. Based on this principle, the event hazard rate is selected, and when the measured event is greater than the hazard rate, then the point is considered abnormal. After field investigation, sample points that did not meet the sampling requirements due to topographic features were excluded. Ultimately, 30 hilltops were selected as the 137Cs sampling points for this study. Hilltop the sampling points were all located at the hilltops with slope close to 0, assuming that only wind erosion occurs at these hilltops (Fig. 1). Each hilltop is designed with 9 sampling points, and the hilltop center is designed with one sampling point. The rest of the sample points lie on two mutually perpendicular lines through the center, with an interval of 30 meters and 60 meters on either side of the center point. The first line is perpendicular to the ridge direction, and the second line is parallel to the ridge direction. This results in a total of 9 sample points being fixated at the top of each hill, as illustrated in Fig. 3. 137Cs samples were collected as bulk samples and incremental samples, with 8 bulk samples and 1 incremental sample taken at each hilltops (Fig. 3). 137Cs soil bulk samples are those containing all 137Cs nuclides collected over a certain area. Soil samples were collected from the vertical slope using a root drill with an inner diameter of 8 cm and a height of 15 cm, and soil samples with a soil depth of 30 cm were taken twice. The soil samples were packaged into sample bags and brought back to the laboratory for analysis. 137Cs soil incremental samples are soil samples collected in layers, and the tools used are the same as those used for the bulk samples. The cumulative sampling depth of the incremental samples was 45 cm, with one incremental sample every 5 cm (Fig. 3). The incremental samples were collected to ascertain the specific activity of 137Cs in various soil layers, portraying the distribution pattern of 137Cs in the soil profile. This determination is crucial to establish whether the background value sample points are dependable and if the depth of other bulk samples collected in the same area extends beyond the 137Cs threshold.
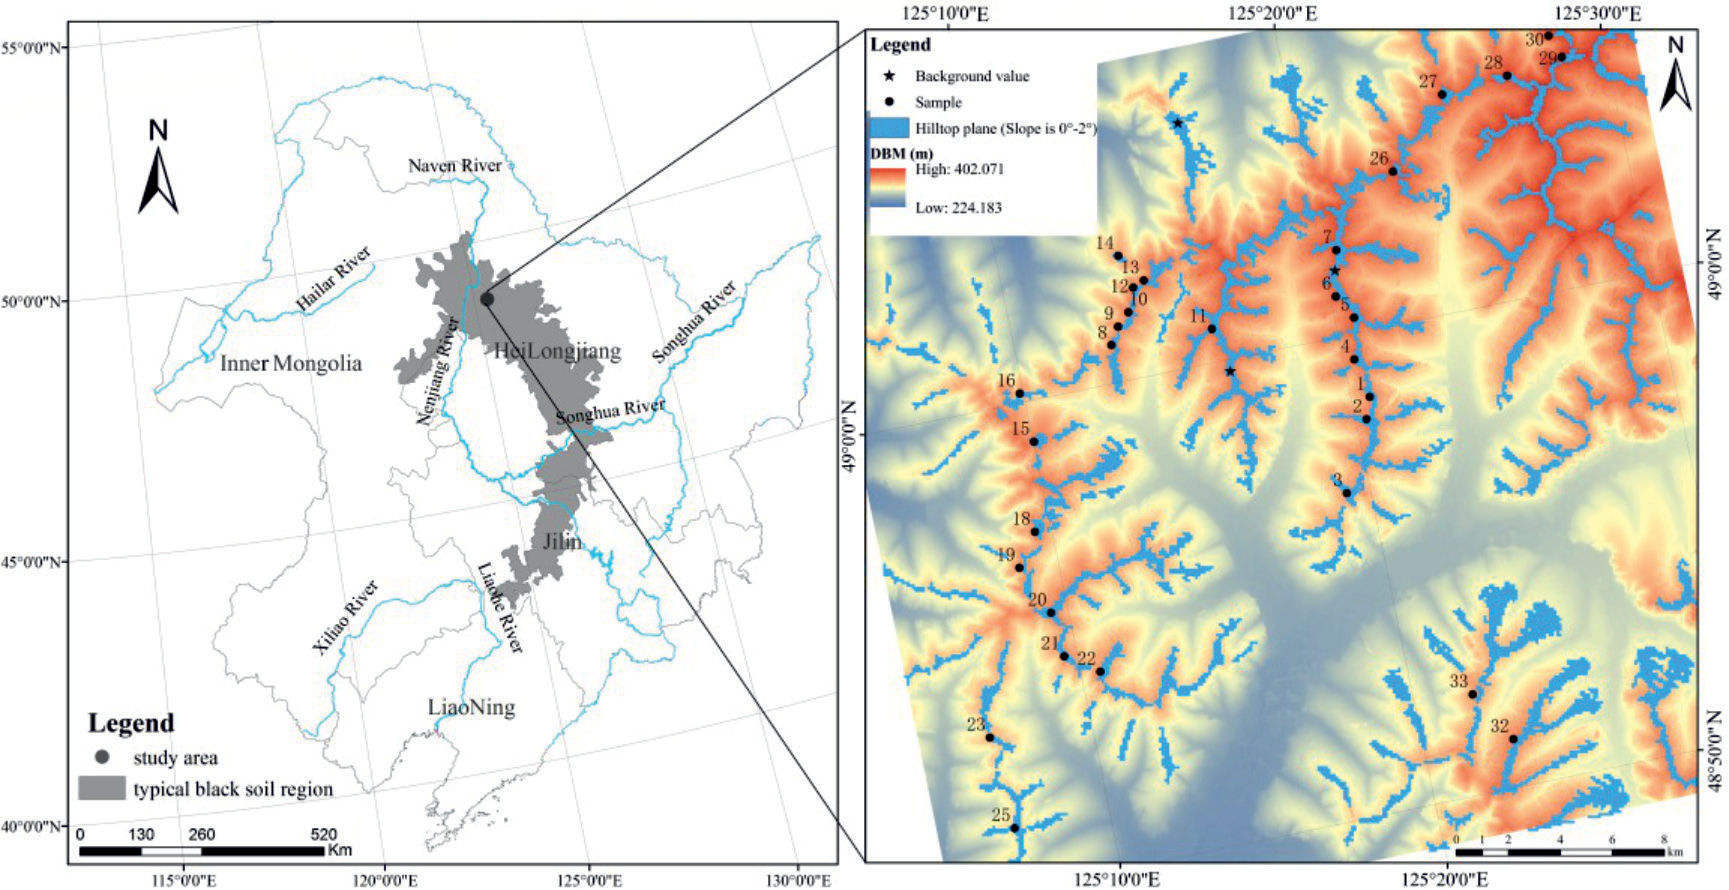
Fig. 2.
Wind conditions of study area (m·s-1). a) ≥5 m·s-1 wind speed, direction and frequency; b) Maximum wind speed, direction and frequency; c) Mean daily wind speed; d) Mean daily ≥5 m·s-1 wind speed.
Based on the topographic map and Google images of the study area, two 137Cs background sampling sites were selected: sample site 1 was located in the Gaofeng Forest Park between Nenjiang County and Heshan Farm of Jiusan General Bureau of Agriculture and Reclamation, and was a flat pine woodland at the top of the diffuse hill, while sample site 2 and 3 was located in a flat secondary natural woodland between teams 6 and 9 of Heshan Farm, with vegetation types of Mongolian oak and birch. Dead branches and fallen leaves cover the surface, with a cover rate of more than 90%. Underneath the dead branches and fallen leaf layer, there is a complete layer of organic matter. Topographic maps and the condition of the soil surface, as well as surveys of the local population, show that the sampled area are flat, with little erosion or accumulation, and have been in a natural state for the past 60 years, undisturbed by human activity. Field investigations found no evidence of human activity. Such sampling sites are consistent with the view of previous scholars that sampling sites of background value should be selected, to the extent possible, in nature reserves, parks, cemeteries and other areas with good natural vegetation, without anthropogenic interference, erosion and accumulation [53-56]. In the first background sample point, 5 holes of whole sample, 2 holes of 5 cm interval layer sample and 1 hole of 2 cm interval layer sample were collected; The other two background value sample points, 2 holes of whole sample and 1 hole of 5 cm interval layer sample were collected. The root drill with an inner diameter of 8 cm and a height of 15 cm was used to collect whole samples and stratified samples, and the sampling depth of both whole samples and stratified samples was 30 cm.
After air-drying naturally, the soil samples were ground and passed through a 2 mm sieve, and the fraction larger than 2 mm was weighed, while the fraction smaller than 2 mm was weighed and boxed for determination of activity. The 137Cs activity of soil samples was measured in the Environmental Radionuclide Laboratory of the State Key Laboratory of Surface Processes and Resource Ecology of Beijing Normal University. The measurement instrument was a coaxial high-purity germanium γ detector (GMX50P4N from ORTEC, USA), and the detector was equipped with a digital multi-channel spectrometer model DSPEC-ji-2.0.
Determination of 137Cs Sample Activity
The commonly used method for measuring the activity of 137Cs is to measure the net area of the full absorption peak of a characteristic γ-ray of a nuclide within a certain time, and then based on the probability of emission of the γ-ray and the detection of the full absorption peak to the activity value of the nuclide, and then divided by the mass of the sample, we can find the specific activity of the nuclide. In this study, the relative comparison measurement method was used. The calculation formula is as follows:
Where A is the specific activity of the nuclide (Bq/ kg), Ce is the scale factor, A' is the activity of the source nuclide (Bq), as is the selected one or several weighted (generally weighted by the probability of emission) net area count rate of the characteristic full-energy peak (s-1), As represents the net area of the characteristic peak of the nuclide obtained from the beginning to the end of the measurement sample, F2 is the sample self-absorption with respect to the scale source γ correction factor, F2 = 1 if the sample density and the density of the scale source are the same or similar; T is the sample measurement activity time (s), m is the mass of the measured sample (kg), Δt is the nuclide decay time, i.e., the time interval (s) between the sampling moment and the sample measurement moment, λ is the radionuclide decay constant (s-1), and F1 denotes the decay correction factor during the sample measurement if the half-life of the analyzed nuclide is greater than 100 compared to the time of sample measurement, F1 = 1; Tc is the actual time (s) of the measured sample.
Soil Erosion Rate Computation
Since the introduction of 137Cs tracer technology to the field of soil erosion research, researchers have established numerous theoretical models [57-62]. In order to obtain a more reliable rate of wind erosion, two Mass balance models were chosen in the present study, one of which is the model of Walling and He [63], and the other, the Zhang ‘s model [64].
Walling and He’s mass balance model (II):
Where τ indicates the percentage of newly deposited 137Cs eroded off portion before it is mixed into the tillage layer, which is chosen as 0.5 in this study; P is the particle size correction factor, the ratio of 137Cs concentration in the mobile deposited portion of soil to 137Cs activity in erosion-migrated soil. This model takes into account the interannual variation of 137Cs deposition flux, the loss of newly deposited 137Cs before they are fully mixed with the cultivated soil, and the sorting nature of erosion. As a result, the accuracy of this model is high. Since the mass balance model not only provides a theoretical analysis of the soil erosion mechanism, but also considers the influence of the interannual variation of the settling fraction of 137Cs during settlement on the estimation of soil erosion rate, the soil erosion rate obtained by applying the mass balance model is relatively accurate, making it one of the most widely used theoretical models.
Zhang’s Mass balance model:
where A indicates Area activity of 137Cs at the erosion sampling location (Bq m-2); A0 is 137Cs background value (Bq m-2); H is the plow layer thickness (cm); ΔH is thickness of annual soil loss (cm); and N indicates The year of sampling. The model is primarily based on the settlement of 137Cs during the 1950s and 1970s, with 137Cs being the largest settlement in 1963 and a similar one before and after 1963. Then all 137Cs are assumed to have settled by 1963 and the advantage of this model is that it has fewer parameters and is easily estimated.
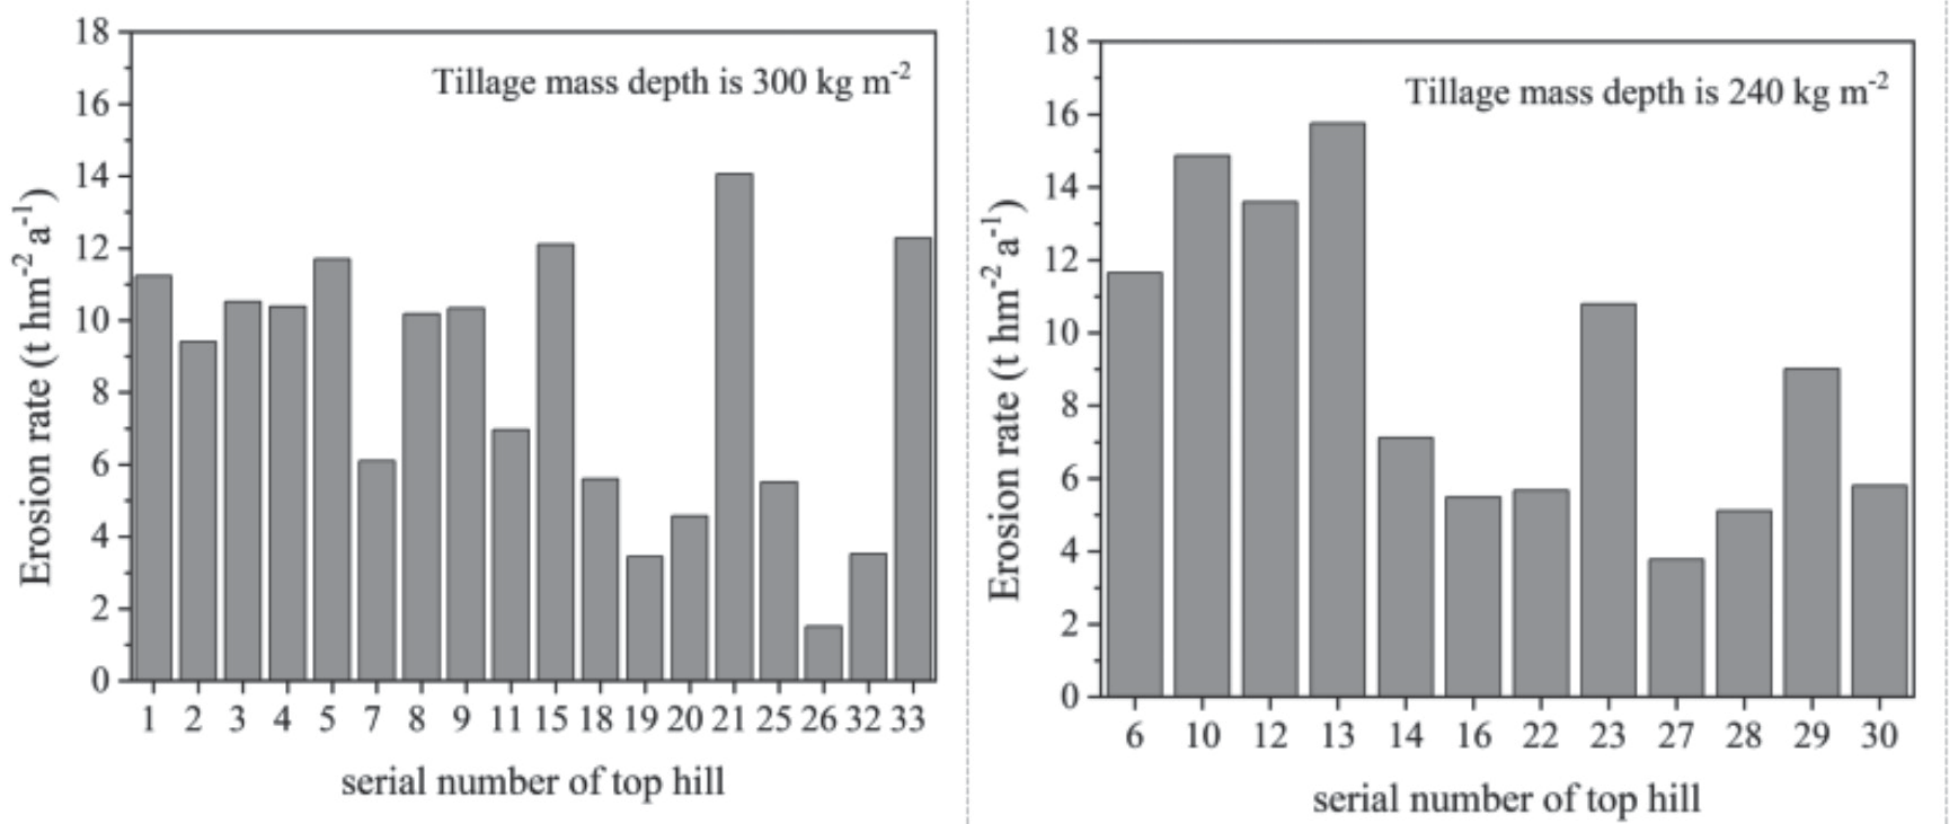
In this study, the mass depth data were obtained by multiplying the tillage depth and the capacity weight based on the buried depth of 137Cs, together with the capacity weight data of the surface soil. All the hilltops were selected with a surface soil capacity of 1.2 g·cm-3, and the tillage depth was divided into two types according to the distribution characteristics: one was 20 cm with a mass depth of 240 kg·m-2; the other was 25 cm with a mass depth of 300 kg m-2, in total 12 hilltops including 6, 10, 12, 13, 14, 16, 22, 23, 27, 28, 29, 30, and the tillage quality depth of the remaining 18 hilltops is 300·kg m-2.
Results
137Cs Background Values
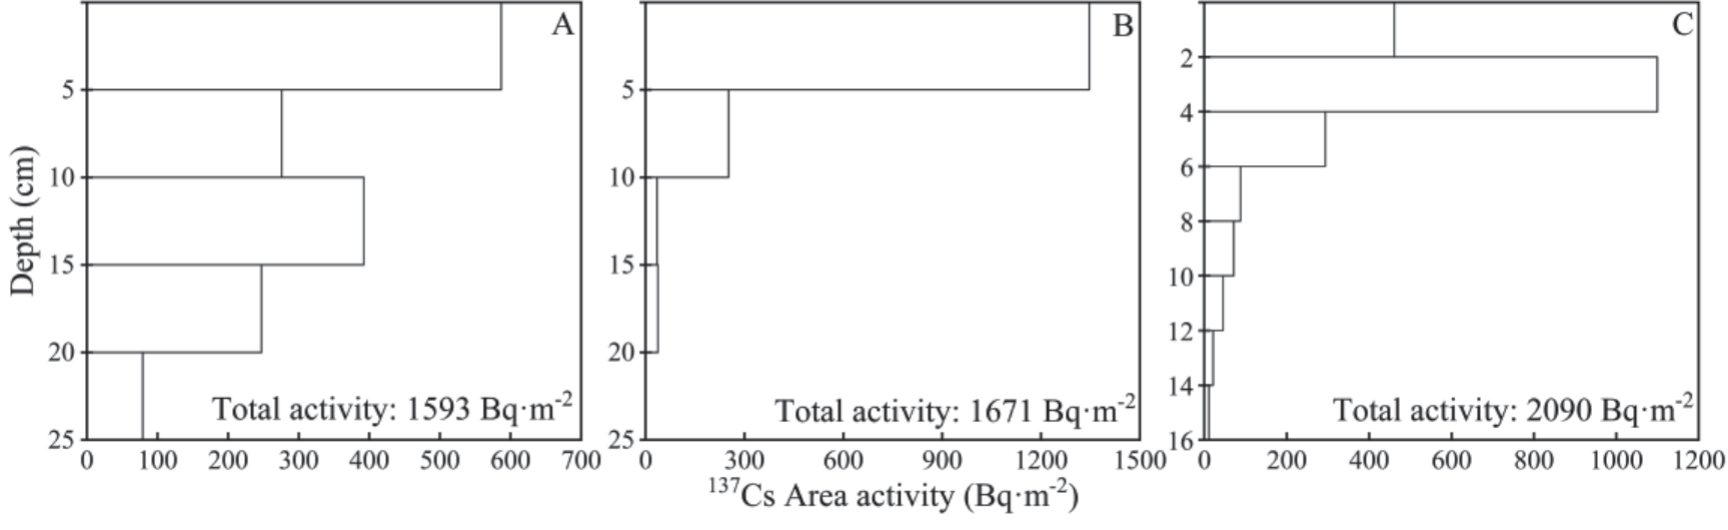
Determination of the background value is a prerequisite for the calculation of soil erosion rate by 137Cs tracer method. Fig. 4 shows the distribution characteristics of the three background profiles in the area, the total activity of background sample point A, background sample point B and background sample point C are 1593 Bq·m-2, 1671 Bq·m-2 and 2090 Bq·m-2 respectively, and the background value of the study area is 1879.7 Bq·m-2 based on the average activity of the full background sample and layer sample, and the model simulation value is 1911.2 Bq·m-2. The measured value is basically the same as the model simulated value. As shown in Fig. 4, the background sample points A and B have a layer every 5 cm, and the background sample point C has a layer of 2 cm. The background layer samples of sample point A and sample point B show an evident decreasing number distribution from 0 to 25 cm, while the background sample point C exhibits a peak activity value at 2-4 cm, but also shows an overall exponentially decreasing distribution.
137Cs Profile Distribution
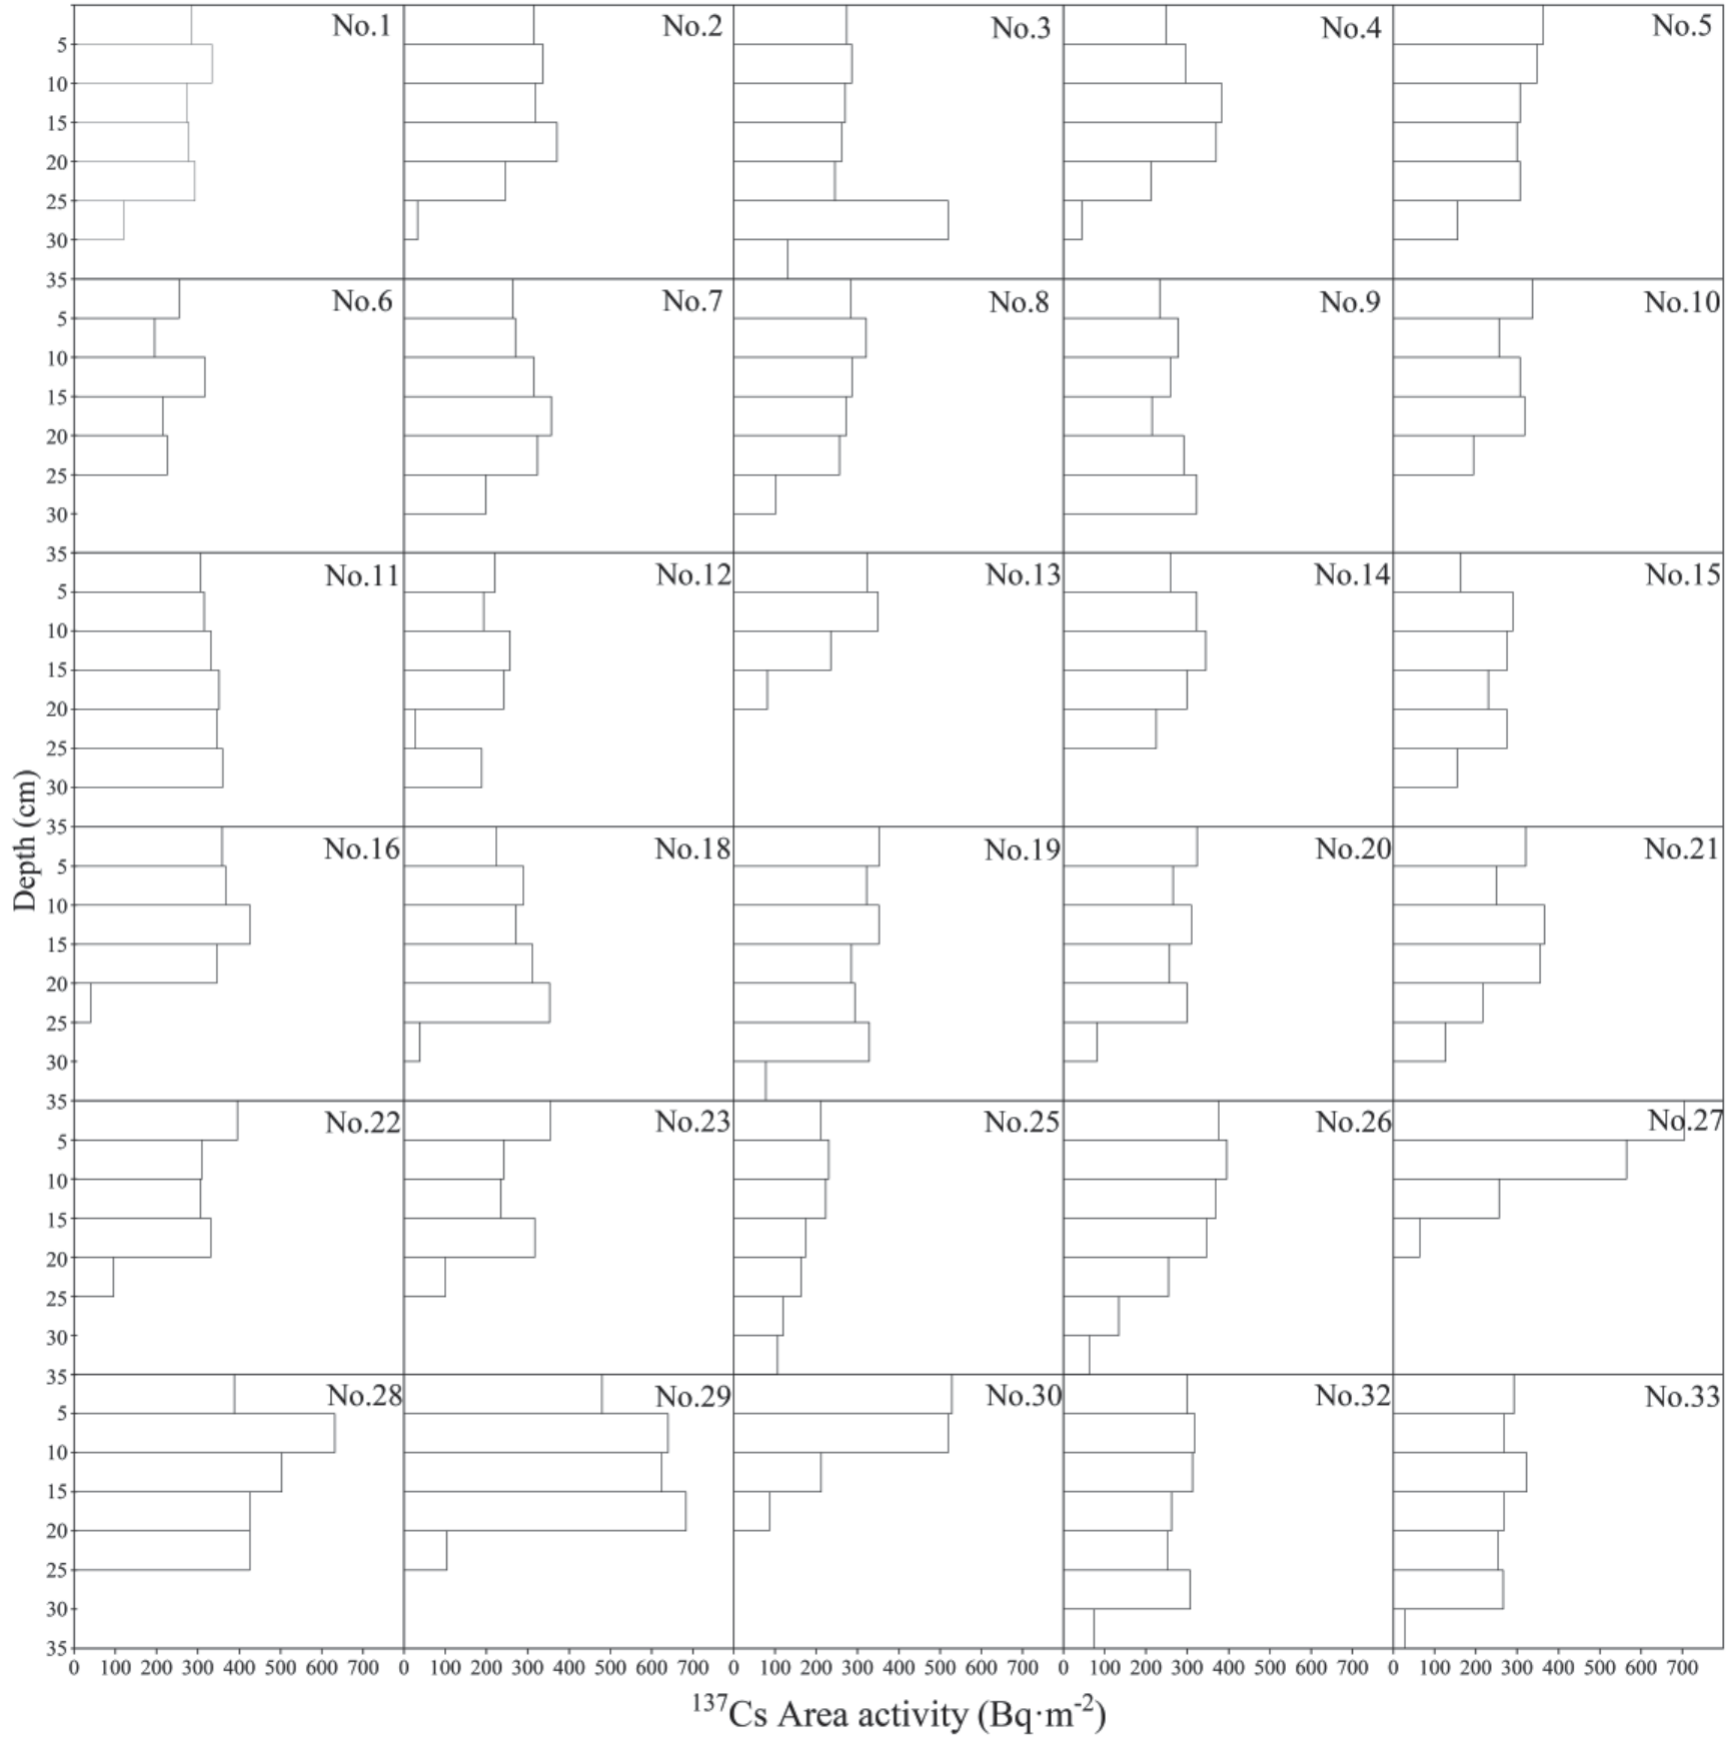
The 137Cs profile activity characteristics are the basis for determining whether the sampling effort can reach the 137Cs buried depth, and for verifying whether the sampling effort is reasonable and whether the next sampling effort is necessary. In addition, the 137Cs profile distribution characteristics also provide the basis for the determination of the tillage depth parameters required in the model calculation process. Based on the area activity characteristics of 30 layered 137Cs samples at the hilltops, the 137Cs profile distribution in this study can be categorized into three forms: 1) the uniform distribution of 137Cs in the surface layer of the cultivated land, and most of the study area belong to this type of distribution, which is consistent with the profile distribution of 137Cs in cultivated land; 2) uniform in the upper layer at a certain depth, and the content of 137Cs in the soil increases rapidly in the next layer, which is probably due to the deep plowing of the local soil at about 40 cm by large machinery 20 to 30 years ago, and the plowing depth has not reached 40 cm since the deep plowing, after which the 137Cs in the surface layer gradually decreases at a certain distance with the erosion phenomenon, while the 137Cs in the bottom layer basically remains unchanged after the deep plowing, thus producing such a profile distribution characteristic; and 3) exponentially decreasing with the deepening of depth, which may be related to the years of reclamation of Hilltop, and the later reclamation leads to higher 137Cs distribution in the surface layer than in the lower layer, for example, the profile distribution features of 137Cs at the hilltops of 13, 17 and 20 (Fig. 5).
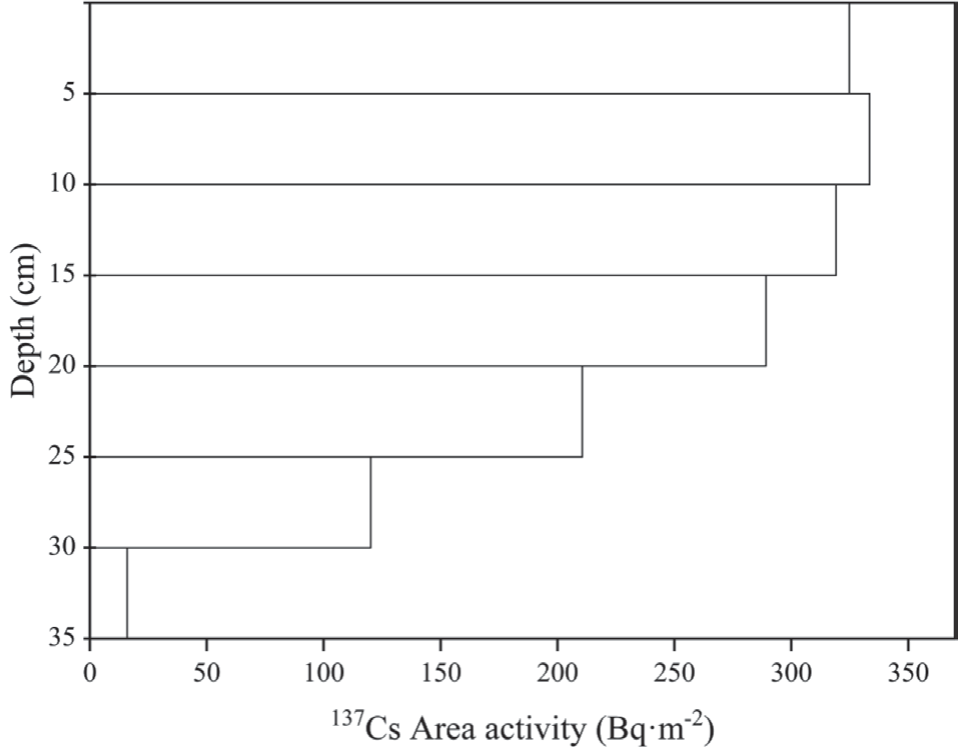
As shown in Table 1, the total activity at each site was concentrated between 1000-2500 Bq·m-2, with the maximum value of 2531 Bq·m-2 and the minimum value of 990 Bq·m-2. The average total activity was 1613.3 Bq·m-2, and the average 137Cs profile at the hilltops in Fig. 6 showed a uniform distribution from 0 to 15 cm. After 15 cm, the 137Cs content gradually decreased until it disappeared with the increase of depth. Most of the sample sites disappeared when the 137Cs content reached 30 cm depth, but the sample sites No. 3, No. 19, No. 25, No. 26, No. 32 and No. 33 still exhibited 137Cs at 30-35 cm.
Erosion Rate Characteristics of the Studied Area
Based on the Grubbs criterion, we have excluded 24 samples from the 270 collected from 30 hilltops due to their outlier status. These samples included eight full 137Cs samples and one 137Cs layer sample. After removing the outliers, the average area activity of the remaining samples indicates that the 30 Hilltops in our study area have an activity of 1541 Bq·m-2, which is significantly lower than the background value of 1879.7 Bq·m-2. This suggests that soil erosion has occurred at the hilltops. The area activity of 137Cs between the hilltops did not vary significantly, ranging from 1328 Bq·m-2 to 1764 Bq·m-2, with a mean value of 1548 Bq·m-2, which closely resembles the median value. These results indicate that the area activity of 137Cs conforms to a normal distribution, with a standard deviation of 115 and a coefficient of variation of 7. The study found that 47% of the samples were small. The mean error at a 95% confidence level was only 43 Bq·m-2, which suggests that there was no significant difference in the mean area activity of 137Cs across all sampling sites in the study area.
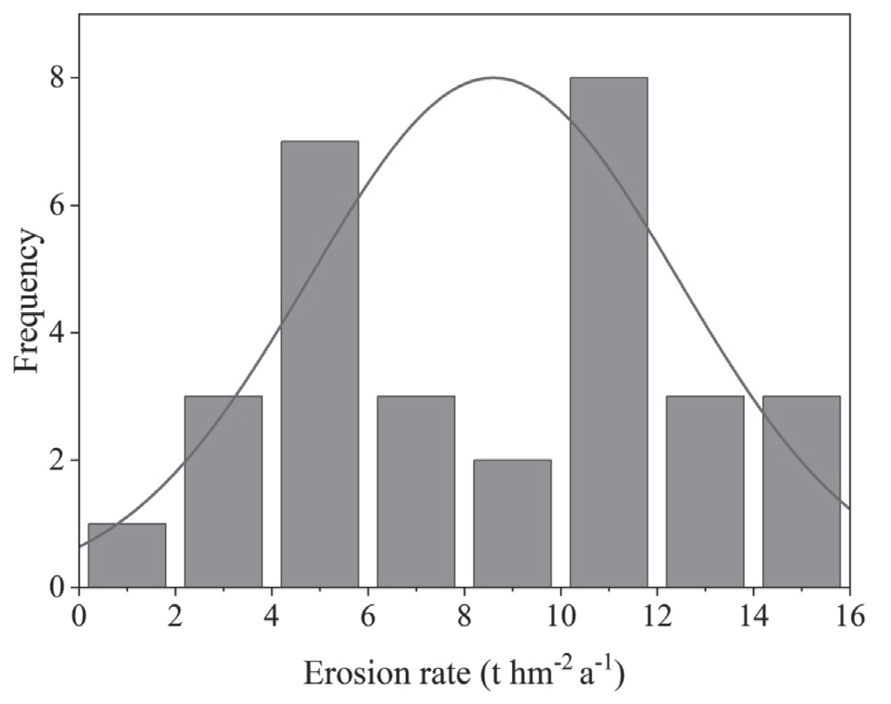
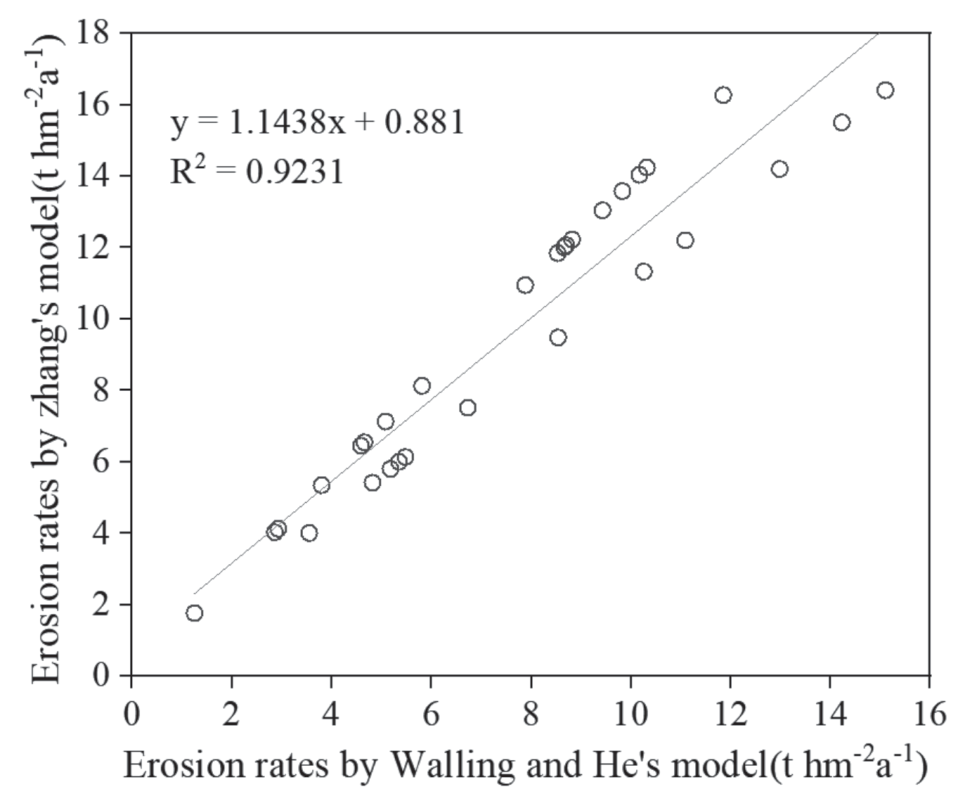
The erosion rate computed by two Mass balance models was averaged as the erosion rate value of the sample points to give a relatively reliable erosion rate. The wind erosion rates of the two types of hilltops are shown in Fig. 7, where the average wind erosion rate of 300 kg·m-2 is 9.05 t·hm-2a-1 and the average wind erosion rate of 240 kg·m-2 is 8.30 t·hm-2a-1. The difference in the average wind erosion rate between the two types of hilltops was small, and the one with a tillage mass depth of 240 kg·m-2 was slightly larger than the one with a tillage mass depth of 300 kg·m-2. The mean wind erosion rate for all sample sites was 8.60 t·hm-2a-1 with a median of 9.01 t·hm-2a-1, and the mean and median values were very similar. The difference between the maximum and minimum values is 8.9 t·hm-2a-1 with a standard deviation of 3.82 and a coefficient of variation of 44.4%. The wind erosion rate in the study area still varies greatly geographically, and the wind erosion rate in the study area is mainly between 7.17 and 11.03 t·hm-2a-1, but the wind erosion rate error is ±0.70 t·hm-2a-1 at the 95% confidence level, indicating that the wind erosion level is exactly around 8-12 t·hm-2a-1 (Fig. 8, Table 2). The relationship between erosion rates calculated by two Mass balance models is shown in (Fig. 9).
Table 1.
Area activity of 137Cs in stratified samples at each hilltop.
Discussion
From the study’s findings, the background value in this study area was found to be 1879.7 Bq·m-2, which is similar to the background values measured by Qi et al. [65] in the flat woodland of Nenjiang County, Heilongjiang Province and Hu et al. [66]. In the central-eastern part of Inner Mongolia. At the same time, the background values are relatively high compared to those measured by Fang et al. [67] in agricultural land at the hilltops, Dehui City, Jilin Province, and low compared to those measured by Yan et al. [68] (Table 3), but the differences are not significant, which may be due to the micro topographic differences in the specific selection of background sampling sites and testing error of the probe of high purity germanium from γ-energy spectrometer, which is used to determine 137Cs activity [69]. It should be noted that the background sample of Yan's study was taken from the grassland, which is prone to the movement and deposition of soil particles [68]. Given that the sampling site's location at the top of the forest park, the forest belt's width measuring several hundred meters, and the saturation path of the sand-carrying wind being close to exhaustion, wind erosion or accumulation is unlike to occur at this site. Moreover, wind and sand movement mainly take place near the surface. On the other hand, the simulated value of 1911.2 Bq·m-2 calculated by the model of this study is basically the same as the measured background value, and in summary, the background value of 1879.7 Bq·m-2 determined in this study is reliable.
According to Adrian Chappell [70], Yan et al. [68] suggested that correction of the 137Cs specific activity of background profiles is necessary in wind erosion areas to achieve accurate and dependable background values. This is the primary rationale for collecting layer samples and analyzing the characteristics of 137Cs area activity profiles in this study. In this study, we discovered that the distribution of profile samples of 137Cs in the background layer did not adhere to the standard exponential curve of 137Cs activity decreasing with depth, Instead, we observed exceptionally high values of 10-51 cm at sample point A and 2-4 cm at sample point C, which confirms that simulating the background value with the standard exponential form of 137Cs profile distribution curve may overestimate the surface 137Cs activity. Therefore, we cannot use the exponential form curve to correct the 137Cs profile distribution curve. Zhang et al. [71] and Li et al. [72] also found that the distribution characteristics of 137Cs background layer samples in the surface layer did not exactly follow the standard exponential form, and the 137Cs activity profile characteristics showed a spike-shaped curve in the surface layer 2-4 cm, which was consistent with the 137Cs profile distribution characteristics of sample site C in this study.
Table 3.
Statistics of related studies on background values of 137Cs in the Northeast (Bq·m-2).
When collecting soil samples, it is necessary to ensure that 137Cs in each sample site are completely captured in the soil profile, i.e., the sampling depth of 137Cs is required to be larger than the buried depth of 137Cs. In this study, stratified samples were collected from each hilltop and the accumulated depth of stratified samples was 45 cm. However, the buried depth of 137Cs in arable land is about 30 cm above the surface. The depth of tillage is limited to a certain level, generally about 20 cm. In the black soil region of Northeast China, the land is generally owned by farms collectively, and the land area is vast. In the planting season in spring and plowing season in autumn, large machinery is used, and the plowing depth is deeper than the humans and animals, with a depth of about 25-30 cm. As a result, a sampling depth of 45 cm is suitable for our study, guaranteeing the complete collection of 137Cs in the soil profile. In this study, the analysis of 137Cs stratified samples at each hilltops revealed that the profiles of most of the layers were uniformly distributed in the surface layer, which also confirmed the history of mechanical deep tillage and deep plowing in Northeast China.
The mean wind erosion rate in this study area was 8.60 t·hm-2a-1 by the 137Cs method, with an overall distribution between 7.17-10.03 t·hm-2a-1, which is consistent with the results of Wang et al. [73] of wind erosion rates of 6.31-11.55 t·hm-2a-1 at the tops of two gently sloping hilltops in the black soil region of Northeast China. This result is very close to Wei’s measurement of erosion rate ≤8.4t hm-2a-1 using the 137Cs method on a flat mountaintop near the study area [74], Due to the fact that the black soil area in Northeast China has always been considered to be dominated by water erosion and freeze-thaw erosion, the 137Cs method is mainly used to trace erosion at the slope and watershed scales in this area [48, 49]. The 137Cs method is rarely used to directly track wind erosion in mountaintop study areas. Therefore, we compare and analyzed the wind erosion rates of other methods in the study area. The result is slightly higher than the 3.63 t hm-2a-1 measured by Wang (2020) using the sand collector method [75]. The possible reason for the slightly lower observed wind erosion rate is that the wind resistance caused by the observation instrument reduces the collection efficiency of the sand collector. Overall, this also indicates that soil erosion in the study area has not been improved in recent years. Although soil erosion in the study area is mild, the erosion rate exceeds the tolerable soil loss of 2 t·hm-2a-1 in the northeastern black soil region [76]. The wind erosion rates of 11.8-22.4 t·hm-2a-1 of farmland in the Qinghai Gonghe Basin using the 137Cs method by Yan et al. [77], 3 t·hm-2a-1 of plowed and tilled land in Zhangbei County, Hebei Province using wind erosion discs by Wang et al.[78], and 4.9 t·hm-2a-1 of tilled land in Wuchuan County, Inner Mongolia using the wind erosion circle method by Gao et al. [79], and the results of this study were in the same order of magnitude as those of the above scholars. Some scholars used wind erosion models (RWEQ, WEPS) in grasslands in northern China [80], and the Yellow River Basin [33], and obtained similar conclusions. In addition, the wind erosion rate in this study is roughly 20-30% of the overall erosion rate when compared with the total erosion modulus (2000-3500 t km-2 a-1) in the recent black soil area [81, 82]. It can be seen from the above studies that wind erosion is still a very important mode of erosion in the Northeast black soil zone, although the majority of the wind erosion in the farmland in northern China is mild.
According to the activity profile characteristics of 137Cs area in this study, most of the sample sites in this study area disappeared when the 137Cs content reached 30 cm in depth, and some sample sites still had less 137Cs at 30-35 cm. To express the profile distribution pattern of 137Cs in the sample sites and its indicative meaning more accurately, the sampling depth should be appropriately increased in the future studies.
Conclusions
In this study, the 137Cs tracer method was utilized to investigate soil erosion traits in the black soil region of Northeast China. The wind erosion traits, including background values and soil erosion rates over the years, were elucidated. These findings have significant implications for agricultural sustainable development and soil and water conservation in Northeast China’s black soil region. The primary conclusions are outlined below:
(1) The average area activity of 30 Hilltop in the study area was 1541 Bq·m-2, which was significantly lower than the background value of 1879.7 Bq·m-2, indicating that a certain degree of soil erosion had occurred at the hilltop in the study area. The distribution characteristics of 137Cs profile are in three forms. Most of the 137Cs area activity is evenly distributed in the surface layer, the second is evenly distributed in a certain depth in the upper layer, and the content of 137Cs increases rapidly in the next soil layer, and the third is in the form of exponential decline with the deepening of depth. The average 137Cs profile distribution at the hilltop in the study area is relatively uniform from 0 to 15 cm, and the activity of each layer is about 325 Bq·m-2. The 137Cs content gradually decreases and disappears with the increase of depth after 15 cm.
(2) The average wind erosion rates at 300 kg·m-2 and 240 kg·m-2 tillage mass depths were 9.05 t·hm-2a-1 and 8.30 t·hm-2a-1, respectively, and the difference in average wind erosion rate between the two tillage mass depths was small. The average wind erosion rate of all samples is 9.01 t·hm-2a-1, and the coefficient of variation is 44.4%. The regional difference of wind erosion rate in the study area is large. The wind erosion rate in the study area is mainly between 4 and 12 t·hm-2a-1, which is mild erosion. However, its erosion rate is higher than the tolerable soil loss 2 t·hm-2a-1 in the black soil region of northeast China. Therefore, soil erosion control in the black soil region of northeast China should be paid more attention.

