

Introduction
Against the background of increasingly serious global environmental problems and the widespread dissemination of the concept of sustainable development, the efficient utilization of land resources and ecological protection have become the focus of attention for all countries. With a land area of 9.6 million km2, China ranks third in the world, but due to its large population, it has relatively few land resources per capita, especially per capita arable land, which is far below the world average. This situation has a direct impact on national income and land product output and has become one of the most important factors constraining the country’s economic development. China’s inefficient utilization of land resources is mainly manifested in the serious threat to the ecological environment posed by the over-exploitation of land resources. As the global population continues to increase and land resources continue to be exploited, the human living environment is facing serious challenges. The utilization and coverage characteristics of land resources not only affect sustainable socio-economic development but also indirectly influence changes in the global environment. In addition, China, as the world’s largest developing country, is undergoing rapid urbanization and industrialization. China’s arable land had undergone significant changes in terms of quantity and quality, which posed a serious challenge to the demand for and the efficiency of the utilization of land resources. In order to achieve sustainable development of land resources, the Chinese Government has taken a series of measures, including improving the efficiency of land resource utilization, promoting green and ecological agriculture, and strengthening land market regulation. These measures aim to optimize the allocation of land resources and promote the modernization of agriculture while protecting the ecological environment. However, resource waste and ecological damage are still common in China’s current land use, and there is an urgent need to scientifically and reasonably assess and improve land use efficiency. Studying the green land use efficiency in China and exploring its current situation and influencing factors is not only of great practical significance but also helps to formulate more effective policies and measures, so as to better cope with the challenges in the utilization of land resources and achieve the goal of sustainable development. This paper’s research targets 31 provinces in China, covering inter-provincial data from 2010 to 2022. The study covers a wide geographic scope and spans more than ten years, allowing it to comprehensively reflect the dynamic changes and regional differences in the green land use efficiency of Chinese provinces. This study adopts a model that considers non-expected outputs to measure the green land use efficiency of Chinese provinces. This approach not only considers the positive effects of land use but also integrates its possible negative effects, providing a more comprehensive and realistic efficiency assessment. In addition, through the joint index analysis, we delve into the main causes of changes in land green use efficiency and further examine the absolute differences in land green use efficiency and its dynamic distribution characteristics across provinces using kernel density analysis. Such a multilevel analysis method is not only innovative but also reveals the complexity and diversity of land use efficiency more accurately. The main objective of this study is to measure and evaluate the land green utilization efficiency of Chinese provinces and to reveal its current status and trends of change. Through the analysis, we hope to identify the key factors affecting the green land use efficiency and make corresponding suggestions for improvement. Specifically, this study attempts to address the following questions:
What is the level of green land use efficiency in China’s provinces during 2010-2022? What factors contribute to differences in land use efficiency? How to improve the efficiency of green land use through policy support, scientific and technological research, and development?
This study has not only important theoretical significance but also significant practical application value. In theory, we enrich the research methods of land use efficiency evaluation by introducing the non-expected output model and a variety of analysis methods. In practical application, the research results will provide a scientific basis for government departments to formulate land use policies, improve the utilization efficiency of land resources, achieve sustainable development of land resources, and promote the coordinated development of the economy and the environment. It is hoped that the research can provide a beneficial reference for land resource management and sustainable utilization in China and other developing countries.
Literature Review
In recent years, the Chinese government has continuously introduced various policies aimed at improving the efficiency of land use and protecting the ecological environment, and scholars have also conducted a large number of studies. He T. et al. [1] believe that urban land use efficiency is the key to evaluating land output capacity and regional development quality. Based on the inherent characteristics of urban land use efficiency, He T. et al. built a feasible analysis framework by using multi-source remote sensing data and proposed three indicators: urban construction land intensity, urban night light intensity, and urban interest point density.
The urban land use efficiency index was constructed to explore the spatial pattern of land use efficiency in resource-based cities. Li J. et al. [2] believe that studying and evaluating urban land use efficiency is a necessary means to optimize land use patterns and policies further. The author proposed an evaluation method of land use efficiency in prefecture-level cities based on multi-source spatio-temporal data. It includes the evaluation index system of land use efficiency at the district level, the quantitative representation of the evaluation index based on multi-source spatiotemporal data, and the calculation model of land use efficiency. Taking Ningbo City as an example, the research results show that the urban land use efficiency of Ningbo City has a strong spatial autocorrelation. Qiu G. et al. [3] considered arable land to be an important strategic resource for safeguarding human survival and development. They introduced the environmental constraint index into the study of arable land utilization efficiency. Based on the arable land utilization efficiency evaluation index system, with carbon emissions as the undesirable outputs, they measured the arable land utilization efficiency in China using the super-efficiency thinking model with data from 2009 to 2019. The results of the study show that China’s arable land utilization efficiency generally shows a fluctuating upward trend, with fluctuations ranging from 0.871 to 0.948, demonstrating a high utilization efficiency. Shen C. et al. [4] explored the complex dynamic relationship between urban-rural integration development and land use efficiency, established an evaluation model of urban-rural integration development, used the super-efficiency SBM model to measure land use efficiency, and studied the spatial-temporal pattern evolution of the coupling between urban-rural integration development and land use efficiency in the Yellow River Basin. Wang Y. et al. [5] believe that cultivated land is an important resource for human survival and development, and its utilization efficiency is directly related to national food security and social harmony and stability. Based on the stochastic frontier production function, the cultivated land utilization efficiency of 342 prefecture-level administrative regions in China from 2003 to 2019 was calculated. Spatial autocorrelation analysis and the Gini coefficient decomposition model were used to investigate the spatial agglomeration and spatial disequilibrium of cropland use efficiency in China. Wang Y. et al. [6] believe that compact development and efficient land use are effective ways to solve the development dilemma and enhance the vitality of shrinking cities. The author established a framework to study the coordination between urban compactness and land use efficiency under the background of urban shrinking. The compactness and land use efficiency were quantitatively measured by the entropy method and overrelaxation metric model. On this basis, the coupling coordination degree model and the quadrantal diagram method are used to discuss the coordinated development level of the regional economy and the coordination relationship between them. Zhou Z. et al. [7] believe that the excessive expansion of urbanization areas leads to the arbitrariness of land use, the excessive consumption of superior agricultural land and water resources, the serious fragmentation of the agricultural landscape, and the gradual deterioration of the agricultural ecological environment. All these factors combine to lead to the low efficiency of land use.
The comprehensive evaluation of land use efficiency of urban agriculture is a key issue in land use research. The authors developed a framework for assessing the efficiency of urban agricultural land use and identified agro-ecosystem services and functions as important outputs of agricultural land. They concluded that rapid urbanization and the shift from traditional grain cultivation to modern urban agriculture have led to a steady increase in the cost, output, and land use efficiency of urban agriculture. Zhang R. et al. [8] believe that revealing the spatio-temporal pattern and convergence characteristics of urban land use efficiency has important guiding significance for adjusting and optimizing regional urban land use structure. The author takes provincial units in China as the research object and constructs an urban land use efficiency evaluation system considering unexpected output. The quantitative measurement of provincial urban land use efficiency from 2000 to 2020 is carried out by using the relaxation-based measurement model. The results show that the urban land use efficiency of the whole province is constantly improving, and the regional differences are shown in the eastern region, the northeast region, the central region, and the western region. Feng Y. et al. [9] believe that improving the efficiency of urban land green space use is of great significance in promoting sustainable development. Based on the super-efficiency relaxation model, the urban land green space use efficiency of 279 cities in China from 2011 to 2019 was first measured. The causal effect of the establishment of pilot free trade zones on urban land green space use efficiency was then investigated using the multi-period difference method. The results showed that the pilot free trade zone significantly improved the efficiency of urban land green use, especially in eastern cities, coastal cities, and cities with higher economic development levels. He S. et al. [10] believe that effective land use is a prerequisite for sustainable urbanization. The author’s empirical analysis includes 336 prefecture-level cities in 31 provinces and 4 regions in China, and the research results show that from 2000 to 2015, China’s urban form indicators show significant regional differences, and land use efficiency also shows significant regional differences. Yang H. et al. [11], based on defining the connotation of land use eco-efficiency, calculated the ecological efficiency of land use from 2003 to 2015 using the mixed direction distance function and analyzed its spatial convergence with the spatial econometric model. The results showed that land use eco-efficiency was relatively ineffective in most areas of China, except Guangdong and Guangxi. The spatial distribution of land use eco-efficiency was polarized. Ma Y. et al. [12] believe that improving and evaluating land use efficiency is an important pillar to achieving sustainable development goals. The authors reviewed 208 representative papers, oral reports, and project reports to systematically and comprehensively understand the current research status and future trends of land use efficiency evaluation. The results show that the number of land use efficiency evaluation papers is increasing rapidly, mainly in environmental science and ecology. Zhang M. et al. [13] believe that high land use efficiency is the key to improving total factor productivity and an important force in achieving sustained economic growth. We investigate the Slack-Based Measure (SBM) model and the Malmquist Productivity Index (MPI) within the framework of data envelopment analysis to examine regional differences and efficiency decomposition. The results show that China’s service land use efficiency is unbalanced, following an inverted growth pattern of being low in developed areas and high in less-developed areas. Xie H. et al. [14], based on the Sequential Generalized Directional Distance Function (SGDDF) and the Metafrontier Non-Radial Malmquist Index (MNMI), analyzed the dynamic changes, saving potential, efficiency decomposition, and influencing factors of industrial land use efficiency. Taking the urban agglomeration in the middle reaches of the Yangtze River from 2003 to 2012 as the research object, the author conducts an empirical study on the urban agglomeration in the middle reaches of the Yangtze River. The results show that the utilization efficiency of industrial land has the potential to improve significantly, and the saving potential of industrial land is on the rise. Den X. et al. [15] believe that strengthening sustainable land use management can achieve a high level of land use and ecological efficiency in different regions of China. Taking Hebei Province, China, as an example, the author examines the relationship between land use management and land ecological efficiency. Statistical analysis methods, such as stochastic frontier analysis, are used to study land use transformation and land ecological efficiency in Hebei Province. The research results show that land use output is the key factor linking land use management and land ecological efficiency, and the spatial difference in land ecological efficiency in Hebei Province is obvious. The research results show that land ecological efficiency decreases as the distance from the city center decreases. Jiang X. et al. [16], based on panel data from 285 urban cities in China from 2003 to 2015, used data envelopment analysis to measure China’s urban land use efficiency and then applied the spatial Durbin model to test the spatial effect of China’s land transfer marketization on urban land use efficiency. The results show that on the one hand, land transfer marketization can significantly improve the urban land use efficiency in the region, and on the other hand, it has a relatively high inhibition effect on the urban land use efficiency in the spatially related region. Yang K. et al. [17] argued that previous studies paid little attention to the role of technological progress in measuring urban land use efficiency, and ignored the interaction of total factor productivity, technological progress, pure technical efficiency, and scale efficiency in the urban land use process. The author used the Malmquist index method to measure and decompose the total factor productivity of urban land use and used the panel vector autoregressive model to investigate the interaction among total factor productivity, technological progress, pure technical efficiency, and scale efficiency of urban land use in China from 2003 to 2016. The research shows that from 2003 to 2016, China’s urban land use efficiency generally increased, but the growth rate of urban land use efficiency generally declined, which is mainly reflected in the total factor productivity of urban land use. Chen X. et al. [18] believe that land fragmentation reduces land use efficiency and hinders sustainable development in rural areas, which can be alleviated by optimizing land resource allocation. The author uses a multi-objective particle swarm optimization algorithm to determine the optimal land use adjustment strategies under different land use optimization objectives, with the advantages and disadvantages of these strategies evaluated based on land use efficiency. Taking Xinxing County, Guangdong Province as an example, the experimental results show that the village-based land use optimization strategy can improve the land use efficiency of the most fragmented cultivated land in the study area.
In recent years, in addition to Chinese scholars researching land use, international scholars have also conducted extensive research on various aspects of land use. Allan A. et al. [19] examined the drivers of land use and land cover change over the last decade, and to further contribute to the Sustainable Development Goals (SDGs), Bloomfield G. et al. [20] proposed a methodology for establishing local sustainable land management in the tropics. Urban sprawl and infrastructure pose significant sustainability challenges, making it crucial for countries to implement advanced land use planning and guidance tools. The authors conducted a study on how countries such as Germany, Switzerland, the Netherlands, Spain, and Poland are mitigating urban sprawl and promoting land governance and sustainable use. All the countries assessed have implemented monitoring systems and formal environmental assessments for land use and construction plans. The assessments show that countries such as Germany, Switzerland, the Netherlands, Spain, and Poland have made great strides in adapting their environmental and planning laws to the requirements of sustainable development, but that various opportunities for improvement still exist [21]. From the perspective of spatial ecology, urban expansion is accompanied by a decrease in population density, leading to inefficient urban growth. By studying the contributions of the three growth patterns and their relationship with urban land use efficiency, it was found that cities experiencing inward expansion are mainly located in the Northern Hemisphere, while cities in the Southern Hemisphere tend to expand more outward than inward. Additionally, a positive correlation was identified between the annual rate of inward expansion and the annual rate of change in urban density [22]. Many parts of sub-Saharan Africa are becoming increasingly vulnerable due to high temperatures and low precipitation associated with climate change, with the Karoo region of South Africa being particularly at risk. The study shows that increasingly marginalized agriculture both leads to and is exacerbated by changes in land tenure. Other causes of land tenure changes are varied, including uncertainty about the future of land reform in South Africa. Finally, the study discusses the implications of farm efficiency for land reform policies [23]. The rapid growth of the urban population in the twenty-first century has driven the expansion of metropolitan areas and increased the demand for land in peri-urban areas, which are often subjected to compulsory land acquisition to support urban development processes. These processes have resulted in extensive changes to land tenure systems, rights, relations, and institutions, contradicting the nature of land as a fundamental and limited commodity. These changes continuously create the potential for land tenure conflicts in peri-urban areas, which are often complex and lead to violent, insecure, and destabilizing disputes. The objective of this study is to conduct a comprehensive and systematic review of selected sources to explain conflicts related to land tenure in peri-urban areas. In this regard, a meta-synthesis approach was used to review the types of conflicts related to land rights in the study, and 126 sources of land tenure conflicts were identified [24]. In addition, the way in which people use land has changed as a result of their growing need for food, water, and shelter. However, conflicts do not erupt in isolation; they are the result of multiple interacting causes. In the study, the authors systematically coded case studies reporting conflicts associated with land use change, such as deforestation on commodity frontiers, agricultural development on public lands, and urban development. An analysis of 62 cases identified population growth, overlapping land rights, ethnic divisions, and economic inequality as the most frequently reported root causes, while rising land prices were the most frequently reported direct cause [25].
To achieve the goal of sustainable development, it is essential to monitor changes in various socio-ecological indicators over space and time, including the ratio of land consumption rate to population growth rate, which serves as an indicator of land use efficiency. Between 1975 and 2015, it was found that the SDG regions of Europe and North America were the least efficient, while the SDG regions of East and Southeast Asia showed significant progress. Although land consumption rates and population growth rates are positively and significantly correlated at the global level, this is not always the case across regions, suggesting that land consumption is not always proportional to population growth [26].
To further assess the efficiency of land resource use, land use performance in terms of ecosystem service indicators was linked to land use performance based on optimized land use allocation, using Korea as an example. Land use assessment tests demonstrated the effectiveness of spatial planning and policy measures in improving land use in the region [27]. In research on land use efficiency, taking Vietnam as an example, rural-to-urban migration has created significant challenges for sustainable planning and development in many cities. The study developed land use maps and applied support vector machine algorithms to calculate sustainability indicators. The results showed that before 2000, Vietnam’s urban land consumption rate was lower than its population growth rate, indicating higher urban land use density. When the urban land consumption rate exceeded the population growth rate over the past two decades, urban land use density was notably low [27]. In the Ethiopian region, urban land use efficiency was analyzed using remotely sensed data, focusing on spatial and temporal changes in land use since 2004. Satellite imagery analysis was conducted with ArcGIS software, supplemented by quantitative and qualitative data from secondary sources. The results showed that urban land use inefficiency is prevalent in almost all expanding frontier areas, characterized by widespread land hoarding and land use fragmentation. Urban sprawl is rampant, with a large proportion of transferred land remaining vacant or underutilized for many years [28]. Using Laos as an example, Special Economic Zones (SEZs) can attract foreign investment, drive industrialization, and promote economic globalization. This study examines the land use intensity, structural evolution, and land use efficiency of Laos’ SEZs by analyzing their operations using methods such as land use dynamics attitude, information entropy, ultra-efficiency data envelopment scores, and grey relational analysis. The study shows that the total land use area of the Lao SEZ continues to increase from 2014 to 2020. The land use intensity changes in SEZs can be categorized into three types: high intensity, medium intensity, and low intensity, with most of the SEZs belonging to the medium intensity type. The proportion of land used for production systems in Laos’ SEZs increased the most, and the proportion of land used for infrastructure decreased significantly. The overall information entropy of land use structure shows a decreasing and then increasing trend [29].
This study conducted a multidimensional analysis of land use efficiency across 27 European countries over a study period that included two urban phases: economic expansion and crisis. The analysis revealed that the socio-economic variables most strongly associated with high land use efficiency were disposable income per capita and income growth during the period 2000–2007. This suggests that wealthier cities tend to have higher land use efficiency [30]. Identifying synergies between agricultural capacity and ecosystem services in the industrialized areas of the northern Iberian Peninsula could further enhance the efficient use of soils [31]. Using the Brazilian Amazon as an example, the authors examined the relationship between farm size and land use efficiency. The results indicated a significant potential for land use intensification, which could enable agricultural expansion without increasing deforestation pressures. The study also revealed a U-shaped relationship between farm size and land use efficiency, concluding with a negative correlation between farm size and land use efficiency [32].
However, how to objectively evaluate the land green use efficiency of each province and find out the reasons for its difference is still a hot and difficult point of current research. At present, research on green land use mainly focuses on the following aspects: First, the impact of various policies on land use efficiency, including environmental protection policies, land management policies, and economic incentive policies. Secondly, the application of green technology in land use and its effect on improving efficiency. Thirdly, the analysis of differences in land use efficiency among regions, identifying their causes, and exploring ways to optimize land use.
Although many studies have been conducted by domestic and foreign scholars, several problems remain. First, many studies rely solely on the traditional DEA model and fail to fully account for the impact of non-expected outputs on land use efficiency. Second, research on the dynamic changes in land use efficiency is limited, which does not adequately capture long-term trends and regional differences. Third, existing research lacks depth in analyzing the causes of changes in land use efficiency, with insufficient systematization and comprehensiveness. By establishing the SBM model, combined with GML index decomposition analysis and kernel density analysis, this paper aims to further comprehensively evaluate land green use efficiency and consider non-expected output factors, so as to make evaluation results more objective and comprehensive. Through kernel density analysis, the dynamic distribution pattern of land green use efficiency was described and its change trend was revealed. The deep causes of land green use efficiency change in various provinces were systematically analyzed by GML index decomposition, providing the scientific basis for policy formulation. Through these methods, this paper can effectively solve the shortcomings in the current research, provide a more scientific and comprehensive evaluation of land green use efficiency, and then put forward optimization suggestions to promote the sustainable development of land resources in China.
Experimental
Measurement Method
Super-efficient SBM Model Considering Undesired Output
The Data Envelopment Analysis (DEA) method is a technique used to evaluate efficiency. Its principle involves generating an effective production frontier based on input and output index values and determining the efficiency of all Decision-Making Units (DMUs) by measuring the gap between each DMU and the frontier. DEA can assess the input and output of specific decision-making units. The advantages of DEA are as follows: First, there is no limit on the number of input-output indicators, and no parameter estimation is required. Second, index data does not require dimensionless processing. Third, it is unnecessary to assign weights to indicators manually, as weights are determined through specific mathematical programming, making the evaluation results more objective and reliable.
The Super-efficient SBM model considering the undesired output used in this paper is a DEA model. In order to solve the efficiency measurement problem when the input quantity is in excess and the output quantity is in shortage, the SBM model overcomes the shortcomings of the traditional DEA model, and its basic expression is formula (1). ρ represents land green use efficiency, n represents 31 decision-making units in 31 provinces of China, m represents the number of input indicators for each decision-making unit, s represents the number of output indicators, and ri– and rwd represent the relaxation variables of various indicators.
(1)
The Super-efficient SBM model enables DEA methods to compare and sort the efficiency of multiple efficient DMUs. The basic model expression is formula (2), and it can be found that compared with the SBM model, the change in the Super-efficient SBM model is only in the constraint conditions.
(2)
The Super-efficiency SBM model is used to measure production efficiency by accounting for the relationship between different input and output variables. It allows for the assessment of conditions that exceed the optimal output level. This model enables comparisons of efficiency between different production units and provides insights on improving production efficiency based on existing resources.
The Super-efficient SBM model treats the output of each production unit as being generated from its input vector and an error term. This error term represents the effect of all factors other than the input vector on the output, including factors such as technological change, market fluctuations, and mismanagement. In the traditional Super-efficient SBM model, this error term is assumed to have zero expectation, i.e. no contribution to output. The improved model can more accurately reflect the actual efficiency of production units, including the effects of some undesired outputs. This model can be used to evaluate the efficiency of different production units and figure out how to improve efficiency based on existing resources.
In this paper, the Super-efficiency SBM model considering the non-expected output is used to evaluate the land green use efficiency of 31 provinces in China. The specific model expression is as follows: Formula (3), where s1 represents the number of expected output indicators, s2 represents the number of non-expected output indicators, and ri–, rwd and rgu represent the relaxation variables of various indicators.
Global Malmquist-Luenberger Index Model
The Malmquist index method, based on DEA, is a measurement tool that facilitates dynamic analysis of regional land green use efficiency. It decomposes changes in regional land green use efficiency into technical change and technical efficiency change, providing insights into the internal factors driving these changes. The Global Malmquist-Luenberger (GML) index model, an improvement over the traditional Malmquist-Luenberger (ML) index, addresses its shortcomings and enables multiplicative functions, allowing for comparisons of regional land green use efficiency across different periods. Based on this, this paper uses the GML index model to analyze changes in regional land green use efficiency. The basic expression of GML and its decomposition model is as follows:
(4)
GML(t – 1, t) represents the GML index of phase t; Eg(xt, yt) and Et(xt, yt) respectively represent the efficiency value obtained by using the Super-efficiency SBM model considering the non-expected output in phase t when the global frontier and phase t frontier are compared; Eg(xt–1, yt–1) and Et(xt–1, yt–1) respectively represent the efficiency value obtained by using the Super-efficiency SBM model considering the non-expected output in phase t – 1 when the global frontier and phase t frontier are compared. EC(t – 1, t) and TC(t – 1, t) represent the technical efficiency change and technological change in phase t, respectively.
Kernel Density Estimation Methods
Kernel density estimation, proposed by Rosenblatt, is a non-parametric method for analyzing data. It estimates the density of an unknown density function and represents the shape of the research object with a continuous curve. The advantage of this estimation method is that it will not cause statistical errors due to improper setting of the overall distribution. It is often used to study spatial disequilibrium analysis. To further investigate the dynamic information on the absolute differences in land green use efficiency across China’s provinces and to delineate its overall dynamic distribution pattern, this paper applies the kernel density estimation method to analyze land green use efficiency in China’s provinces and regions during 2010-2022. The analysis method satisfies formula (5), where f(x) is the density function obtained according to the land green use efficiency value X1, X2, ..., XN of N provinces in China, h represents bandwidth, and K(x) represents the kernel function satisfying formula (6). In this paper, the Gaussian function is used as the kernel function to estimate the kernel density of land green use efficiency in China, as shown in the formula below:
Construction of an Efficiency Evaluation System
Index Selection Principle
(1) In order to make the actual effect exact, the adoption standard should have a relatively comprehensive feature and must have a clear level and weak correlation.
(2) Key principles. There are many indexes that can be selected in the actual factor screening. After relatively comprehensive and extensive selection, core indexes are selected and irrelevant indexes are eliminated according to the actual application.
(3) The principle of appropriateness. There is no obvious correlation and inevitability between input and output, otherwise, the evaluation results may be inaccurate or invalid, which will greatly reduce the credibility and reliability of the evaluation results of research efficiency.
(4) The principle of consistency. In view of the diversity of research objects, it is necessary to select mutually comparable indicators to ensure the accuracy and credibility of research results.
(5) Scientific principles. Evaluation results should be based solely on objective criteria and facts, not on the author’s subjective judgment or bias, and evaluation results must be accurate, truthful, and unambiguous.
(6) The principle of feasibility. When selecting evaluation indicators, the feasibility and accuracy of data acquisition should be considered. If data for some indicators are difficult to obtain, we can consider using similar or related indicators instead.
Select Evaluation Index
In order to evaluate the green land use efficiency of China’s provinces from 2010 to 2022 in a scientific and reasonable way, this paper summarizes the literature, and the specific evaluation indicators are shown in the Table 1.
Input and Output Index Selection
This paper is based on the status of green land utilization in China’s provinces and regions, and according to the existing literature research and index construction principles. Input indexes are selected from three aspects: land input, capital input, and labor input. Expected output and non-expected output are considered in terms of economic growth and ecological environment impact, based on the characteristics of land green use. The details are as follows:
Input index. This paper constructs input indicators from three perspectives: land input, capital input, and labor input:
(1) Land input. The measurement of land input and construction land area is not only easy to obtain and measure but also reflects the utilization efficiency of land resources by urban construction and economic activities. Additionally, it provides a unified measurement standard to facilitate the comparison and analysis of land input across different regions or periods.
(2) Capital investment. It reflects the quantity and quality of physical capital currently available in the economy, including plants, machinery, equipment, buildings, land, and other fixed assets. Capital input is a key economic indicator, which plays an important role in promoting economic growth and development and is also an important indicator to evaluate the productive capacity and competitiveness of an economic system. Therefore, it is feasible and reliable to use the capital input index to measure land green utilization.
(3) Labor input. Data on the employment of non-private units are usually released regularly by government statistical departments, and the data are relatively complete and reliable. Non-private units (such as state-owned enterprises and public institutions) usually occupy an important position in the economy, and their employment numbers can better reflect the overall situation of labor input. Using the number of employed persons in urban non-private units to measure labor input can provide a consistent measure and facilitate comparison and analysis across different regions or periods.
Table 1.
Evaluation index system of urban land green use efficiency in China.
Output indicator: (1) Expected output is the expected benefit output in the process of land use, which mainly includes economic, social, and ecological indicators. The added value of the secondary and tertiary industries can effectively reflect the economic benefits of land use. The ultimate goal of social benefit is to improve people’s well-being, so it is represented by the per capita disposable income of urban residents. Greening in built-up areas can roughly reflect the ecological environment status of the city and the environmental output of the green utilization degree of land, and the greening level of the city is represented by the green coverage rate of the built-up areas.
(2) Undesirable output. The pollution of green land use is mainly caused by industrial pollution. Therefore, on the basis of considering the availability of data, this paper selects industrial pollution-related emissions as the index reference of undesirable output.
Data Source and Geographical Division
Data source. At present, China has not specifically summarized and sorted out data on the green land use industry, which makes it cumbersome and difficult to collect data on China’s green land use industry. This paper draws on previous studies to evaluate the development of green land use based on the data of these industries. The basic data mainly come from the China Urban Statistical Yearbook, China Urban Construction Statistical Yearbook, and China Economic Information Network.
Regional division. In order to objectively evaluate the development status of green land use in different regions and compare the efficiency differences between them, so as to formulate corresponding regional policies, this paper divides the 31 selected provinces into six regions according to the national administrative division method (since relevant data for Hong Kong, Macao, Taiwan, and Tibet have not been collected, they are not included in this study). The provincial areas covered by the regions are shown in Table 2.
Results
Temporal Evolution Analysis of Land Green Use Efficiency in China
This part will analyze the temporal evolution of China’s land green use efficiency from three perspectives: national, regional, and provincial.
Evolution of Land Green Use Efficiency from a National Perspective
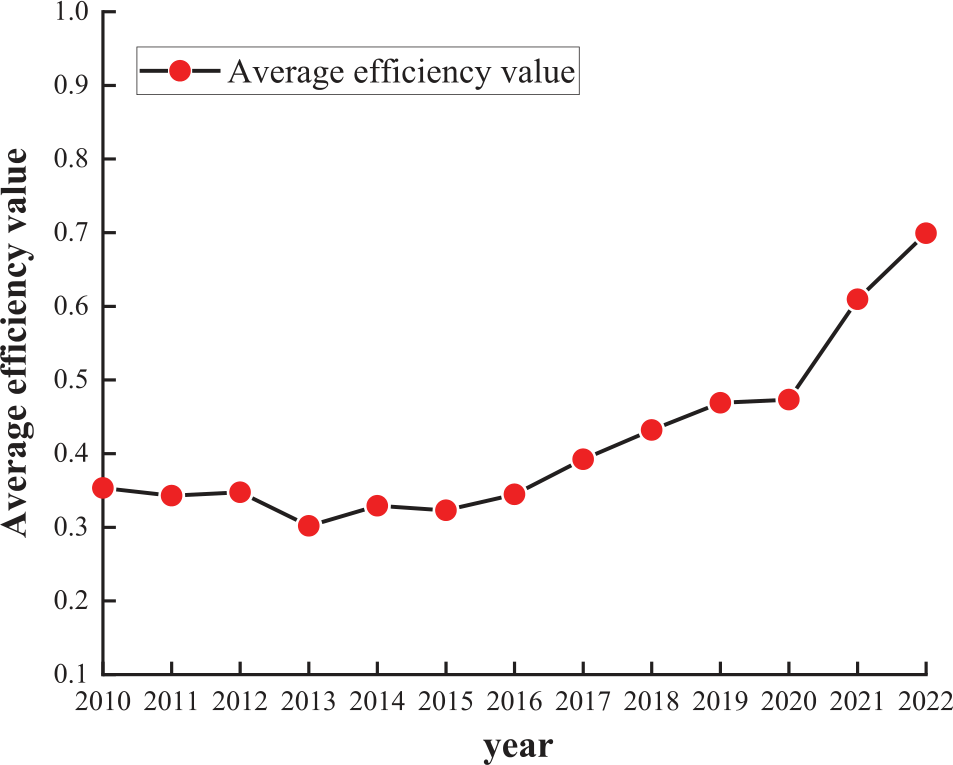
The following figure shows the change in average land green use efficiency from 2010 to 2022 from a national perspective.
As can be seen from Fig. 1, the overall level of China’s land green use efficiency is on the rise, and the highest land green use efficiency is 0.70 in 2022, showing an overall trend of fluctuation and rise, which is closely related to China’s vigorous development of land green use in recent years. The following paper will analyze the fluctuation and change in land green use efficiency accordingly.
(1) From 2010 to 2016, the land green use efficiency developed steadily, and the average efficiency was between 0.3 and 0.4. In 2010, China still had more arable land than in the 1980s, but the area of high-quality farmland was significantly reduced. In 2010, China’s land use area, ranked from largest to smallest, consisted of grassland, forest land, unused land, cultivated land, water bodies, and urban and rural industrial and mining land. Over the past 20 years of remote sensing monitoring, more than 260,000 km2 of land in China have changed their original utilization properties, accounting for 2.80% of the total land area monitored through remote sensing. Among these land types, cultivated land has experienced the most significant changes, with its dynamic change area exceeding that of all other land categories. This change has followed a phased trend, initially increasing and then decreasing. Subsequently, the state issued a series of policy documents, leading to substantial changes in China’s land use situation.
Table 2.
Division of provincial administrative regions in China.
(2) In 2017, land green use efficiency began to rise, with the average efficiency value recorded at 0.39. This increased to 0.43 in 2018 and 0.47 in 2019, far surpassing the initial average efficiency value. These improvements are closely related to land policy initiatives. The 2016 “Measures for the Management of the Annual Plan for Land Use” emphasized the importance of adhering to green development. It highlighted the need for equal focus on the quantity, quality, and ecology of cultivated land protection. The document also stressed maintaining a balance between the construction of occupied cultivated land and supplementary cultivated land, while improving the quality of supplementary cultivated land. We will adhere to coordinated development, coordinate regional, urban, and rural development land, and improve the pattern of territorial space development. The “2017 National Land Use Plan” pointed out that to improve the efficiency of land use plans, first, to scientifically decompose the implementation of the annual land use plan, second, to increase the overall arrangement of land use plans, and third, to strictly supervise the implementation of land use plans. According to the “Circular on the Evaluation of Land Intensive Use in National Development Zones in 2018”, the intensity of land use and the input-output benefit of industrial land have steadily improved, and the performance of land management remains relatively stable.
(3) The decline in the efficiency value of green land use in 2020 may have been affected by the novel coronavirus (COVID-19) epidemic that began in late 2019, which led to lockdowns and restrictions in some areas and forced the suspension or delay of many construction projects, reducing the use of construction land. Due to increased economic uncertainty, many businesses and governments have postponed or reduced investments in infrastructure and real estate, leading to a decline in demand for construction land. Movement restrictions and quarantine measures during the pandemic led to labor shortages, further affecting the progress of construction projects and land use efficiency. In addition, in response to the pandemic, the government may devote more resources to health care and social security and less to urban construction and land development.
(4) However, it began to increase again after 2021, with the value of land green use efficiency rising from 0.61 in 2021 to 0.7 in 2022, reflecting a growth rate of about 14.75%. The “Regulations for the Implementation of the Land Administration Law of the People’s Republic of China” were revised in April 2021 and emphasized that territorial spatial planning should include the pattern of territorial space development and protection, the layout, structure, and use control requirements of planned land use, the requirements for the amount of cultivated land, the scale of construction land, and the scope of prohibited reclamation. It also stressed the need to coordinate the layout of land for infrastructure and public facilities. We will comprehensively utilize both aboveground and underground space, rationally determine and strictly control the scale of new construction land, raise the level of land conservation and intensive use, and ensure sustainable land use.
Evolution of Land Green Use Efficiency from a Regional Perspective
In the actual development process, the overall level of land-intensive use in the development zones in the eastern region is relatively high, with land efficiency and industrial land use intensity being the highest in the country. The investment intensity of industrial land fixed assets, average tax revenue of industrial land, average tax revenue of comprehensive land, comprehensive plot ratio of industrial land, and building coefficient of industrial land in the development zones in the eastern region are the highest in China. Among these, the investment intensity of industrial land fixed assets reaches 967.75 million yuan/ha. They are 1.45 times, 1.39 times, and 1.94 times those of the central, western, and northeast regions, respectively. The average tax revenue of industrial land reached 8.3343 million yuan/ha, which is 1.79 times, 1.64 times, and 1.72 times that of the central, western, and northeast regions, respectively. The comprehensive average tax revenue reached 7.3458 million yuan/ha, 1.67 times, 2.18 times, and 2.26 times those of the central, western, and northeast regions, respectively. The comprehensive plot ratio of industrial land and the building coefficient of industrial land reached 0.96 and 51.97%, respectively.
The comprehensive land use intensity of the development zones in the central region is the highest, but the input-output benefit of industrial land is low. The comprehensive plot ratio and building density of the development zones in the central region reached 1.00 and 34.34%, the highest in the country. However, the investment intensity of fixed assets in industrial land and the average tax of industrial land are relatively low, respectively, 66,818,400 yuan/hectare and 4,656,800 yuan/hectare, about 90% and 80% of the national average level.
The land use degree, land use structure, and land use intensity of the development zones in Western China are at a relatively low level. The land supply rate, industrial land rate, building density, and comprehensive plot ratio of industrial land in the development zones in the western region are the lowest in the country, which are 86.87%, 36.83%, 27.57%, and 0.71, respectively. In addition to the land construction rate close to the national average level, the rest are 80%~90% of the national average level.
The land use degree of the development zones in Northeast China is relatively high, but the land use intensity and land use efficiency are at a low level in the country. The comprehensive plot ratio of land in Northeast China is only 0.80, the lowest in the country. The investment intensity of fixed assets in industrial land and the average tax revenue of comprehensive land are the lowest in China, respectively 49.813 million yuan/ha and 3.2573 million yuan/ha (data source: Central People’s Government of the People’s Republic of China in 2019).
Fig. 2 shows the change in land green use efficiency in each administrative region of China from 2010 to 2022. As can be seen from the figure, the overall land green use efficiency of all regions showed a trend of fluctuation and rise, but there were certain differences in the efficiency value among all regions. Among them, the overall level of land green use efficiency in North China and East China is relatively high, which is always higher than the overall level of the country, and is in an absolute leading position. The efficiency value in North China increased from 0.17 in 2010 to 0.56 in 2022, with a growth rate of 69.64%. The change in land green use efficiency in East China is almost consistent with the change trend in the whole country, and its efficiency value increases from 0.42 in 2010 to 0.85 in 2022, which is close to the effective value.
The land green use efficiency in Central and Southern China peaked at 0.63 in 2022, and the overall efficiency value was lower than the national average, and there was still a certain gap with North China and East China. However, the land green use efficiency value in Central and Southern China increased significantly from 2010 to 2022, with a growth rate of 65.79%.
The green land use efficiency in Northeast China, Southwest China, and Northwest China is always lower than the national average level, and there is a big gap with other regions. It can be seen that the green land use development in these three regions is relatively backward. However, the land use efficiency in Northwest China has increased rapidly in recent years, thanks to China’s national policies, especially the implementation of some ecological projects such as returning farmland to forest and grassland, and desertification prevention and control, which have improved the ecological environment and promoted the sustainable use of land.
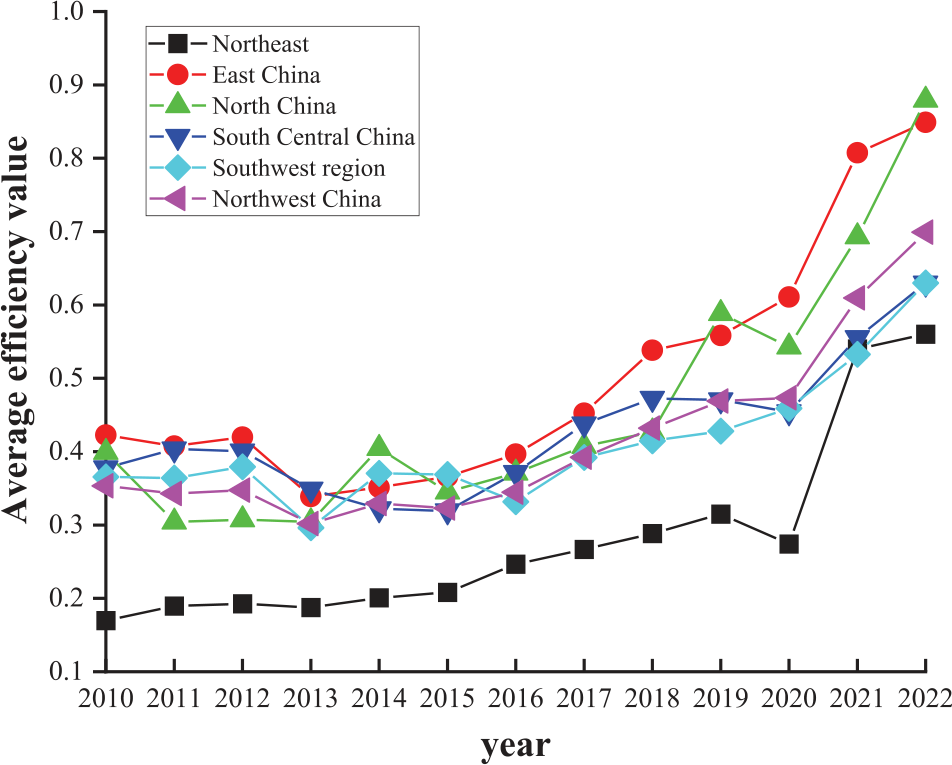
To sum up, the land green use efficiency in all regions showed a trend of fluctuation and rise on the whole, but there was a certain gap in the development of land green use between regions. The high level of green land use in East China and North China cannot be separated from the following factors: First, strict environmental protection policies and regulations promote green development through scientific and reasonable urban and regional planning, which emphasize intensive land use and ecological protection. The economic foundation is good, which provides sufficient financial support for green land use. Secondly, the government and enterprises invest heavily in environmental protection, green technology, and infrastructure. The promotion and application of energy-saving and environmental protection technologies, such as solar energy, wind energy, and other renewable energy sources, reduce the pressure on land resources. The use of advanced agricultural technologies, such as precision agriculture and organic agriculture, improves the green level of land use. Finally, improved transportation and water infrastructure has enhanced land use efficiency and reduced resource waste, while modern land management systems and information technology applications have improved the efficiency and sustainability of land resource use.
Evolution of Land Green Use Efficiency from the Provincial Perspective
Table 3 specifically reports the land green use efficiency values of 31 provinces and cities in China during 2010-2022, which are evaluated in terms of global and local changes in the following two aspects:
(1) According to the average land green use efficiency of various provinces and cities from 2010 to 2022, the average land green use efficiency of most provinces and cities is at a low level, and the average level of land green use efficiency of different provinces and cities is significantly different. The average land green use efficiency of Guangdong, which ranks first, is 0.83; the average land green use efficiency of Beijing and Shanghai, which ranks second, is 0.77; while the average efficiency of Guizhou, which ranks last, is only 0.09, with a wide gap. This further shows that China’s land green use development efficiency and development level are quite different. Specifically, 8 provinces and cities, including Guangdong, Beijing, and Shanghai, have land green use efficiency values above 0.50, while the remaining 23 provinces and cities, including Tianjin, Hebei, and Shanxi, have land green use efficiency values below 0.50. From the trend of change, the land green use efficiency of most provinces and cities is fluctuating and rising.
(2) From the main time node, the change in land green use efficiency in each province and city is closely related to the policy and market environment. Various factors interact and jointly affect land use and its changes. The research and management of land change need to consider natural, economic, social, and other factors in order to achieve sustainable land use and protection. Affected by the novel coronavirus pneumonia in 2019, in order to cope with the impact of the epidemic, the government may temporarily adjust some environmental protection policies and land use planning, affecting the improvement of green use efficiency. After 2019, the provinces with decreased land green use efficiency were Hebei, Liaoning, Hubei, and Guangdong, etc. Due to changes in the domestic policy environment, the efficiency values of six provinces and cities showed varying degrees of fluctuation. However, the impact of the epidemic on land was not significant, so the basic use and mode of land did not change substantially, and not many provinces were affected. From 2021 onward, the green land use efficiency of all provinces in the country has shown a significant upward trend.
Table 3.
Measurement results of China’s provincial land green use efficiency.
Spatial Distribution and Change Characteristics of Land Green use Efficiency in China
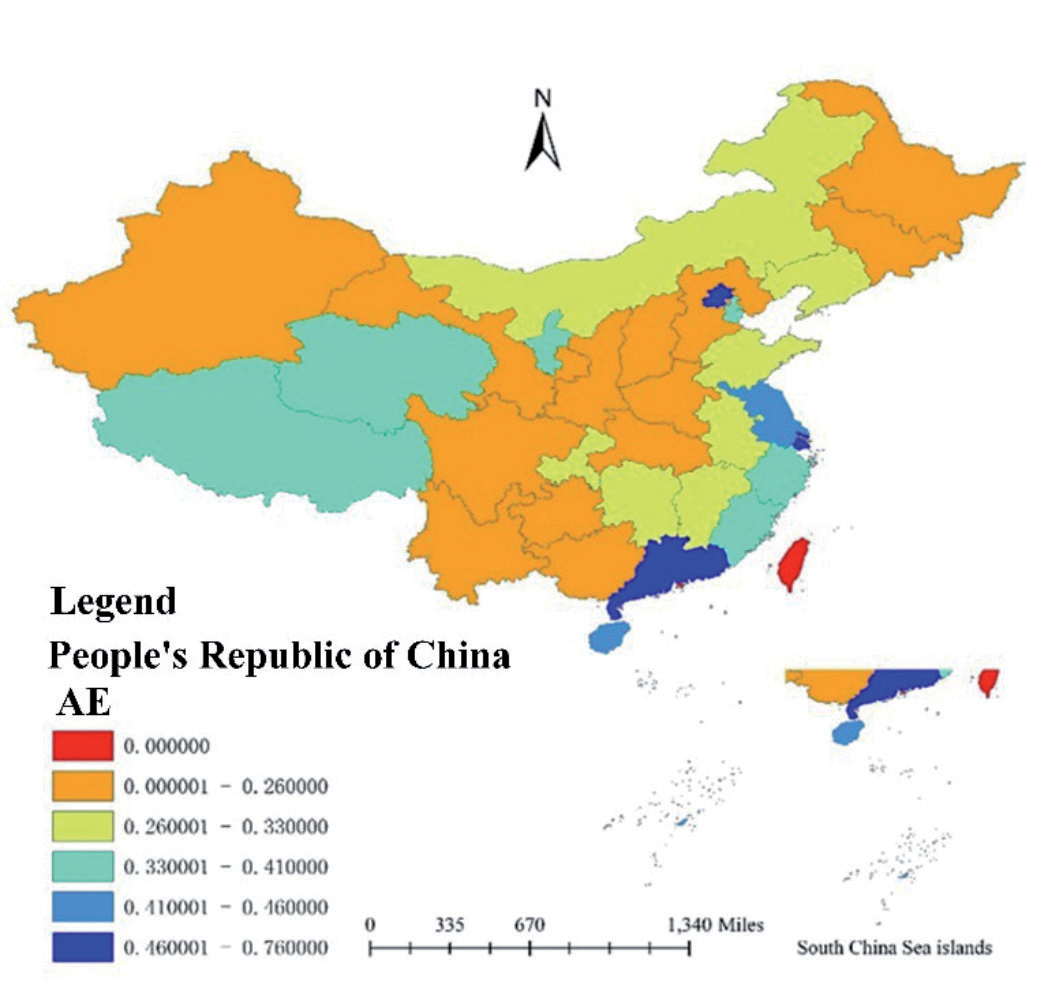
In order to better analyze the spatial distribution characteristics of land green use efficiency in China’s provinces and regions, this paper divides the efficiency value into five levels, and uses ArcGIS software to draw the spatial distribution map of land green use efficiency in China’s provinces and cities. As shown in Fig. 3, it is the average distribution map of land green use efficiency in China, and the spatial distribution can be seen more intuitively. China’s land green use efficiency shows a zonal pattern of high in the east and low in the west, which has been confirmed by a number of studies.
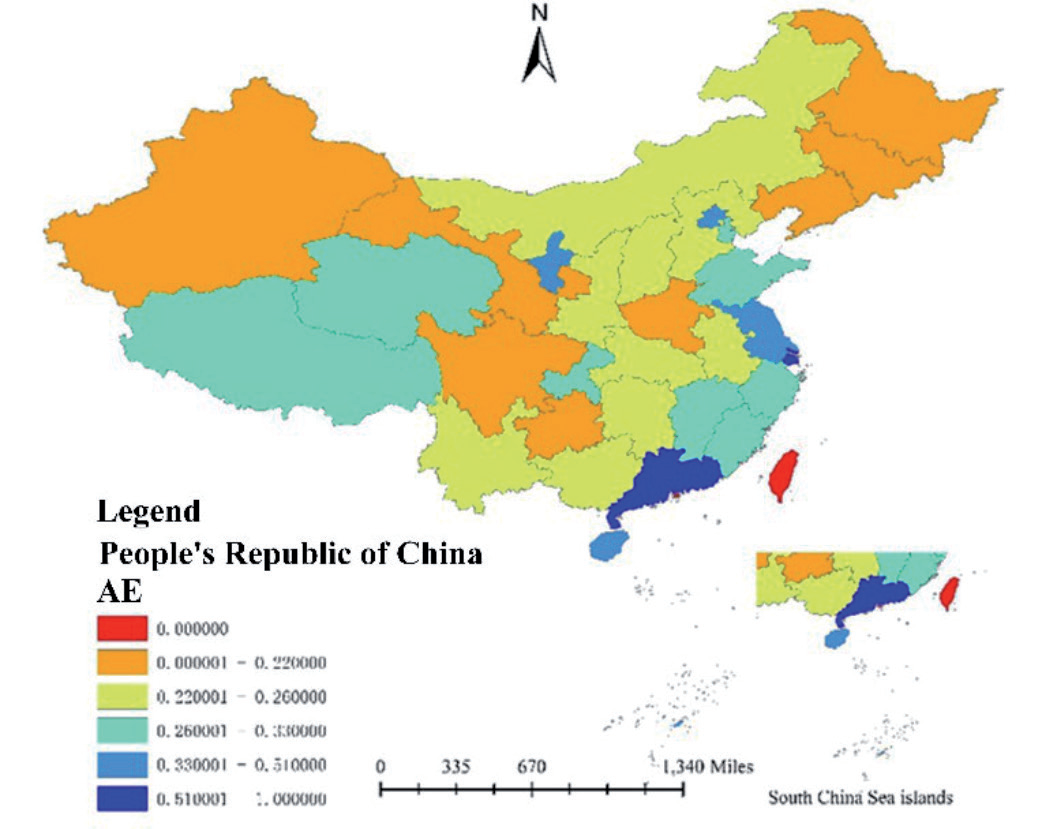
Furthermore, ArcGIS software was used to draw the spatial distribution map of land green use efficiency of Chinese provinces and cities in 2012, 2016, 2018 and 2022, as shown in Fig. 4, Fig. 5, Fig. 6 and Fig. 7.
As can be seen from the figure, most provinces in the eastern region of China are always at a high or above efficiency level, while most provinces in the western region are always at a low or below level. The reasons can be analyzed from many angles.
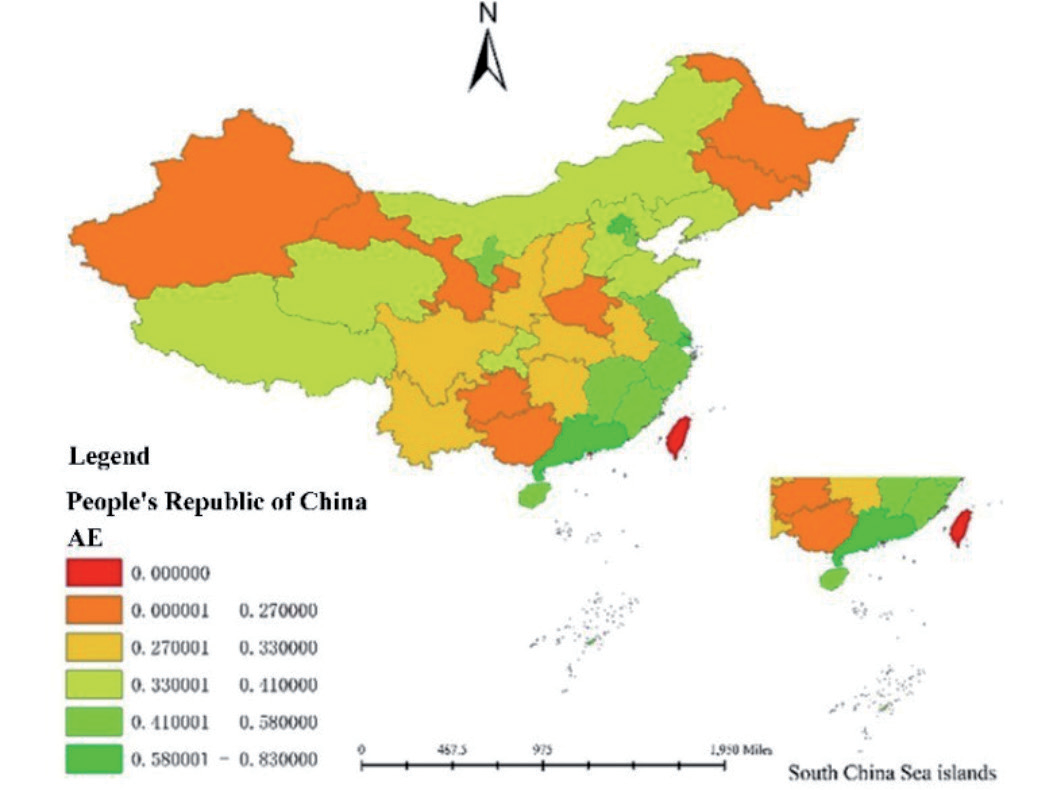
First of all, the level of economic development: the eastern region has a relatively developed economy, a rapid urbanization process, and a high level of industrialization. These regions have attracted significant investment and technology, promoted the efficient use of land, and developed transport, logistics, and information infrastructure. This has improved the efficiency of land use, enhanced inter-regional linkages, and facilitated resource flows. The diversification of the industrial structure in the eastern region, including high-tech industries, service industries, and manufacturing industries, has improved the overall efficiency of land use. The western region, on the other hand, has relatively backward economic development and a low level of industrialization and urbanization, resulting in low land use efficiency. Relatively underdeveloped transportation, logistics, and information infrastructure further limit the effective use of land resources and economic interaction between regions. The economy of the western region relies heavily on agriculture and resource-based industries and has a single industrial structure, leading to extensive land use and low efficiency.
Secondly, policy and institutional factors: the eastern region receives more policy preferences and support, including reform and opening-up policies and coastal special economic zone policies, which are conducive to attracting investment and promoting efficient land use. Relatively well-developed land management and planning systems promote the intensive use and optimal allocation of land resources, while strict environmental protection policies and regulations encourage green land use and improved land use efficiency. In the western region, although the state has implemented the strategy of developing the western region in recent years, the implementation of policies and support remains insufficient, making it difficult to quickly change the situation of low land use efficiency. The land management and planning system is relatively weak, the land use mode remains extensive, and resource waste is more prevalent. The relatively low population density and economic activities reduce environmental protection pressure in the western region, and the awareness of green land use is not strong.
Finally, from the perspective of natural geographical conditions, the eastern region has a warm and humid climate and fertile land, making it suitable for agriculture and a variety of economic activities, which promotes the efficient use of land. The eastern region’s proximity to the sea and superior geographical location facilitate opening up and trade, promoting the efficient allocation of land resources. In contrast, the natural conditions in the western region are relatively harsh, with drought, deserts, mountains, and other challenging terrains limiting land use efficiency and agricultural productivity. Its remote geographical location and inconvenient transportation further restrict resource flow and economic development, negatively affecting land use efficiency.
In conclusion, the level of economic development, policy, and institutional factors, as well as natural geographical conditions jointly affect the difference in land use efficiency between the eastern and western regions of China. These factors interact with each other, resulting in higher land use efficiency in the eastern region and relatively lower land use efficiency in the western region.
From the perspective of evolution characteristics, the level of green land use efficiency in China improved to some extent between 2010 and 2022, but the change trend varied among provinces. This is shown in Fig. 6 and Fig. 7.
Among them, the land green use efficiency in the eastern region has changed significantly. In 2018, only a few provinces with a high level of green land use efficiency, such as Guangdong and Shanghai, demonstrated a high level of overall efficiency. By 2022, the overall level of green land use efficiency in provinces such as Hebei, Jiangxi, Zhejiang, Jiangsu, and Liaoning had significantly improved. Notably, in 2022, the efficiency levels of Inner Mongolia and Liaoning improved significantly, raising both provinces from a low level to a high efficiency level.
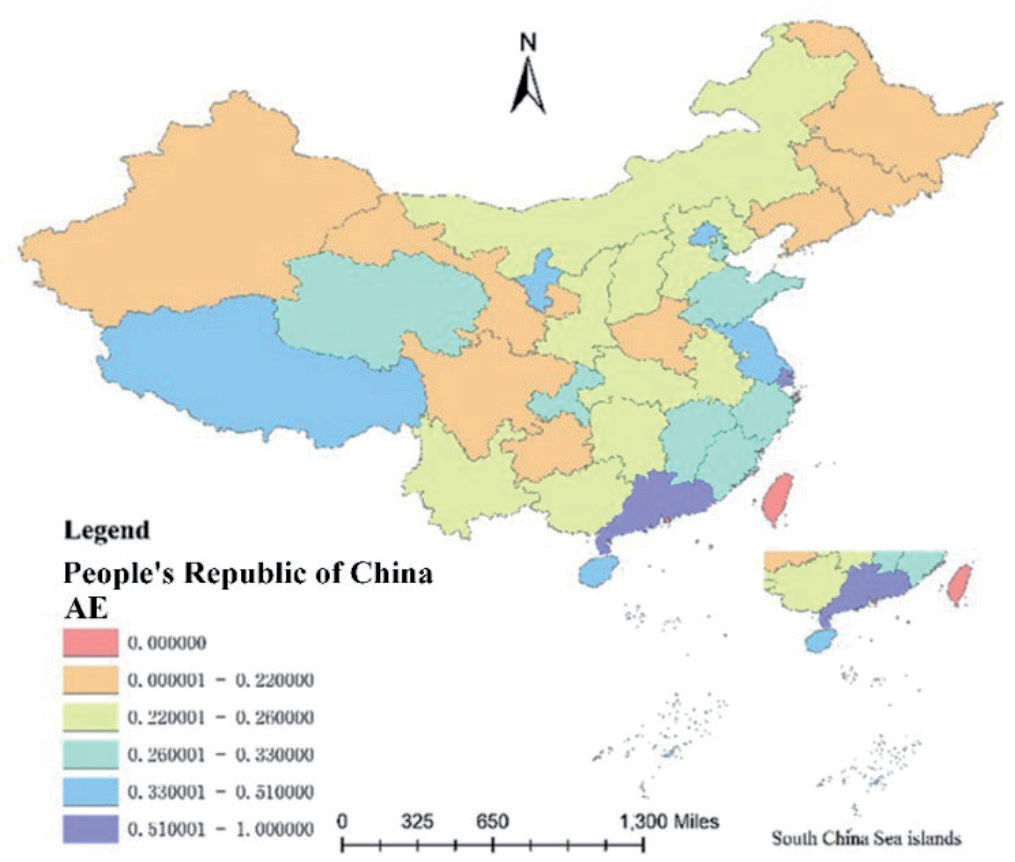
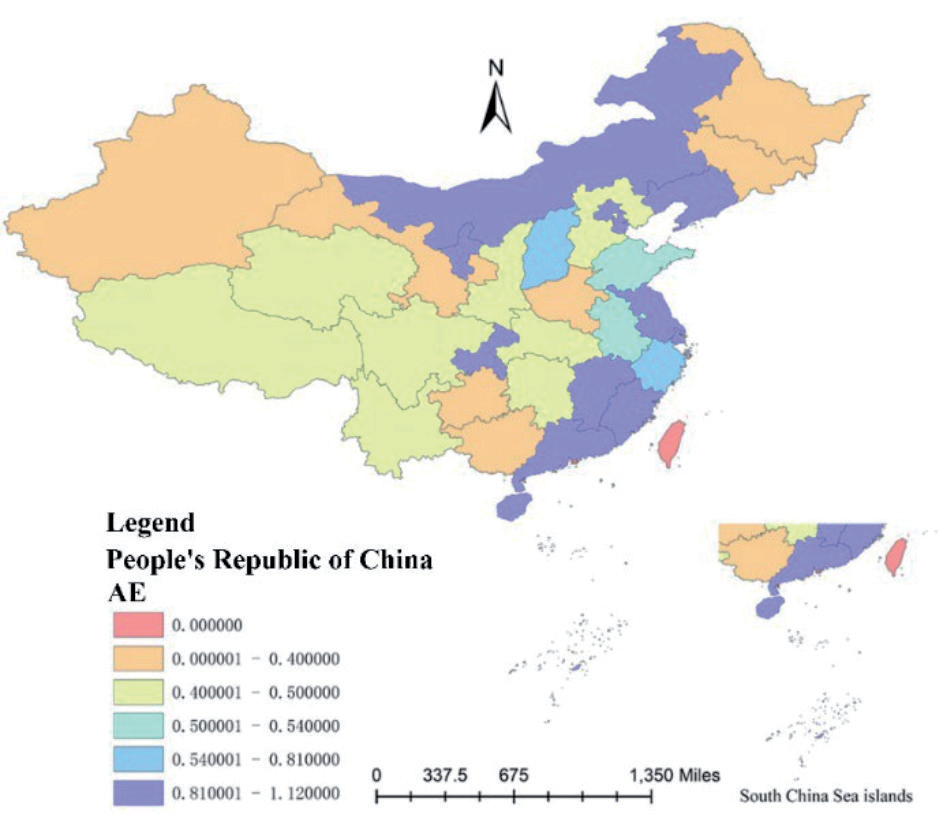
After entering 2012, the land green use efficiency of all provinces has generally improved, and it can be seen from the comparison of distribution maps that the increase is relatively large. In Inner Mongolia, Liaoning, Shanxi, Shaanxi, and other regions, the level of land green use efficiency has improved significantly. This is closely related to a series of land use policies introduced in China in recent years. These policies have pointed out the direction and provided impetus for the development of green land use in China.
In 2012, in terms of strict protection of cultivated land, the Ministry of Land and Resources issued several important documents, including the National Land Renovation Plan (2011-2015), the Notice on Accelerating the Preparation and Implementation of the Land Renovation Plan and Vigorously Promoting the Construction of High-Standard Basic Farmland, the Notice on Improving the Protection Level of Cultivated Land and Comprehensively Strengthening the Quality Construction and Management of Cultivated Land, the Standard for the Construction of High-Standard Basic Farmland, and new policy documents such as the Measures for the Administration of the Use of Funds for Compensated Use of Construction Land. These policies made further strict and specific provisions on strengthening the protection of cultivated land and strictly protecting basic farmland and have played a significant role in practice. The implementation of these policies provides a solid guarantee for the improvement of China’s land green use efficiency.
Kernel Density Analysis of Green Land Use Efficiency in Chinese Provinces and Regions
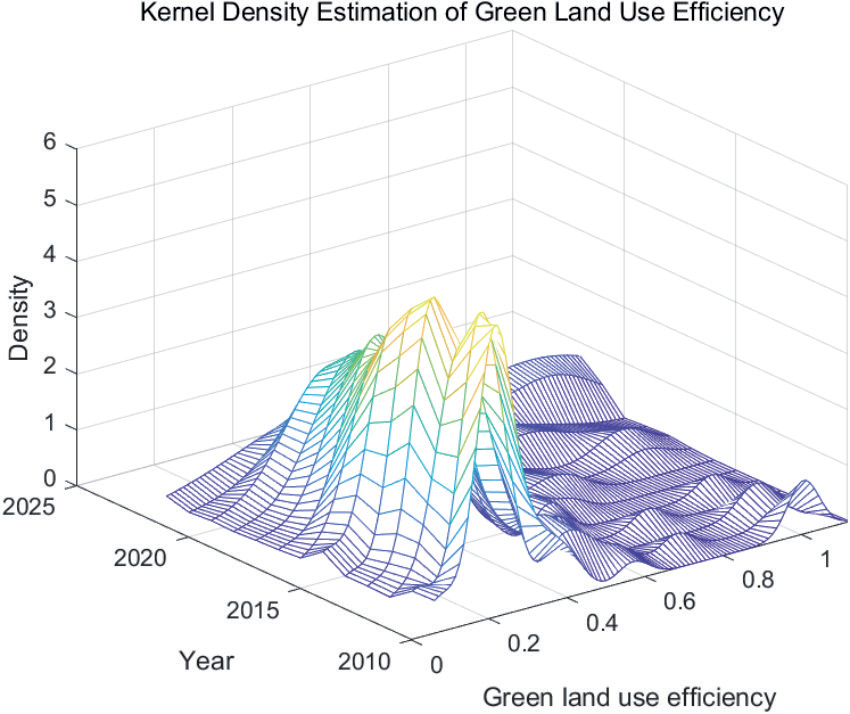
This paper uses Matlab software to estimate the kernel density of land green use efficiency in China’s provinces and regions and draws the overall kernel density level. At last, it expounds the movement trend, polarization trend, distribution form and position, and ductility of the research object, as shown in Fig. 8.
According to the data in the chart, we can draw the following conclusions: First, the center point of the kernel density function of land green use efficiency generally moves to the right from 2010 to 2022, indicating that the overall level of land green use efficiency in China has gradually increased, which is consistent with the previous analysis results.
Second, the height distribution of the main peak first increased and then decreased, indicating that the land green use efficiency value of China’s provinces gradually concentrated to a stable point in the early stage, and gradually dispersed in the later stage.
Third, the width distribution of the main peak showed a trend of first increasing and then decreasing, indicating that the absolute difference in land green use efficiency in various provinces was gradually narrowing.
Fourth, bimodal distribution appeared in most years, indicating that although the absolute difference in land green use efficiency among provinces is decreasing, the polarization of land green use efficiency still exists. Finally, from the perspective of the ductility of the distribution of land green use efficiency, the overall distribution is trailing to the right, and the overall trend is widening, indicating that the land green use efficiency of some provinces in China is relatively high, but the gap is widening. These conclusions help us to better understand the overall level of China’s land green use efficiency and the differences between provinces and regions and provide references for formulating corresponding policies and measures. In general, China’s land green utilization efficiency is gradually improving, but the phenomenon of uneven development of green logistics is becoming more and more obvious, and this phenomenon needs to be paid attention to and solved.
GML Index and its Decomposition of Land Green Use Efficiency in China
The GML index reflects the change rule of efficiency from t stage to t+1 stage. This part also uses MAXDEA software to measure the GML index of green efficiency of 31 provinces in China from 2010 to 2022, and breaks it down into TC and EC, so as to compare and analyze the causes of change in land green use efficiency in different regions more objectively.
GML Index and its Decomposition from a National Perspective
As shown in Table 4, the average values of GML index, technical progress index (TC) and technical efficiency change index (EC) of China’s land green use efficiency during 2010-2022 are 1.09, 1.08 and 1.05 respectively, which means that the overall development of China’s land green use efficiency is relatively good.
From the perspective of the GML index, only the value of 2012-2013 is less than 1, which indicates that the overall land green use efficiency of China has declined during 2012-2013, while the GML index of land green use efficiency of other time periods is greater than 1, that is, the level of land green use efficiency of China is on the rise during this period. This is consistent with the previous analysis of land green use efficiency.
From the decomposition of the GML index, it can be divided into the following five cases:
(1) The technology progress index (TC) was less than 1 in 2012–2013 and 2015–2016, while the technology efficiency change index (EC) was greater than 1 during these two periods. This indicates that the efficiency of green technologies, such as land use, improved during this period, but the green technology progress index (TC) showed an increasing trend. As the increase in green technology progress outweighed the decrease in green technology efficiency change, the overall level of land green use efficiency increased during these two periods.
(2) The three time periods of 2013-2014, 2014-2015, and 2019–2020 all exhibited the characteristic that the technical progress index (TC) was greater than 1, while the technical efficiency change index (EC) was less than 1. Thanks to the significant increase in land green technology progress, the overall land green use efficiency during these periods increased.
(3) In 2010-2011 and 2011-2012, although there was some improvement in the efficiency of green technology, the overall land green use efficiency decreased due to limited progress in green technology. In 2013-2014, 2014–2015, 2015–2016, and 2016-2017, despite certain progress in green technology, the overall land green use efficiency also decreased due to the limitations of green technology efficiency.
(4) In 2017-2018 and 2020-2021, under the joint promotion of green technology progress and technical efficiency, the growth rate of land green use efficiency accelerated. The growth rate of green technology efficiency was faster, and its promotion effect was greater, indicating that the catch-up effect during these two periods was obvious, and green technology efficiency was continuously approaching the production frontier.
(5) In 2021-2022, the green technology progress index decreased, and its technical efficiency also showed a downward trend, resulting in an overall decline in green land use efficiency.
Table 4.
National Green Land Use Efficiency GML Index, 2010-2022.
In general, the bottleneck of the development of China’s land green use efficiency lies in green technology efficiency, the lag of which limits the sustainable development of China’s land green use efficiency. Meanwhile, green technology progress is the internal key factor for the growth of land green use efficiency, and green technology progress supports the progress of China’s land green use efficiency.
GML Index and its Decomposition from a Regional Perspective
As shown in Table 5, the average values of the land green use efficiency GML index, technical progress index (TC), and technical efficiency change index (EC) for each region are all greater than 1, indicating that the land green use efficiency in each region has achieved growth under the joint promotion of green technology progress and technical efficiency. Among them, the average GML index in Northeast China is the highest, reaching 1.14, indicating that the average annual increase in land green use efficiency in this region is 14%, while the average GML index in Northwest China is only 1.04, with an average annual increase of just 4%. The average GML index of East China, South Central China, Southwest China, and North China is between 1.06 and 1.09, indicating that the average annual growth rate of land green use efficiency in these four regions is between 6% and 9%. From the decomposition of the GML index, there is an obvious catch-up effect in East China and Northeast China; that is, the green technology efficiency in these regions is constantly approaching the production frontier, and the average annual technical efficiency change index (EC) exceeds the technical progress index (TC).
From the perspective of the technical efficiency change index (EC), the highest value is in Northeast China, while the lowest is in East China. Generally, this is because the efficiency of land use in Northeast China has improved faster than in East China in recent years. In East China, due to its economic development, the intensity of land use has been increasing, resulting in land green utilization efficiency remaining at a low level.
From the perspective of the technology progress index (TC), the highest regions are East China and North China, while the lowest is Northeast China. This indicates that the green land utilization technology level in East China and North China has been rapidly improved, which is related to the Beijing-Tianjin-Hebei integration and other policies. The overall improvement speed of land green utilization technology in Northeast China is relatively slow, primarily because the development of existing logistics technology in Northeast China lags behind that in East China and North China. Currently, the development of logistics technology in Northeast China is in a challenging period of technological breakthroughs. The government should continue to introduce more relevant talents to help overcome this bottleneck and advance technological improvement.
To sum up, the land green use efficiency in all regions increased under the combined promotion of green technology progress and technical efficiency. However, the technical efficiency change index (EC) in Northeast China consistently exceeded the technical progress index (TC), indicating that the improvement of land green use efficiency in Northeast China was remarkable. In other regions, the improvement of land green use efficiency depended more on advancements in land green use technology. This highlights that local governments should place greater emphasis on formulating relevant policies to better promote the development of green land use.
GML Index and its Decomposition from a Provincial Perspective
From the perspective of provinces, only the average GML index of Henan Province is less than 1, and the other 30 provinces are all greater than 1, which indicates that the land green use efficiency of most provinces has been improved to varying degrees (see Table 6).
Among them, Inner Mongolia, Yunnan, Ningxia, Xinjiang, Hainan, Hebei, Tianjin, Heilongjiang, Shaanxi, Guangdong, Jiangxi, Anhui, Jiangsu, Shandong, Shanghai, Henan, Fujian, and Tibet all resulted in the overall decrease of land green use efficiency due to the constraint of land green use technical efficiency. These regions should pay attention to the innovative development of land green use technical efficiency. The improvement of land green use efficiency in Chongqing, Shanxi, Liaoning, Sichuan, Jilin, Qinghai, and Gansu is restricted by the progress of land green use technology. The government should introduce advanced land green use technology to continuously achieve intelligent and efficient land green use. The increase in land green use efficiency in Hunan, Guangxi, Beijing, and Hubei was primarily due to the promotion effects of both the technical efficiency of land green use and the technological progress of land green use. Additionally, there was a catch-up effect in Chongqing, Shanxi, Liaoning, Sichuan, Jilin, Qinghai, and Gansu. In other words, the technical efficiency of land green use in these provinces is continuously approaching the production frontier, with the average annual technical efficiency change index (EC) exceeding the technical progress index (TC).
Table 5.
Average GML index of green land use efficiency in China, 2010-2022.
To sum up, the land green use efficiency has changed to different degrees in each province, but the actual endogenous driving force that causes the change is different. For most provinces, the technical progress of land green use efficiency has become the bottleneck restricting the growth of land green use efficiency in each province. This still needs in-depth analysis from the perspective of technology development and infrastructure.
Discussion
In this study, the Super-SBM model was used to measure the green land use efficiency in each province and combined with the GML index and its decomposition index to analyze the intrinsic causes of changes in the green land use efficiency and improvement measures. Based on this analysis, the main conclusions are as follows: First, regarding land green utilization efficiency in the time dimension. In the time dimension, the overall level of green land-use efficiency in China is not high, but the overall development direction from 2010 to 2022 is positive and upward. This trend suggests that policies and technological advances may be playing a positive role, although the current level of efficiency is still low. However, sustained improvement in efficiency requires long-term stable support and effective implementation strategies. The green land use efficiency in administrative regions generally shows a fluctuating upward trend, but there are obvious differences in efficiency values between some regions. Such differences may be closely related to factors such as the level of economic development, policy support, and technology application in each region. Second, the characteristics of spatial distribution and its impact. In terms of spatial distribution, China’s regional land green utilization efficiency shows a zonal pattern of high in the east and low in the west. This geographical difference may be related to the earlier economic development, higher technological level, and greater policy support in the eastern region, while the western region has lower land green utilization efficiency due to relatively lagging development and greater pressure on resource utilization. Third, through the kernel density analysis, it is found that there is a polarization of the level of land green use efficiency, and the phenomenon of uneven development is becoming more and more obvious. This phenomenon may reflect the imbalance between regions in terms of resource allocation, technology promotion and policy implementation.
Table 6.
GML of green land use efficiency in China’s provinces during 2010-2022.
The analysis of the GML index and its decomposition shows that, from a national perspective, the bottleneck in the overall development of green land use efficiency lies in the technical efficiency of green land use. This suggests that while technological progress is crucial to improving efficiency, the application and management of existing technologies still need to be improved. From the regional perspective, the growth of land green use efficiency in each region is realized by the combined promotion of green technology progress and technical efficiency. Differences in the performance of different regions in the application of green technologies and the improvement of technical efficiency may be the main reason for the differences in efficiency. From the provincial perspective, there are differences in the actual endogenous dynamics that cause changes in land green utilization efficiency across provinces. For most provinces, green technology progress has become a bottleneck constraining the growth of land green utilization efficiency. A few regions are facing efficiency improvement challenges due to the constraints of technological progress in green land use. This suggests that different provinces need to formulate individualized strategies for technological progress and efficiency improvement according to their own actual conditions.
This study may be limited by data quality, model assumptions, and indicator selection in measuring the green land use efficiency. For example, the application of the GML index and its decomposition index, while providing a valuable analytical tool, may have overlooked other important influencing factors, such as policy changes and economic fluctuations, which may have a significant impact on the results. The analysis of some economically developed and underdeveloped regions may need to be more carefully delineated to better reflect their different situations in terms of green utilization efficiency. Future research could consider introducing more influencing factors or adopting more complex models to improve the accuracy of the results, and could further explore the relationship between policy interventions, economic development, and the application of green technologies, especially in terms of their specific performance in different regions and provinces. More complex models can also be explored to overcome the limitations of existing models. For example, the introduction of a nonlinear production function or consideration of heterogeneity factors may improve the accuracy of efficiency measurements. Explore more efficient tools for assessing green land use efficiency by integrating machine learning and big data analytics methods to address data and modeling challenges. Strengthening the assessment of the effectiveness of local policies and research on the promotion of green technologies will help to formulate more effective policies on green land use. Through the above analysis, we can have a more comprehensive understanding of the changes in land green utilization efficiency and the driving factors behind it, which will provide a reference for future research and policy formulation.
Conclusions
In conclusion, insufficient technological research and development, inadequate infrastructure and management systems, lack of policy support and incentives, shortage of human resources, insufficient technical training, and weak market mechanisms and social awareness have combined to constrain the improvement of green land use efficiency in various provinces. Therefore, there is an urgent need to take comprehensive measures from multiple aspects to promote the progress of land green utilization technology and the improvement of efficiency. Specific recommendations are as follows:
First, policy support and incentive mechanisms. The government should formulate and implement incentive policies, such as tax exemptions, subsidies, and preferential loans, to encourage enterprises and scientific research institutions to invest in the research, development, and application of land green utilization technologies, and set up a special fund for technological innovation in land green utilization to support the research, development, promotion and application of key technologies. It has also formulated and improved relevant regulations and standards to promote the application of land green utilization technologies and ensure the standardization and normalization of technology implementation.
Second, scientific and technological research, development, and technology promotion. Increase investment in the research and development of green land-use technologies, encourage cooperation between scientific research institutions and enterprises to develop high-efficiency, low-energy-consuming green technologies, and implement demonstration projects on green land-use technologies. Demonstrate the effectiveness of these technologies through such projects, disseminate successful experiences, drive more regions to apply green technologies, provide technical training and support, and help local governments, enterprises, and farmers master and apply green land-use technologies.
Third, efficient utilization of resources and recycling. Intensive land-use patterns are being promoted to improve land-use efficiency and reduce land waste and idleness. Promote recycling of agricultural technologies, and through organic fertilizers, ecological planting and breeding, and other technologies, realize the recycling of agricultural production and reduce environmental pollution. Develop resource recycling technologies, promote the resource utilization of waste, and reduce the occupation and destruction of land resources.
Fourth, ecological protection and restoration. The implementation of ecological restoration projects, such as returning farmland to forests and grasslands and restoring wetlands, improves the ecological function of land, strengthens the construction and management of nature reserves, protects rare plants and animals as well as the ecological environment, and promotes the sustainable use of land resources. Additionally, the application of advanced pollution prevention and control technologies helps control agricultural and industrial pollution and protect soil and water resources.
Fifth, information technology and intelligent management. Apply remote sensing, GIS, Internet of Things, and other information technologies to implement precision agriculture, improve the efficiency and green level of agricultural production, and develop and apply intelligent management systems for land resources. This enables real-time monitoring and optimized management of land use. Using big data analysis technology, conduct in-depth analysis of land use to provide scientific decision-making support and optimize land use patterns.
Sixth, public participation and social supervision. Strengthen public education, raise environmental awareness and participation across the population, and promote the implementation of green land use. Establish a social supervision mechanism and encourage the public and non-governmental organizations to participate in supervising land use to ensure the effective implementation of green technologies. Through these measures, the innovation and application of land green utilization technology can be effectively promoted, enabling the sustainable utilization of land resources and the protection of the ecological environment.

