

Introduction
The emergence and spread of drug-resistant pathogenic bacteria potentially threaten human health. ARGs, whose expression products can inhibit the effects of antibiotics, mostly exist in bacteria and originate from environments containing antibiotics. Through methods of DNA transfer between bacteria, such as transformation, transfection, and conjugation, ARGs can be transferred from one DNA system to another and from one bacterial cell to another. This facilitates the spread of ARGs. Because antibiotic resistance genes in human bacterial pathogens originate from multiple bacterial sources, the genomes of all bacteria can be viewed as a single global gene pool. For example, the carriage of resistance genes by plastids and their subsequent dissemination affect the transmission of ARGs [1-3].
With the advancement of molecular methods, the analysis of ARGs has increased rapidly. Metagenomic analysis of the distribution of ARGs in the environment has shown that they are widely present in the intestines of humans, hospital waste and wastewater, animal husbandry waste and wastewater, marine sediments, forests, and agricultural soils [3-7]. Studies on the gut resistome have revealed that ARGs are commonly found in human intestinal microorganisms and originate from intestinal anaerobic commensal bacteria, and ARGs originating from intestinal anaerobic commensal bacteria might be transferred to disease-causing pathogens, resulting in the emergence of strains resistant to multiple drugs [8]. Tracking the distribution of ARGs in wastewater from hospitals and downstream waters shows that if hospitals use more antibiotics, ARGs increase in downstream waters and pass through hospitals related to the outflow of wastewater [9]. Approximately 20% of human pathogenic bacteria carry new ARGs found in human-influenced environments (wastewater treatment plants) [10]. The large amounts of nutrients and antibiotics present in discharged livestock wastewater could lead to changes in the bacterial community in river water and cause changes in antibiotic resistance [11].
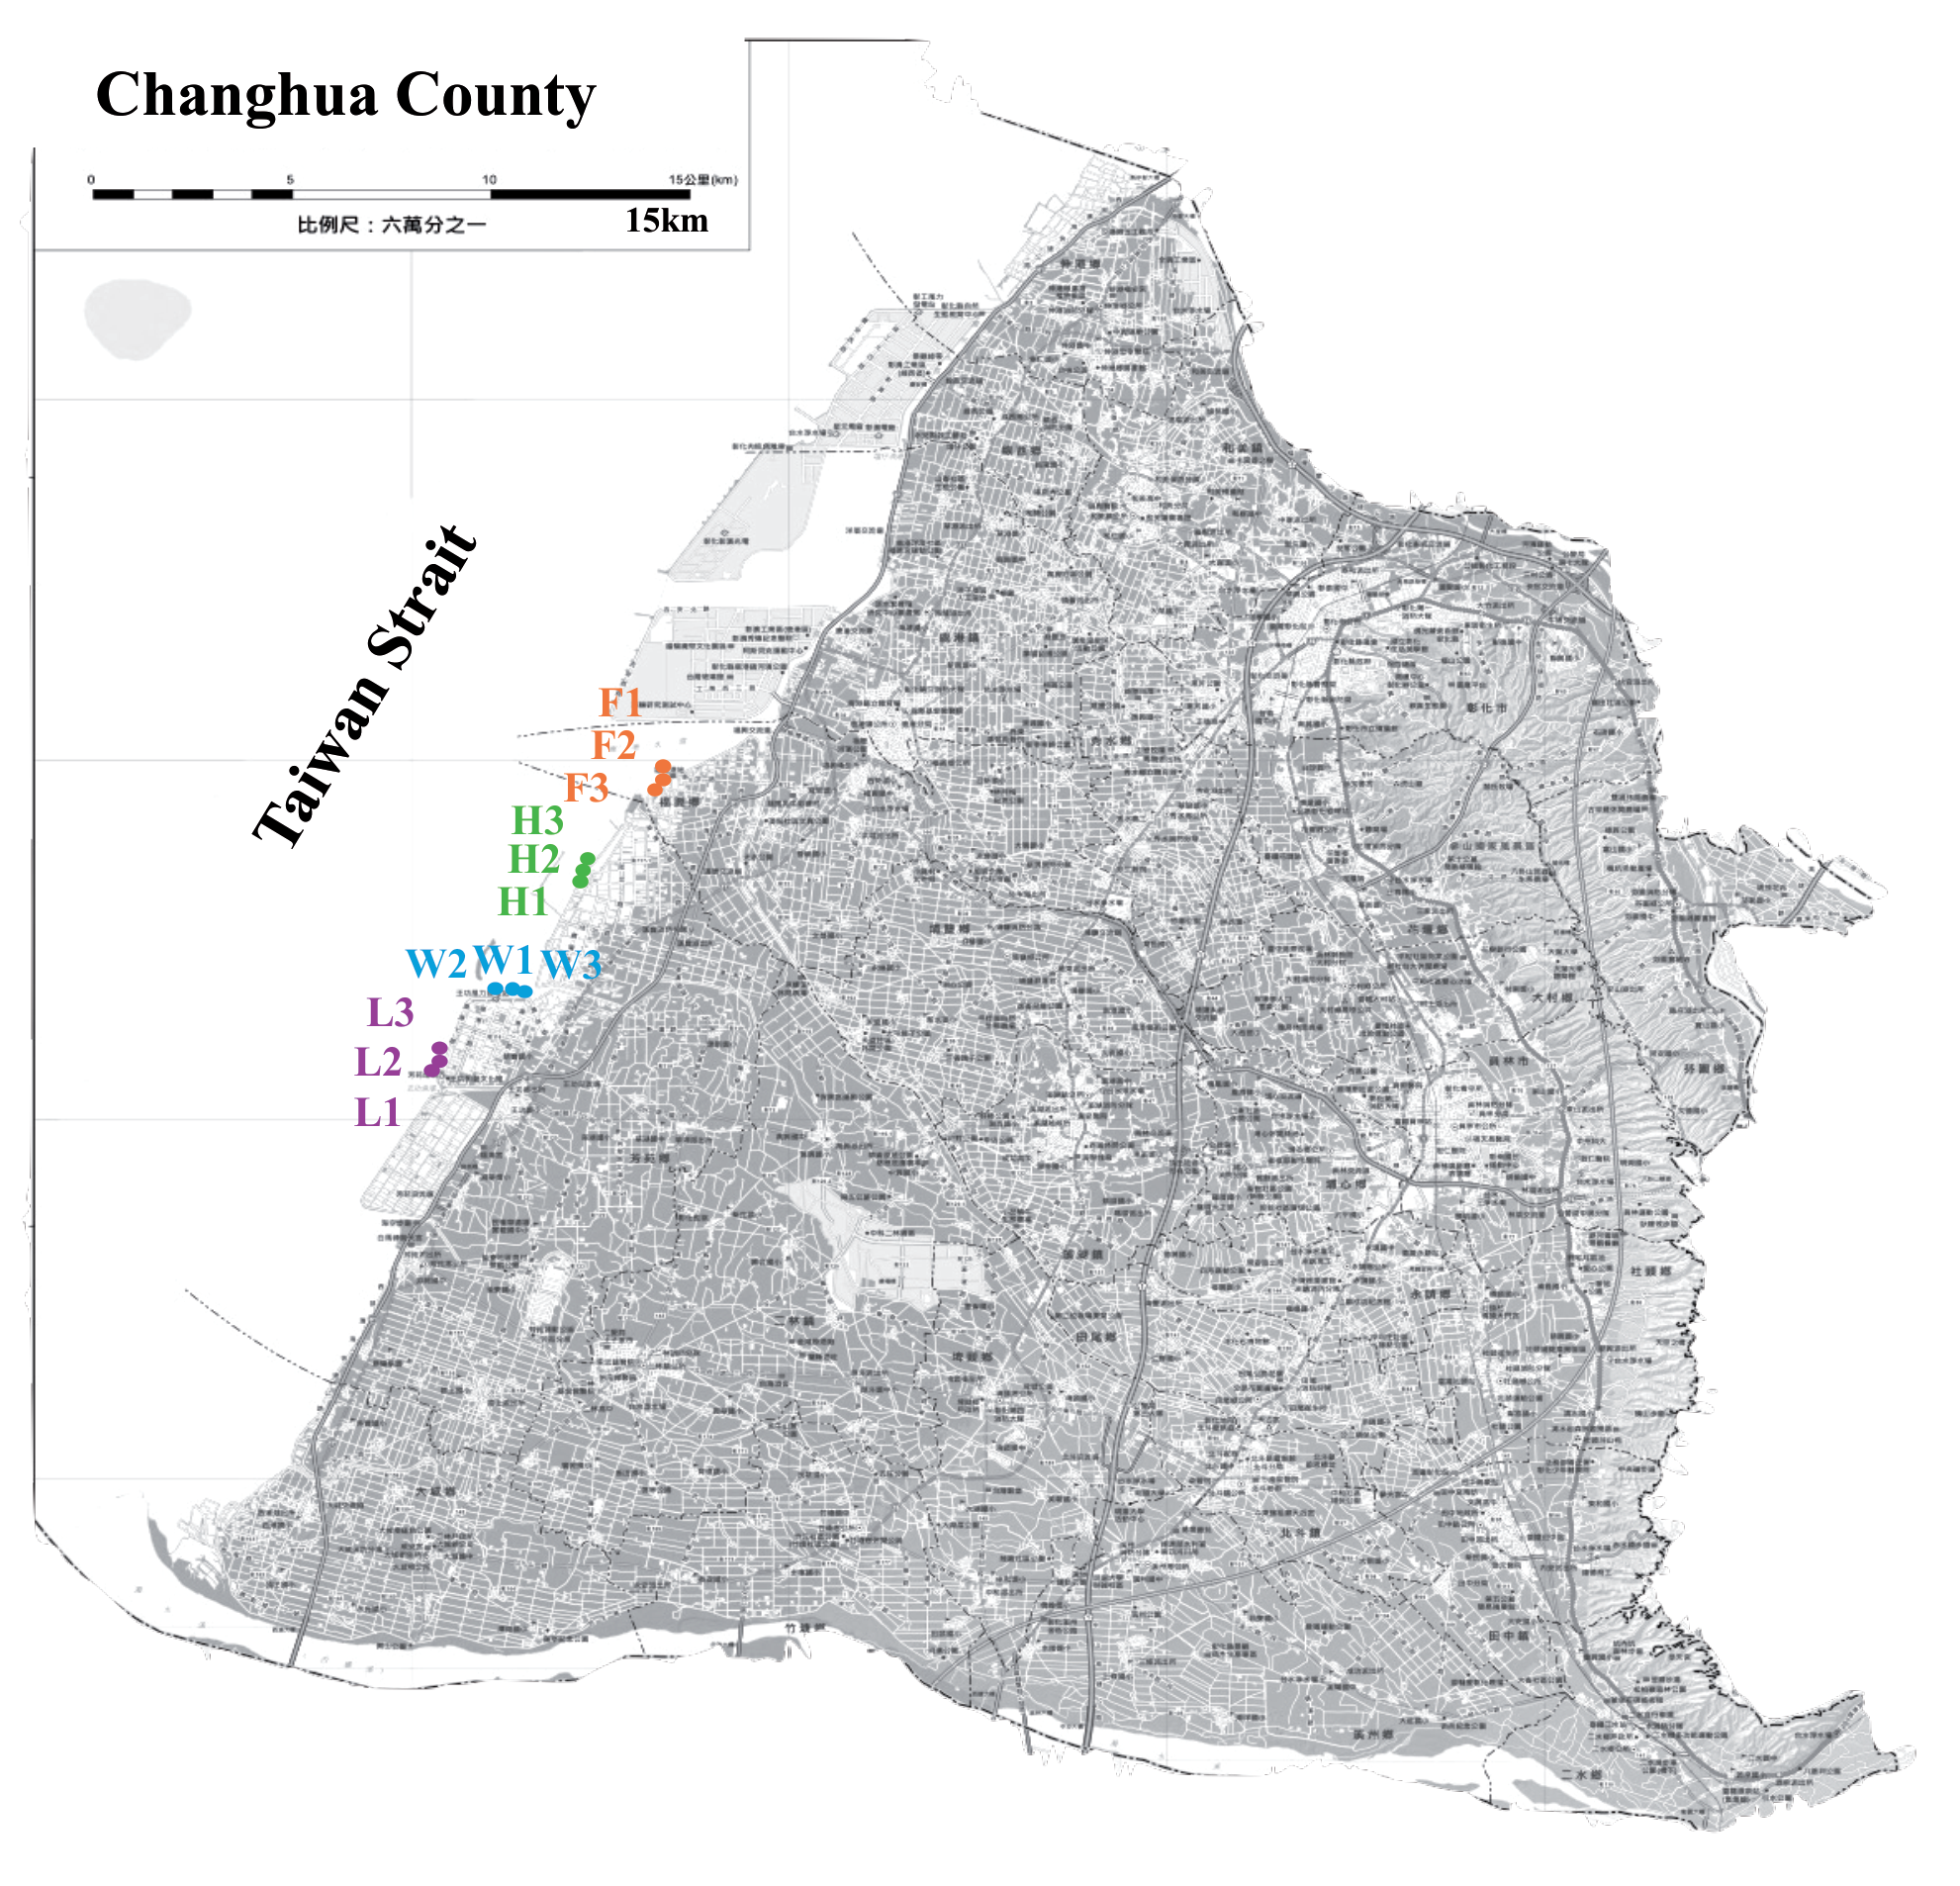
Fig. 1.
Location and overview map of the study area. F, H, L, and W represent the Fubao wetland, Hanbao wetland, Fangyuan Lighthouse and Wanggong wind power station, respectively.
ARGs are ubiquitous and expressed in various natural environments, such as samples from humans, mouse intestines, marine bacterioplankton, sponges, forest soils, and seabed sediments. ARG expression is related to different environments, which greatly increases the possibility of the occurrence of human pathogenic bacteria [12]. ARGs in estuarine sediments are diverse and abundant [13] since estuarine and coastal habitats located between terrestrial/freshwater and marine ecosystems act as natural filtering points for pollutants and are hotspots of anthropogenic impacts [14]. Understanding the occurrence and distribution of antibiotic resistance in microbial populations along the coast is thus necessary to reduce health risks from exposure to antibiotic-resistant pathogenic bacteria. The study of the distribution of ARGs on the Changhua coast is still in its initial stages.
This study aimed to investigate potential antibiotic resistance in Changhua coastal soil. Changhua's coastline is approximately 76 kilometers long and features sandy beaches. The intertidal zone in Changhua's coastal area reaches 3 to 5 kilometers, and its ecosystem is extremely diverse and rich. Waterbirds in this area often gather in groups to forage, which is characteristic of the coastal landscape. Fishponds and oyster farming can be seen in the coastal landscape. Residents along the coast are engaged mainly in agriculture, animal husbandry, and fisheries. Agriculture and animal husbandry include raising cattle, pigs, and poultry, such as chickens, ducks, and geese. The fisheries are mainly freshwater fishponds, seawater fishponds, and clam and oyster farms [15, 16]. Soil microbial DNA was prepared, and 16S rDNA was sequenced, followed by microbe comparison and biodiversity analysis. We applied the bioinformatic tools BugBase [17], FAPROTAX [18], PICRUSt2 [19], and Tax4Fun2 [20] to perform function prediction.
Materials and Methods
Study Site and Soil Sample Collection
In this study, we collected soils from the Fubao wetland (F), Hanbao wetland (H), Fangyuan Lighthouse (L) and Wanggong wind power station (W) in Changhua County (Fig. 1).
Three soil samples collected from each location were used as replicates, and the collection date was 30 March 2022. The soil was collected with a soil sampler at a depth of 10–20 cm. After collection, the samples were placed in labeled sterile polyethylene centrifuge tubes, brought to the laboratory, and stored at -20°C. The study information included samples, groups, collection locations, soil pH values, and electrical conductivity (EC) values, which are listed in Table 1.
Table 1.
Metadata. Study information includes sample, group, collecting location, soil pH, and EC.
Soil pH and EC Analysis
For the soil pH analysis, 5 g of air-dried soil was placed in a 15 mL sterile polyethylene centrifuge tube, followed by the addition of 5 mL deionized water (in a 1:1 ratio). The mixture was shaken on a reciprocal shaker for 30 minutes at 140 rpm [21]. For the soil EC analysis, 5 g of air-dried soil was placed in a 50 mL sterile polyethylene centrifuge tube, mixed with 25 mL of deionized water (in a 1:5 ratio), and shaken on a reciprocal shaker for 60 minutes at 140 rpm. The mixture was then left to stand for 30 minutes [22]. The pH or EC of the solution (supernatant) was measured using a multifunctional water detector meter (WA- 2017SD, LUTRON ELECTRONIC ENTERPRISE CO., LTD., Taipei, Taiwan).
DNA Extraction, Polymerase Chain Reaction (PCR), and Sequencing
Bacterial genomic DNA was extracted from 0.5 g of soil via an EasyPrep Stool Genomic DNA Kit (BIOTOOLS Co., New Taipei, Taiwan) according to the manufacturer’s instructions. In accordance with the amplification of the full-length 16S gene with barcoded primers for multiplexed SMRTbell library preparation and sequencing procedures (Pacbio, Menlo Park, CA, USA), the full-length 16S genes (V1-V9 regions) were amplified via barcoded 16S gene-specific primers, and the PCR products of 1500 bp were chosen and purified via AMPure PB beads for SMRTbell library construction. Sequencing was further performed in circular consensus sequence (CCS) mode on a PacBio Sequel IIe instrument to generate HiFi reads with a predicted accuracy (Phred scale) = 30. The nucleotide sequences determined in the present study have been deposited in the NCBI Sequence Read Archive database, and the BioProject accession number is PRJNA1138882.
Processing and Analysis of Sequence Data
The demultiplexed 16S rDNA sequences had the primers removed and were denoised with DADA2 [23] to obtain the amplicon sequence variants (ASVs), and the derived table indicates the number of times each ASV was observed in each sample via QIIME 2 [24]. For DADA2 denoising steps, the command was “qiime dada2 denoise-ccs --i-demultiplexed-seqs reads3_qza/single-end-demux.qza --p-front AGRGTTYGATYMTGGCTCAG --p-adapter RGYTACCTTGTTACGACTT --p-min-len 1000 --p-max-len 1600 --p-n-threads 4”. The sequence analyses of taxonomy assignment, alpha-diversity, beta-diversity, and hierarchical clustering were performed as previously described [25].
Potential Antibiotic Resistance Analysis
The potential antibiotic resistance of the microbial communities was determined with BugBase [17], FAPROTAX [18], PICRUSt2 [19], and Tax4Fun2 [20] as described previously [26]. For PICRUSt2 and Tax4Fun2, the abundance tables of Kyoto Encyclopedia of Genes and Genomes (KEGG) orthologs (KOs) were further applied to retrieve the KOs related to antimicrobial resistance [27]. The network analysis and Spearman correlation of ARGs were generated in R version 4.3.1 with the graph_from_data_frame and rcorr functions, respectively [28].
Fig. 2.
Relative abundances of the phyla of microbial communities in coastal soils. (a) Comparison of individual soil samples. (b) Comparison of the four soils from the Fubao wetland (F), Hanbao wetland (H), Fangyuan Lighthouse (L) and Wanggong wind power station (W).
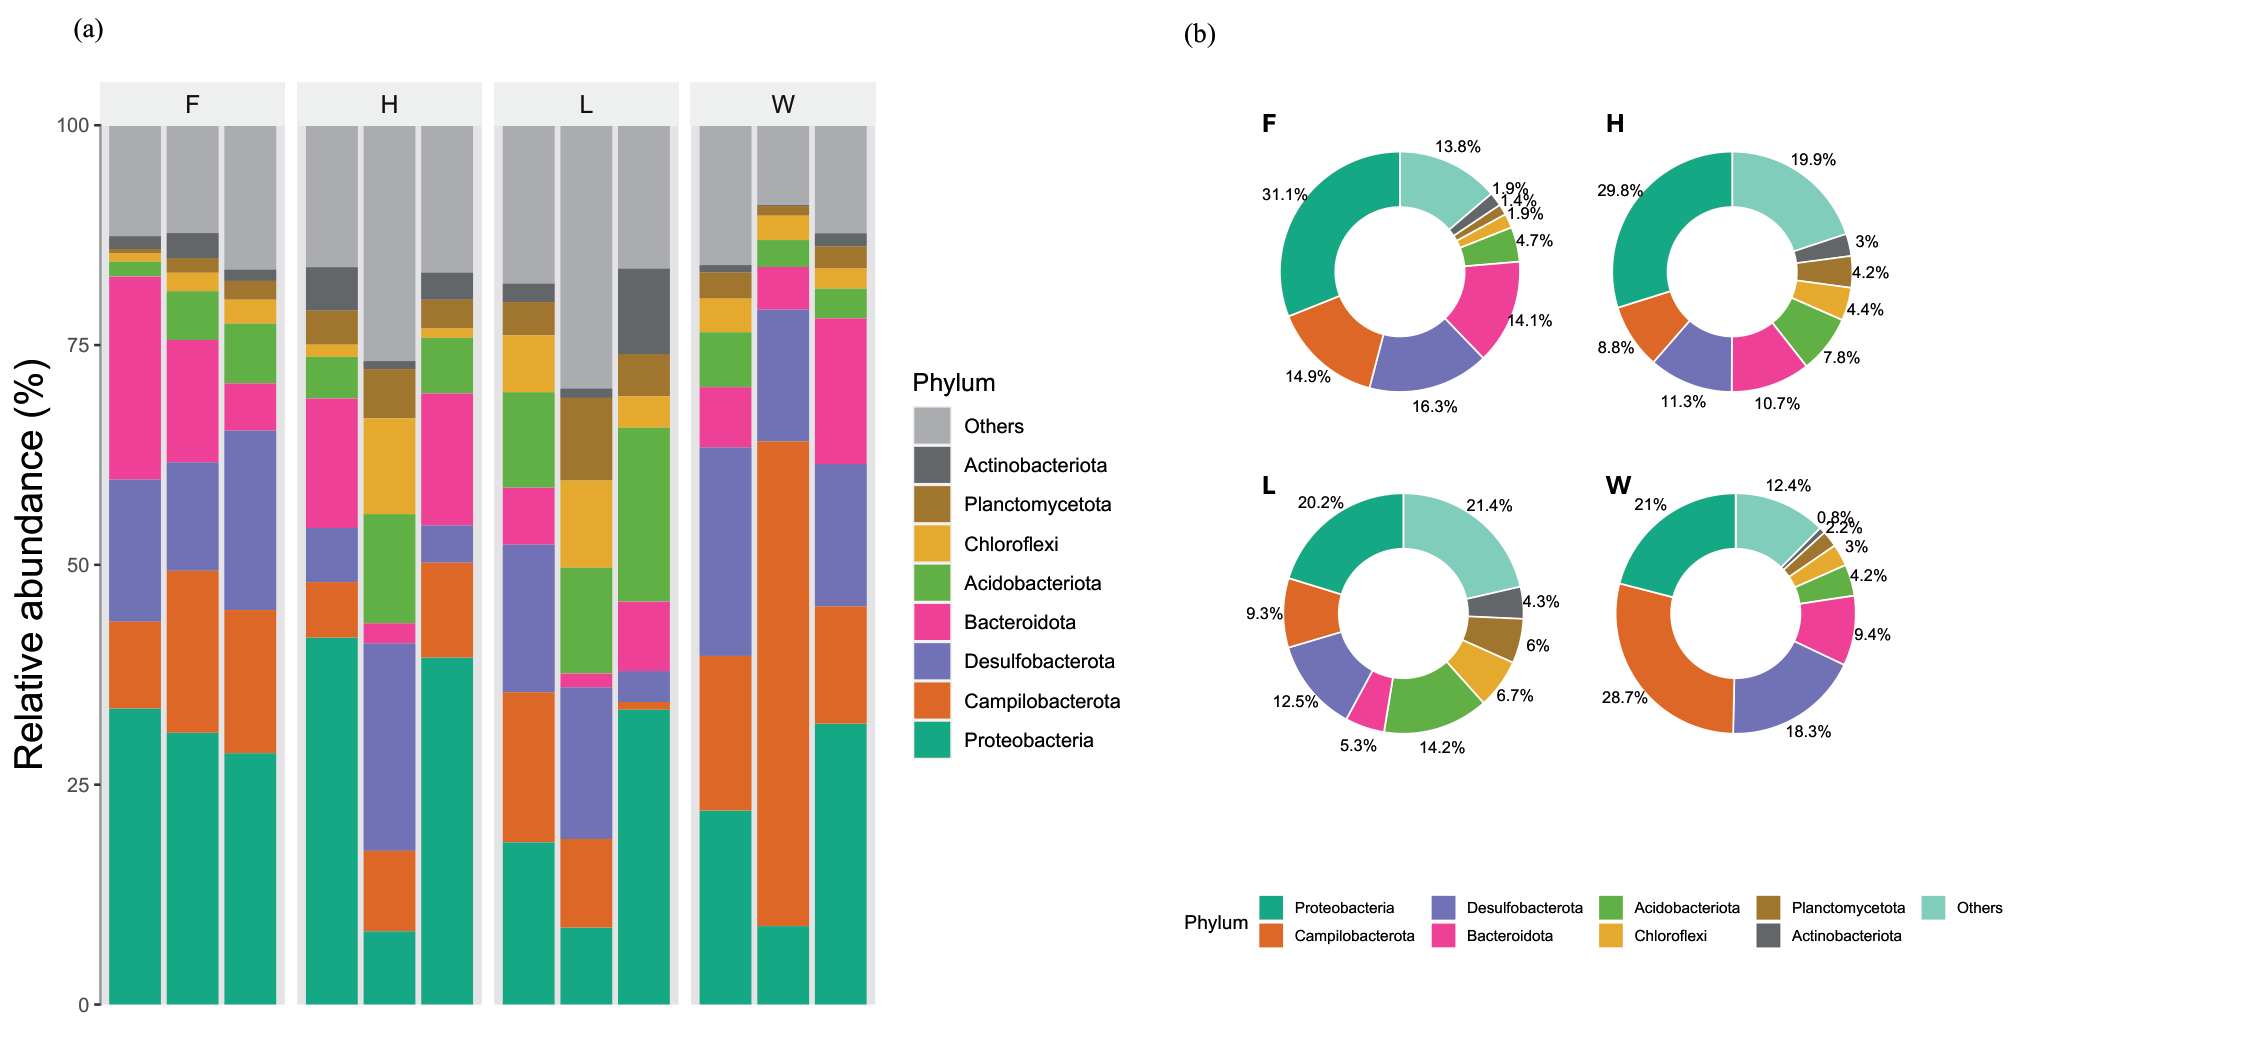
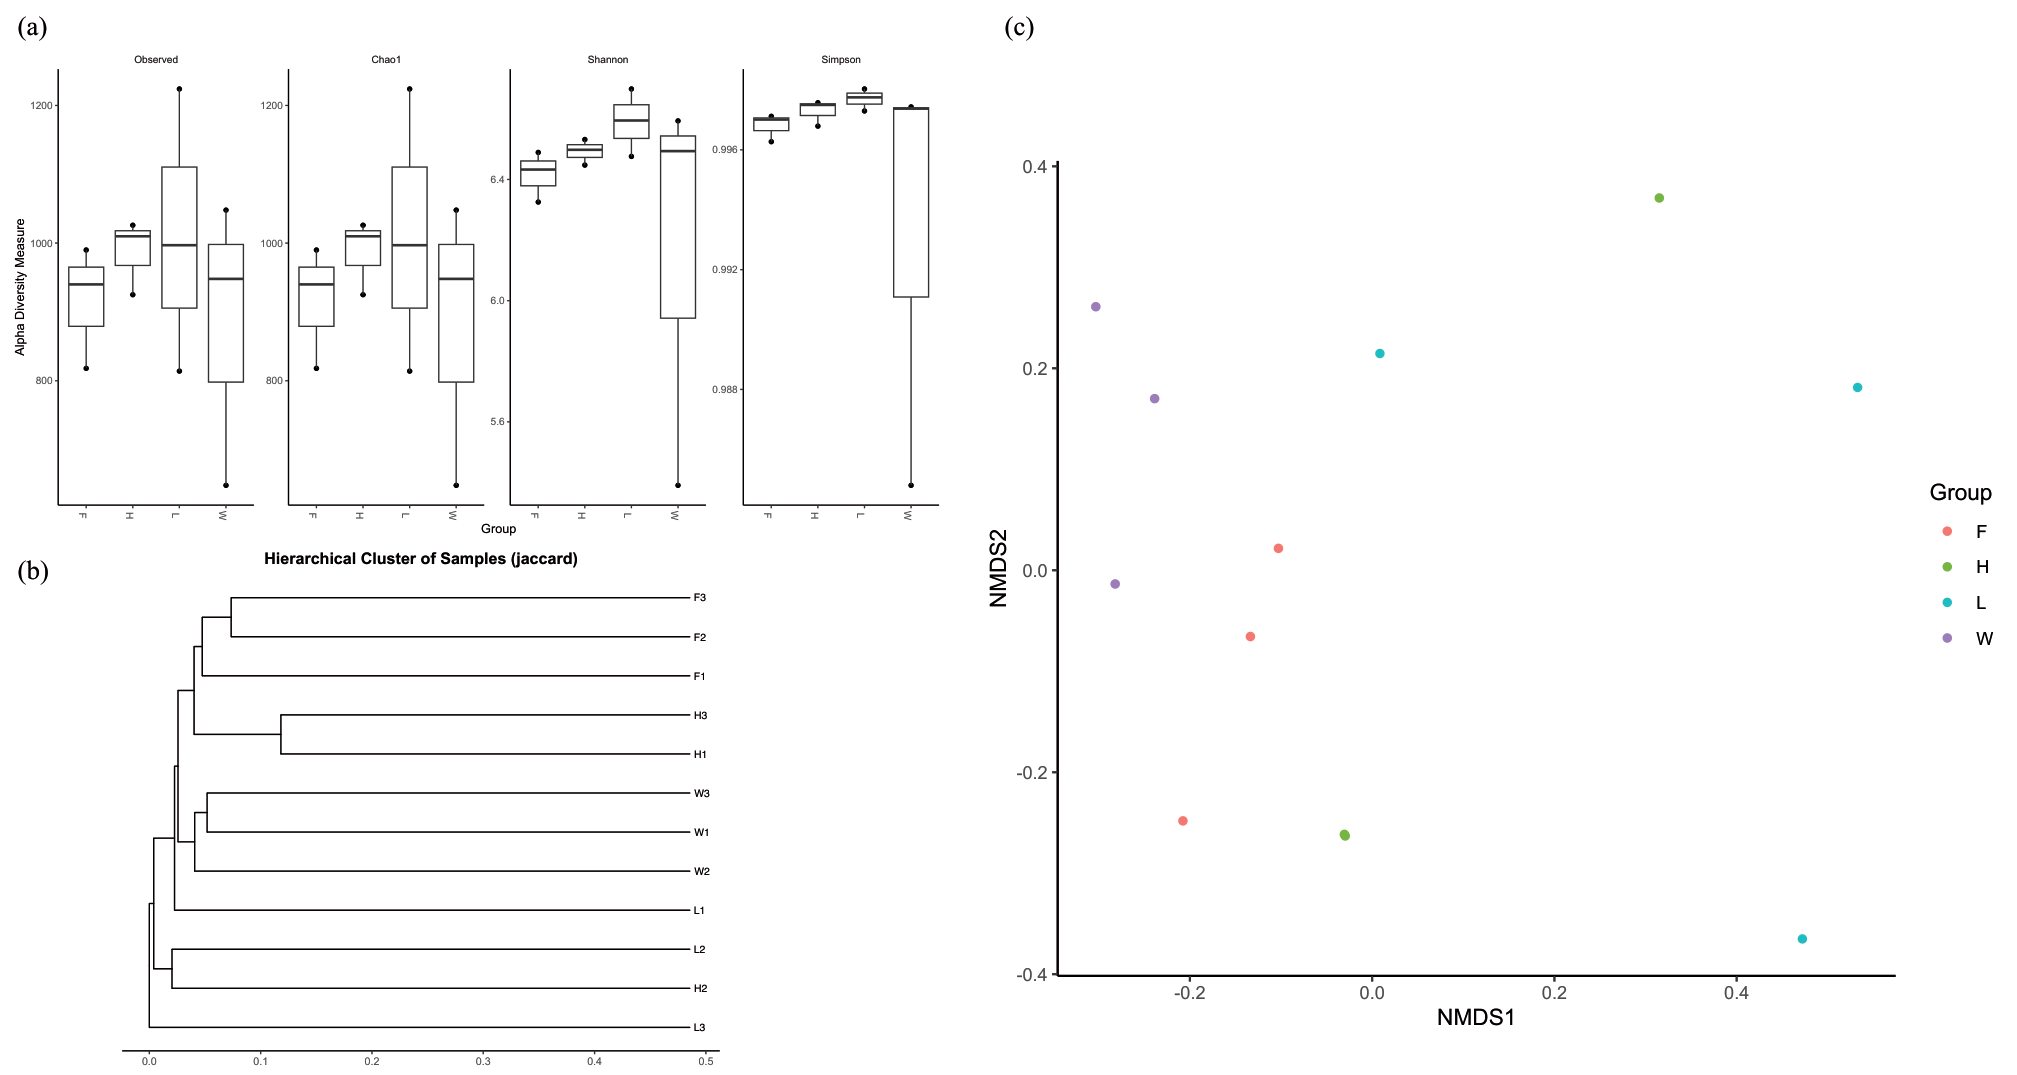
Fig. 3.
(a) Observed features and Chao1, Shannon, and Simpson diversity indices of the soil microbial community. (b) Hierarchical cluster analysis of the soil microbial communities via the Jaccard, Hellinger, and average methods. (c) Nonparametric multidimensional scaling (NMDS) analysis of the effects of the Jaccard distance on the bacterial communities of coastal soil. Each point represents the bacterial community of a given sample.
Results and Discussion
Phylogenetic, Diversity, and Microbial Community Analyses
Fig. 2 presents the percentages of different bacterial varieties in the four locations, and the dominant microorganisms were Proteobacteria, Campilobacterota, Desulfobacterota, Bacteroidota, Acidobacteria, and Chloroflexi. The predominant microorganisms in the F soils were Proteobacteria (31.1%), Desulfobacterota (16.3%), Campilobacterota (14.9%), Bacteroidota (14.1%), and Acidobacteria (4.7%); those in the H soils were Proteobacteria (29.8%), Desulfobacterota (11.3%), Bacteroidota (10.7%), Campilobacterota (8.8%), and Acidobacteria (7.8%); those in the L soils were Proteobacteria (20.2%), Acidobacteria (14.2%), Desulfobacterota (12.5%), Campilobacterota (9.3%), and Bacteroidota (5.3%); and those in the W soils were Campilobacterota (28.7%), Proteobacteria (21%), Desulfobacterota (18.3%), Bacteroidota (9.4%), and Acidobacteria (4.2%). Campilobacterota is a novel phylum reclassified from Epsilonproteobacteria [29, 30]. Desulfobacterota appeared to be the reclassified bacteria from Deltaproteobacteria and Thermodesulfobacteria and is capable of sulfate reduction [31]. Indeed, studies on coastal mangrove, marsh, or wetland sediment microbial communities have shown that the predominant phyla are Proteobacteria, Bacteroidetes, Acidobacteria, Chloroflexi, and Actinobacteria [32-36].
The community richness (Chao1 and Observed_ features) and diversity (Shannon and Simpson) indices did not significantly differ among the F, H, L, and W soils; the microbial community in the H soils had the highest average Chao1 index of 1100, and that in the L soils had the highest Shannon index of 6.6 (Fig. 3a). In the mangrove and mudflat sediments of the Mai Po wetland, Hong Kong, the Shannon index reached 10.84 and 11.58, respectively [36]. However, in the coastal estuarine wetlands of the Yellow River Delta National Nature Reserve and the coastal area of Nantong, China, the Shannon index was between 6.4 and 6.6, similar to the findings of this study [32, 33]. NMDS, a nonparametric ordination analysis based on the Jaccard distance, and hierarchical clustering analyses revealed that the microbial communities in the F and W soils were relatively close within groups, but in the H and L soils, the microbial communities presented within-group differences, suggesting diverse microbial communities in the H and L soils (Fig. 3b, c). Table 1 shows that among the four soils, the H and L soils have the highest pH (8.16, average) and EC (6.04 S/m, average) values, respectively; however, whether these findings are related to the dispersion of the microbial community requires additional soil physicochemical analyses for further clarification.
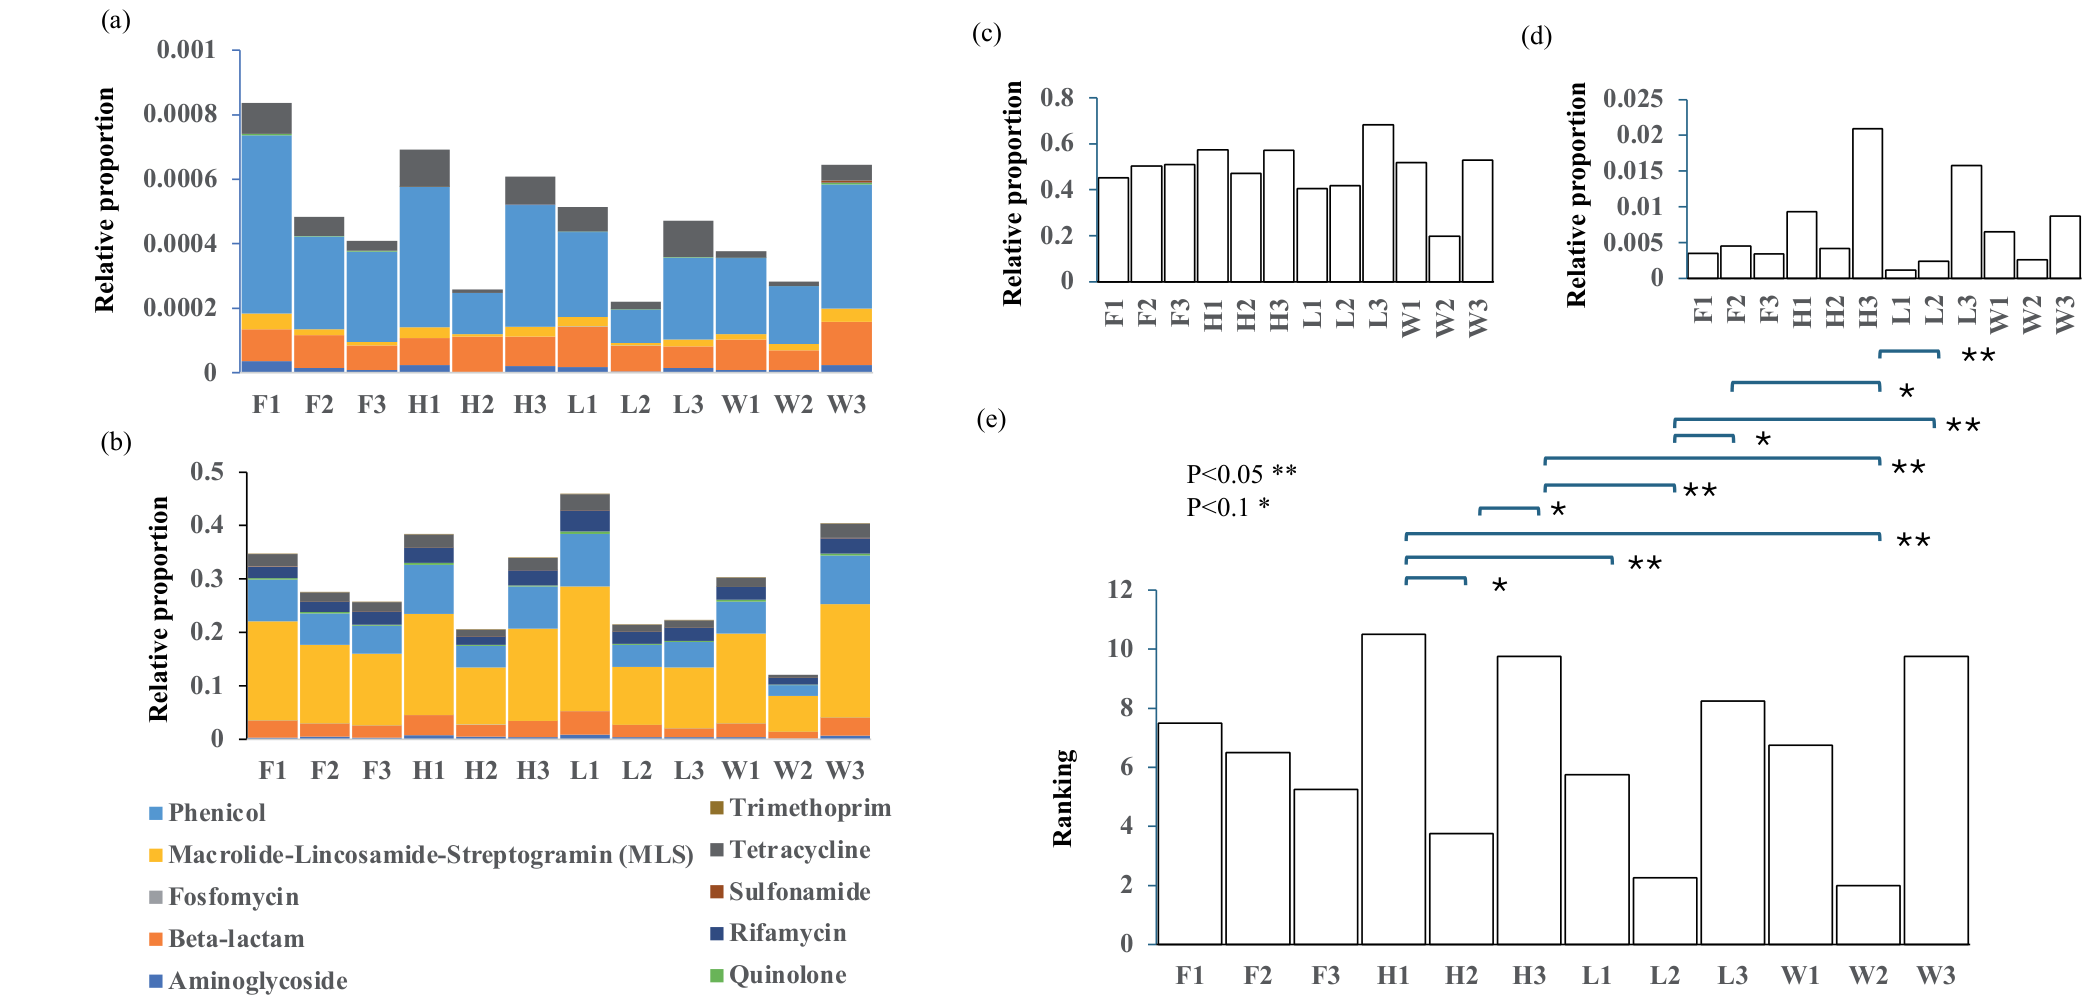
Fig. 4.
Antibiotic resistance prediction. (a) Relative proportion of ARGs (PICRUSt2). (b) Relative proportion of ARGs (Tax4Fun2). (c) Relative proportion of potentially pathogenic traits (BugBase). (d) Relative proportion of the human_pathogens_all trait (FAPROTAX). (e) Ranking of potential antibiotic resistance among the soil samples. Lower numbers (e.g., 1) indicate lower levels of antibiotic resistance, and higher numbers (e.g., 12) indicate higher levels of antibiotic resistance. The Kruskal‒Wallis test was applied to compare pathogen potential between samples.
Antibiotic Resistance Prediction
We applied antibiotic resistance prediction via the programs BugBase [17], FAPROTAX [18], PICRUSt2 [19], and Tax4Fun2 [20]. The ARG data were obtained from the KEGG database, and the KOs corresponding to the ARGs were compiled and collected. Furthermore, the KOs were retrieved from the KO abundance table generated by PICRUSt2 and Tax4Fun2 as the proportion of ARGs in the soil microbial communities. ARGs of aminoglycoside, beta-lactamase, fosfomycin, MLS, phenicol, quinolone, rifamycin, sulfonamide, tetracycline, and trimethoprim were identified for comparison. The top 3 dominant ARGs were phenicol (average, 58.8%), beta-lactam (21.9%), and tetracycline (11.1%) according to PICRUSt2 (Fig. 4a) and MLS (52.2%), phenicol (21.1%), and beta-lactam (9.3%) according to Tax4Fun2 (Fig. 4b). Furthermore, the ARG trimethoprim was not detected by PICRUSt2, whereas trimethoprim was present in the lowest proportion in Tax4Fun2. Both the BugBase and FAPROTAX tools can predict the functional features of biologically interpretable traits, and pathogenicity, which is considered related to antibiotic resistance, was applied for comparison (Fig. 4c, d). The soils with the 3 highest proportions of potential pathogenicity were L3 (68.3%), H1 (57.5%), and H3 (57.2%) according to BugBase. Soils H3 (2.09%), L3 (1.58%), and H1 (0.93%) were the 3 soils with the highest potential pathogenicity predicted by FAPROTAX. There was no statistically significant difference among the four soils. To further compare the degree of potential antibiotic resistance among the soil samples, we sorted the soil samples on the basis of their relative abundance based on the four functional prediction tools: the sample with the smallest proportion was marked 1, increasing in order, and the one with the highest proportion was 12. Finally, we performed nonparametric one‒way ANOVA with the Kruskal‒ Wallis test. There was still no statistically significant difference between the groups. Soils H1, H3, and W3 were the top three, indicating their high potential pathogenicity (Fig. 4e).
In estuarine sediments, multidrug-, beta-lactam-, aminoglycoside-, and tetracycline-resistant genes were the most common, and the relative abundances of beta-lactam-, aminoglycoside- and tetracycline-resistant genes were approximately 17.7%, 16.5%, and 14.6%, respectively [13]. Furthermore, in coastal soil and sediment samples from the eastern seaboard of the USA, 76.4% of the samples presented at least one of the ARGs detected, and beta-lactam, tetracycline, and streptomycin ARGs were detected in 33.2%, 34.4%, and 42.2% of the samples, respectively [37]. Geographically, the level of antibiotic contamination in low- and middle-income countries is greater than in high-income countries, and the ARG abundance distribution clearly varies with latitude. For example, the relative abundance of sulfonamide and beta-lactam resistance genes is the highest at mid-latitudes and decreases at both high and low latitudes. The number of tetracycline resistance genes increases with latitude, whereas the number of fluoroquinolone, MLS, and aminoglycoside resistance genes decreases with increasing latitude [38]. In fact, except for the tetracycline resistance genes, the ARGs mentioned above presented the highest relative abundance at a latitude of approximately 25° (the latitude of the study area). According to the prediction results of PICRUSt2 and Tax4Fun2, the relative abundance of the ARG phenicol in each sample was high (Fig. 4a, b). However, other studies have shown that although phenicol resistance genes can indeed be detected in the environment, their relative proportions are low [13, 39-41]. Further quantitative PCR should be helpful to clarify these differences. We have used PCR reactions to analyze the ARGs, and tetA and tetW (tetracycline resistance genes) were detected in F2 and H2 soils respectively (data not shown) so far.
Network and Correlation Analyses of Antibiotic Resistance Genes
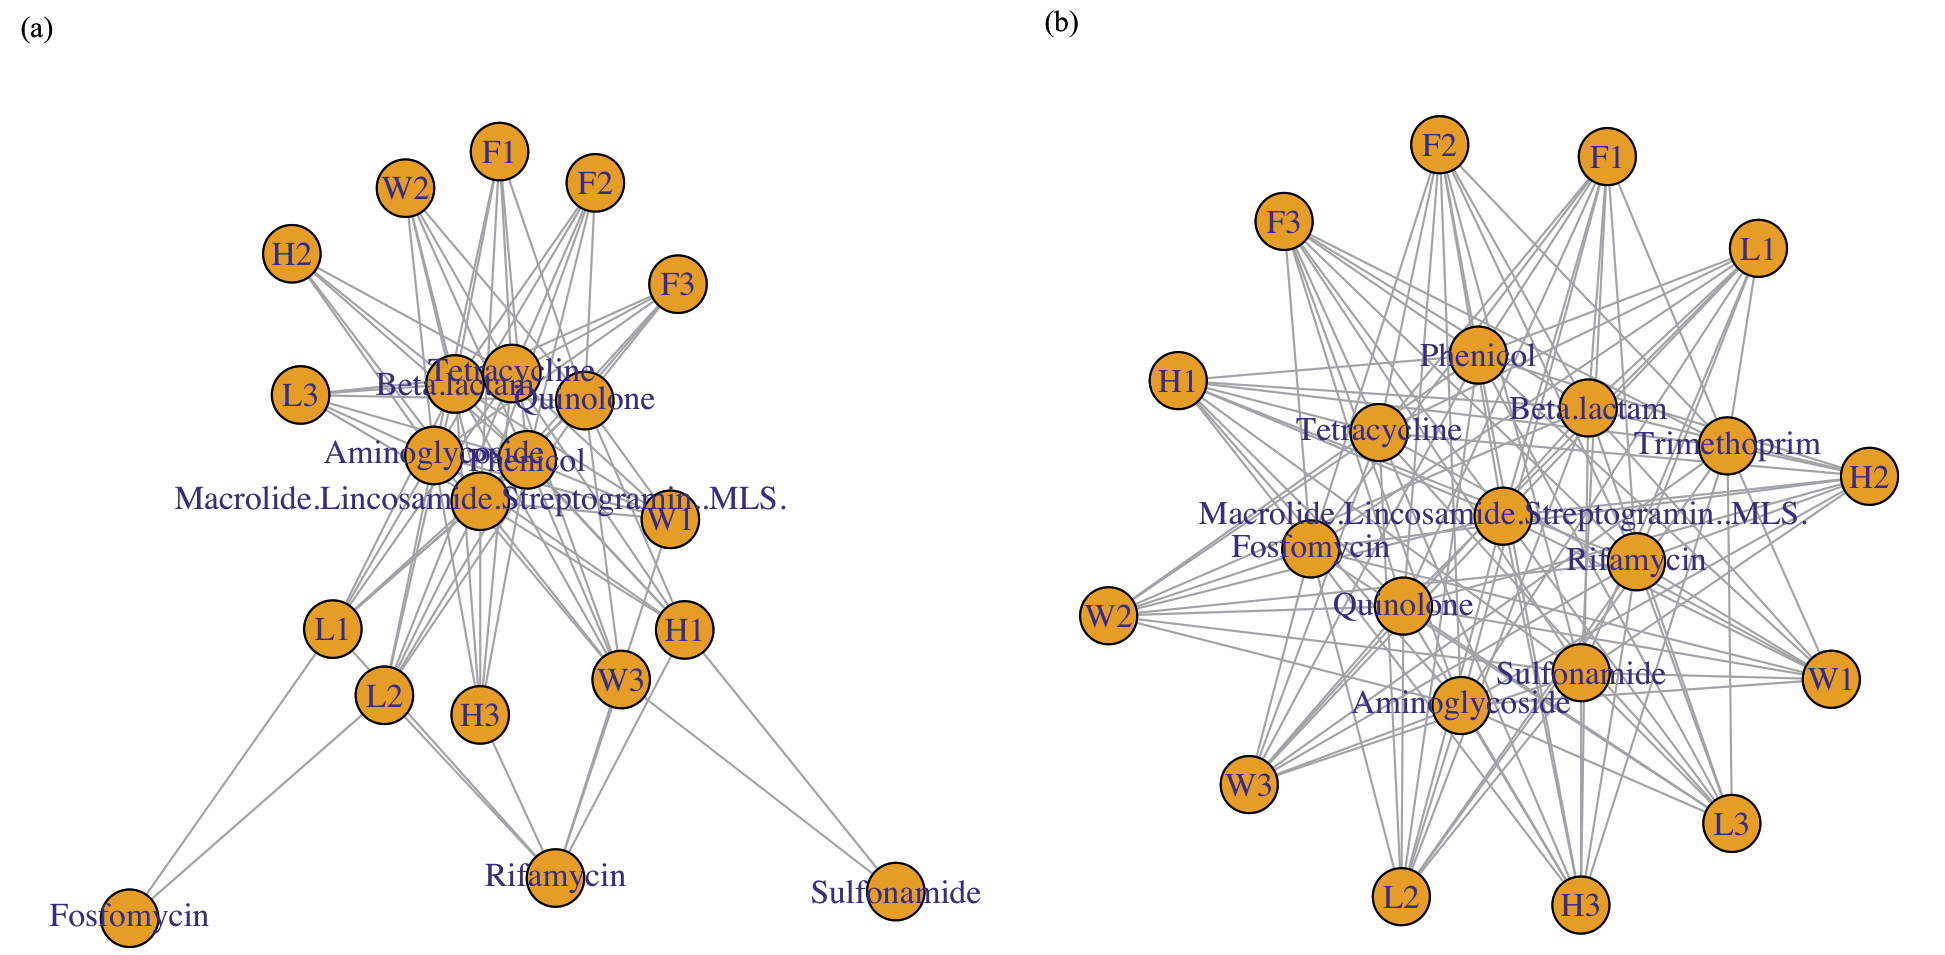
We conducted network analysis to explore the structural relationships between the soil microbial community and ARGs, as shown in Fig. 5, and the networks derived from the PICRUSt2 and Tax4Fun2 tools presented different structures. For example, the data analysis of PICRUSt2 revealed that the ARGs fosfomycin, rifamycin, and sulfonamide were connected to only a small number of soils, suggesting that their distribution is relatively limited and that their amounts are relatively small (Fig. 5a). In contrast, the analysis data from Tax4Fun2 revealed that all the analyzed ARGs were linked to all the soil samples (Fig. 5b). This difference may be due to the difference in the use of reference sequences and metabolic databases between the two methods. The abundance of sulfonamide resistance genes is positively correlated with the concentration of sulfonamide antibiotics, while the concentration of sulfonamide antibiotics in river water is positively correlated with frequent human activities and nutrients in river water [42]. The relative proportions of the ARGs fosfomycin, rifamycin, sulfonamide, and trimethoprim in the environment were relatively low. Among these genes, the rifamycin resistance gene is present in the greatest amount in dust; trimethoprim is present in the air; fosfomycin is most likely to be present in soil; and sulfonamide is widely distributed in dust, air, sediment, soil, and water, with the highest proportion in dust and sediment [41]. Furthermore, the aminoglycosides, fosfomycin, and tetracycline ARGs are mostly distributed in planktonic microorganisms, whereas the ARGs in biofilms are beta-lactam, phenicol, MLS, rifamycin, and sulfonamides [43].
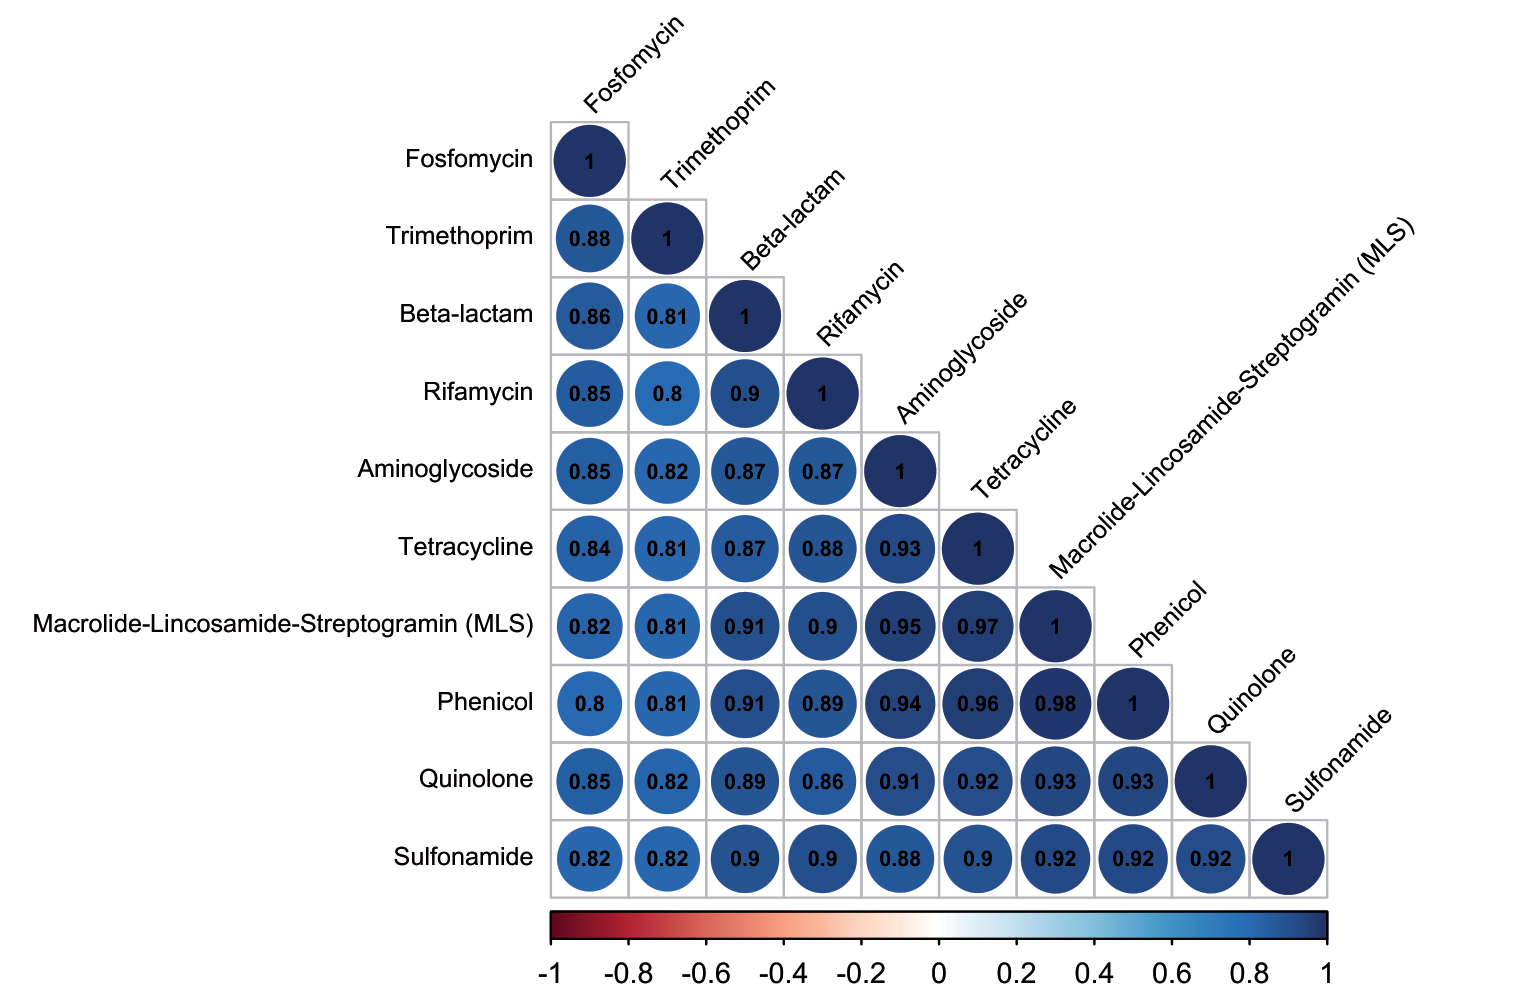
We further investigated the possible interactions among ARGs via Spearman rank correlation analysis. The correlation results (P<0.01) revealed that the 3 variables with the strongest positive correlations were MLS with phenicol, MLS with tetracycline, and phenicol with tetracycline, and the correlation coefficients were 0.98, 0.97, and 0.96, respectively (Fig. 6). Interestingly, the levels of ermB (a macrolide resistance gene) were reported to be positively correlated with those of tetracycline resistance genes [44], suggesting that both may be related to coselection [45]. Furthermore, aadA and aadA2 (aminoglycoside resistance genes) were found to be positively correlated with tetM and tetG (tetracycline resistance genes), respectively, in typical vegetable greenhouse soil, and aadA2 was also positively correlated with cmlA (a chloramphenicol resistance gene) [40].
Fig. 6.
Spearman rank correlation analysis between different ARGs. Strong correlations are indicated by dark blue squares. The scale bar colors denote the nature of the correlation, with 1 indicating a perfect positive correlation (dark blue) and -1 indicating a perfect negative correlation (dark red) between two ARGs. The number in the circle represents the Spearman rank correlation coefficient.
Coastal habitats, which lie between terrestrial and marine ecosystems, are hotspots of human impact. The differential distribution of ARGs in estuarine wetlands could be attributed to anthropogenic factors, such as the concentration of detected antibiotics, nearby sewage disposal, population density in the area, gross domestic product (GDP), aquatic production, urbanization ratio, meat production, pig marketing, total wastewater, the number of diagnosed and treated patients, and the number of residential patients [13]. Furthermore, migrating waterbirds [46], agriculture [47], animal husbandry [48] and aquaculture [49] on or near the Changhua coast may all contribute to the spread of ARGs. Importantly, however, the functional prediction was based on a few sequences. For example, 54 functional groups were represented by at least one record, and 71.98% of the ASVs were not assigned to any group by FAPROTAX. The weighted nearest-sequenced taxon index (weighted NSTI) of PICRUSt2 was between 0.24 and 0.42 (>0.15), suggesting low prediction quality. The fraction of sequences unused (FSU) by Tax4Fun2 was between 0.79 and 0.89. PCR with specific primers for ARGs would provide robust evidence of their presence [13, 50]. In addition, shotgun metagenomics should be used to understand the relationships between ARGs and the microbial community [43, 51].
Conclusion
This study revealed that the bacteria Proteobacteria, Campilobacterota, Desulfobacterota, Bacteroidota, Acidobacteria, and Chloroflexi were the predominant microorganisms on the Changhua coast. Phenicol (average, 58.8%), beta-lactam (21.9%), and tetracycline (11.1%) resistance genes were the top 3 dominant ARGs according to PICRUSt2 analysis, and MLS (52.2%), phenicol (21.1%), and beta-lactam (9.3%) resistance genes were the top 3 dominant ARGs according to the Tax4Fun2 tool. Correlation analyses revealed positive correlations between MLS and phenicol, MLS and tetracycline, and phenicol and tetracycline, suggesting the possibility of coselection of these ARGs. Our study highlights the types and distributions of possible ARGs along the Changhua coast. The origin and actual amount of these ARGs require further analysis for environmental safety assessment.

