

Introduction
On farms, airborne particulate matter and microbial aerosols are major sources of pollution [1]. In particular, in livestock and poultry rooms, microbial aerosols are primarily formed by microorganisms that attach to dust particles in the air [2]. Due to the high mobility and diffusibility of air, microbial aerosols can rapidly spread through the air, acting as potential disease vectors. Diseases can be transmitted through air, water, and food [3, 4]. Research has demonstrated the presence of pathogenic microorganisms such as bacteria, viruses, and fungi in microbial aerosols, which can lead to respiratory infections, digestive tract diseases, and skin diseases in livestock [5, 6]. When livestock becomes infected, it not only results in reduced performance and decreased economic efficiency of the farm but also increases veterinary and medication costs [7, 8]. Furthermore, some diseases are contagious and can rapidly spread among livestock, causing severe herd infections, outbreaks, and even transmission to humans, thereby impacting human health [9, 10].
The intensification of animal husbandry has led to a significant increase in the concentration of microorganisms and dust in the air both inside and outside livestock houses, contributing to the spread of infectious and conditionally infectious diseases as well as increased environmental pollution [11]. Specifically, large-scale chicken farming and the growing number of flocks in recent years have resulted in changes in the quantity and species of bacteria present in the air, water, feces, and soil of chicken farms, further influencing the transmission of opportunistic pathogens and flock performance [12, 13]. Therefore, detecting microorganisms in the environment of livestock and poultry houses is of paramount importance in preventing and controlling disease outbreaks [14].
In recent years, the rapid advancement of high-throughput sequencing technology has provided unique advantages for analyzing microbial community structures, making it an essential tool in microbial community research [15]. Compared to traditional methods, high-throughput sequencing can overcome the limitations of culture-based techniques and PCR amplification biases [16]. This enables researchers to realistically reveal the composition and structure of microbial communities, reducing experimental errors and uncertainties [17].
By employing high-throughput sequencing analysis of microbial communities, we can accurately identify and quantify the presence of microorganisms, explore the diversity and complexity of microbial communities, provide a more precise description of their composition and structure, and investigate microbial interactions, ecological functions, and community succession [18, 19].
In this study, we utilized high-throughput sequencing technology to analyze the microbial species, distribution, and potential presence of pathogenic microorganisms under different rearing practices. This lays the foundation for studying the diversity of microbial aerosols in chicken coops and can guide further investigations on safety-related aspects.
Materials and Methods
Materials
Three types of chicken coop, thick-bedding feeding, net flat feeding, and cage feeding, were selected in Shandong Province, East China. Broiler seedlings were purchased from Shandong Minhe Animal Husbandry Co., LTD in the same batch. The indoor air samples were collected by a liquid impact air sampler (KH055-M20619, Beijing Sino-West Huada Technology Co., LTD, China) with PBS as sample sorbents 10 times a day at 15 and 30 days of age. The samples were combined into one group and repeated three times. The three types of thick bedding feeding, net flat feeding, and cage feeding were named Z, H, and L, respectively. All samples were immediately transferred to liquid nitrogen and stored at -80ºC for subsequent high-throughput sequencing.
Genomic DNA Extraction
Total microbiome DNA was extracted using the QIAamp Rapid DNA Stool Mini Kit (QIAGEN, Germany). The quality of DNA extraction was measured by 0.8% agarose gel electrophoresis, and the DNA concentration was measured by NanoDrop 2000 spectrophotometer.
PCR Amplification and Sequencing
Bacterial 16S rDNA genes were amplified by PCR using primers 520F-802R with barcode (Sangon Biotech, Shanghai, China) [20]. Diluted genomic DNA was used as a template. Phusion®High-Fidelity PCR Master Mix with GC Buffer and High-Efficiency Enzyme (New England Biolabs, Beijing, China) was used to perform PCR to ensure amplification efficiency and accuracy. PCR products were examined by electrophoresis in 2% agarose gels. The gels were prepared by dissolving agarose in Tris-acetate-EDTA (TAE) buffer and heating until the agarose was completely dissolved. The gel was then poured into a gel tray and allowed to solidify. The PCR products were mixed with loading buffer and loaded onto the gel. Electrophoresis was performed at a constant voltage of 100 V for 30 minutes. The gel was stained with ethidium bromide and visualized under UV light. Bands were quantified using ImageJ software. After thorough mixing, electrophoresis was repeated in a 2% agarose gel, and the target bands were recovered using a gel recovery kit (Qiagen, Hilden, Germany). Sequencing libraries were prepared using the TruSeq Nano DNA LT Library Prep Kit from Illumina, and the constructed libraries were quantified by Qubit and Q-PCR. Libraries that met the criteria were sequenced using No-vaSeq 6000.
Sequencing Data Processing and Analysis
QIIME v1.8.0 (Knight and Caporaso Labs, USA) software was used to process the raw data. According to the primer and barcode information of the quality screening sequences, the corresponding samples were identified and assigned, and the query sequences such as chimeras were removed. The data were combined and divided into operational taxonomic units (OTU) based on 97% sequence similarity, the abundance information of each OTU was calculated, and the level of diversity of each sample was assessed based on the distribution of OTU abundance in different samples. A rarefaction curve was used to reflect whether the sequencing depth reached the standard. QIIME software was used to calculate alpha diversity values such as the Chaol index, Shannon index, and phylogenetic diversity. Community differences of species among samples were compared using the Unifrac algorithm, and beta diversity analysis was performed. The specific composition of each sample at different taxonomic levels was analyzed. A variety of multivariate statistical analysis tools were used to further measure the differences in the flora structure between different samples (groups) and the species related to the differences. Statistical analyses were performed using the SPSS software package (Version 19.0, IBM Corp., Armonk, NY), and P<0.05 was considered statistically significant.
Results and Discussion
Sample Sequencing Results and OTU Cluster Analysis
The bacteria found in the air of different chicken farms were sequenced for their 16S rRNA genes, and low-quality sequences were filtered out, as presented in Table 1. The total number of valid sequences across all samples amounted to 822, 506. These unique reads were clustered into OTUs at a 97% similarity threshold for species classification. Dilution curves were employed to assess the sequencing depth and ensure adequate coverage of all microbial groups. Fig. 1a) illustrates the dilution curves for all samples. The curve plateaued, indicating that increasing the amount of data would not significantly impact subsequent analyses. Hence, OTU sample coverage was deemed sufficient, suggesting that the sequencing data provided a comprehensive representation, with additional data making only a minor contribution to the discovery of new OTUs. To visualize the shared and unique OTUs identified in each group, a Venn plot was generated, as shown in Fig. 1b). The results revealed that 68 OTUs were shared across all samples.
Alpha Diversity Analysis
Alpha diversity index analysis involves examining the species diversity within a single sample. By considering the number and relative proportion of detected tags and OTUs, the Chao1 index was utilized to predict the microbial species present in the samples. Higher values of the Chao1 and ACE indices indicate greater community abundance. The Shannon index, on the other hand, serves as a composite measure of both OTU abundance and evenness, with higher values indicating greater community diversity. Based on the comprehensive analysis presented in Table 2, the species diversity varied among the different samples. This variation may be attributed to factors such as nutritional conditions, particulate matter quantity, UV radiation exposure, and airflow velocity. It was observed that microbial diversity decreased with the prolongation of thick bedding feeding and net flat feeding practices, while cage feeding showed the opposite trend.
Table 1.
Sequence information of samples.
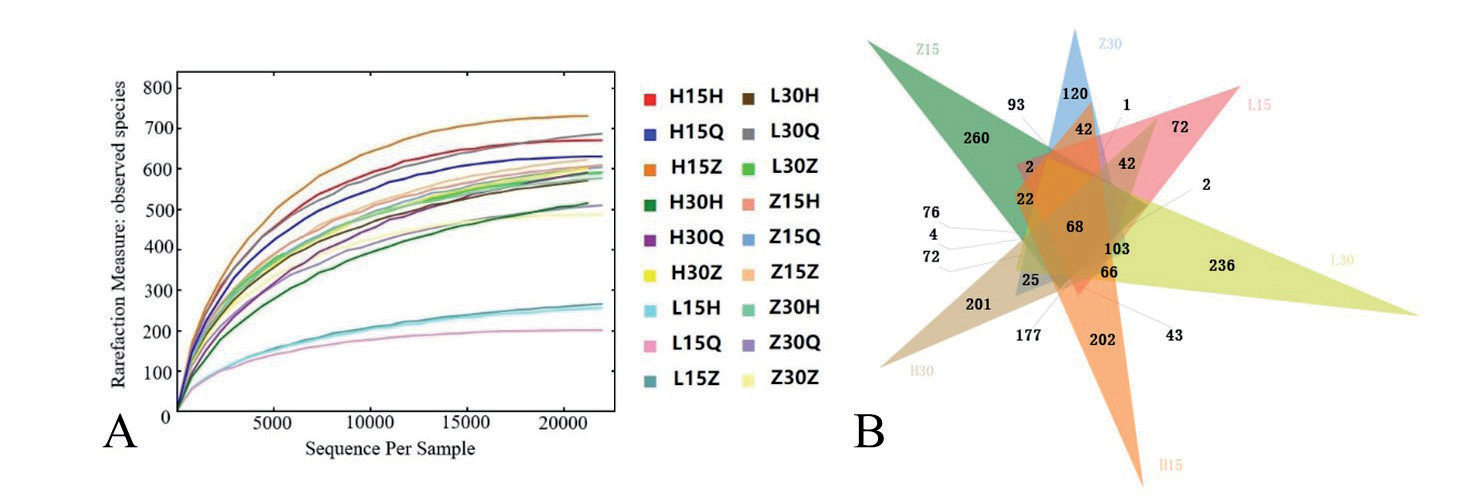
Table 2.
Bacterial Alpha diversity index.
Microbial Community Composition Analysis of the Samples
The microbial community composition of the sample is depicted in Fig. 2. At the phylum level (Fig. 2a)), a total of 31 bacterial phyla were identified. Proteobacteria and Firmicutes were found to be the predominant phyla across all samples. Among all samples, Platyphyla exhibited the highest relative abundance in day-old three-layer cages (97.1%) and 30-day-old online samples (85.0%), followed by Firmicutes at 15 days old. At 30 days old, the relative abundance of Proteobacteria in cage-reared chickens was the highest, accounting for 56.7% and 71.6%, respectively. Actinomyces displayed high abundance in litter samples, with a relative abundance ranging from 14.1% to 15.6%. In contrast, the abundance of Actinomycetes was comparatively low in the other two feeding methods. Other phyla such as Cyanobacteria, Bacteroidetes, and Acidobacteria exhibited relatively lower proportions. This pattern suggests that Proteobacteria, Absidia, and Actinobacteria are the dominant bacteria in the airborne microbial community structure within the chicken coop.
At the bacterial genus level (Fig. 2b)), a total of 494 bacterial genera were identified. The dominant microorganisms in the air of the chicken coop were different among the three feeding methods. Pseudomonas, Bacillus, Lactococcus, and Acinetobacter were the dominant microorganisms in thick bedding feeding (Z). Compared with 15 days old, 30 days old, 15 days old, 30 days old, and 15 days old, respectively. The relative abundance of Pseudomonas increased. The microbial community structure in cage feeding (L) changed significantly. Pseudomonas, Acinetobacter, and Stenotrophomonas were the dominant microorganisms in 15-day-old cage air, while Bacillus, Lactococcus, and Lactobacillus were the dominant microorganisms in 30-day-old cage air. Net flat feeding (H) also resulted in significant changes in the air microbial community. Lactococcus, Acinetobacter, Rhodanobacter, and Rhodanobacter were the dominant microorganisms in the air of 15-day-old cages. The dominant microorganisms in the air of 30-day-old cages were Agrobacterium, Brevundimonas, and Lactococcus, in which the relative abundance of Lactococcus was significantly reduced. However, Agrobacterium and Brevundimonas showed a significant increase in relative abundance. In conclusion, the microbial community in the air of thick bedding feeding cages changed little over time, while the microbial community in the air of cage feeding and net flat feeding changed significantly, which was easy to change by air circulation.
Fig. 2.
Relative abundance of environmental microorganisms at phylum (a) and genus (b) levels in different cages during different periods.
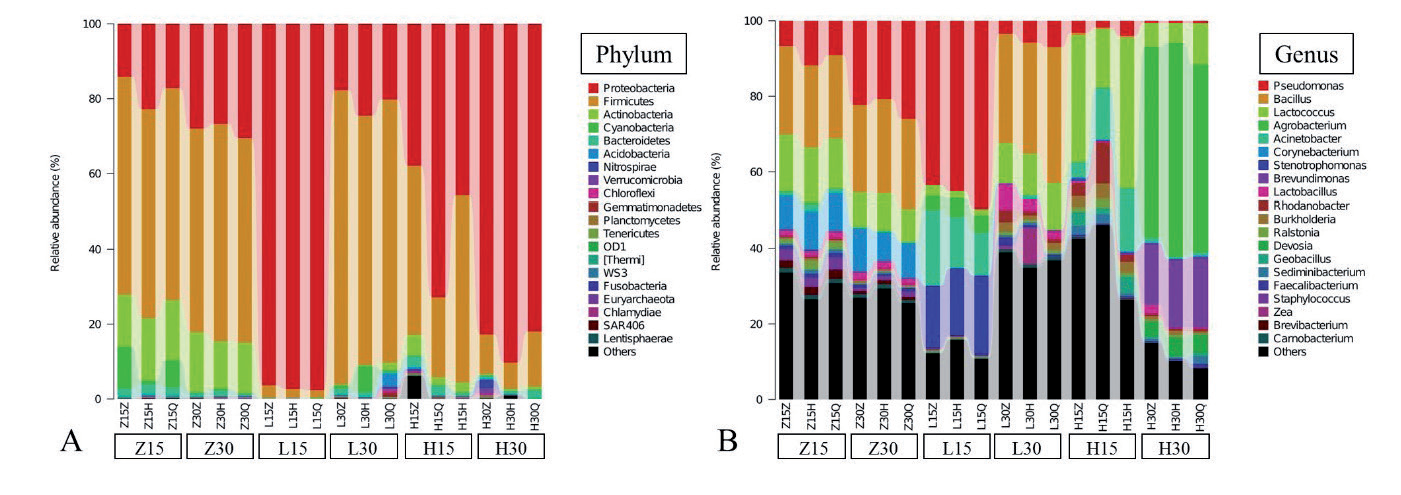
Table 3.
Characteristics of potentially pathogenic microorganisms in the air of sheepfold.
In addition, animal pathogens with higher abundance in the air samples of the chicken coop under different rearing methods were sorted, and the results are shown in Table 3. Twelve kinds of animal pathogens were detected in 18 air samples collected under the three feeding methods, including Bacillus, Pseudomonas, Corynebacterium, Lactococcus, Burkholderia, Acinetobacter, Streptococcus, Brevundimonas, Flavobacterium, Clostridium, Trichomonas, and Clostridium. Eight other animal pathogens were only partially validated in air samples. Among them, the content of Staphylococcus was higher in the thick bedding material. However, Streptococcus, Flavobacterium, Clostridium, and Rhodococcus were higher in cage air with net flat feeding (H) compared to the other groups.
Beta Diversity Analysis
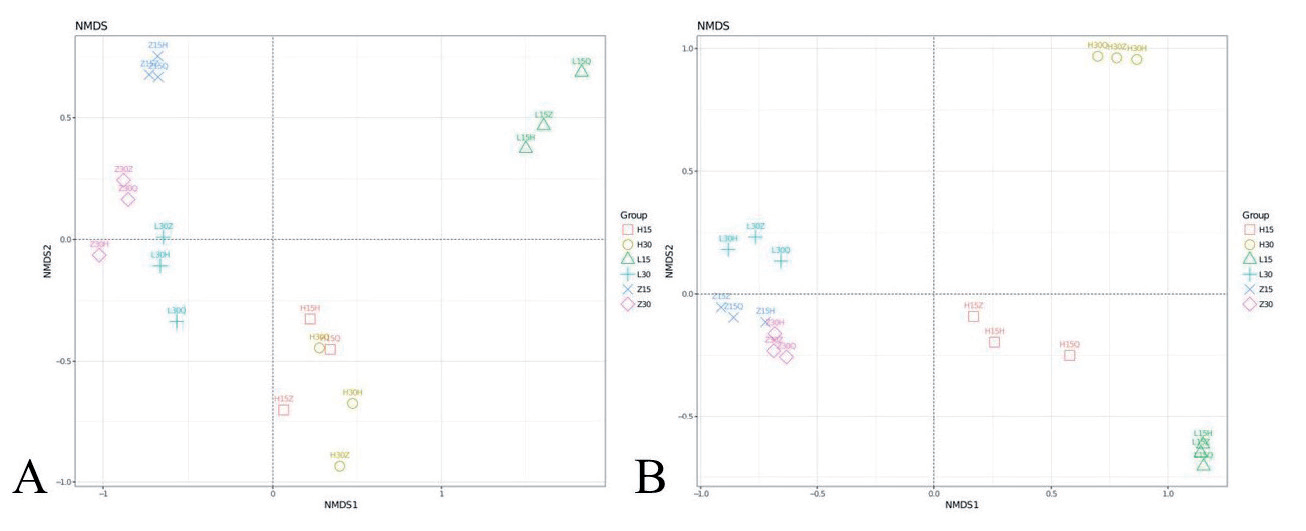
Beta diversity analysis was conducted to compare the similarity of community structures among different samples. UniFrac, a method that considers phylogenetic information, was employed to assess differences in species communities between samples. The estimation results provided a measure of beta diversity. UniFrac takes into account the evolutionary distance between species, and thus, the magnitude of the indicator is positively correlated with the extent of dissimilarity between samples. Based on the species distribution, unweighted UniFrac distances (considering only species rank differences) and weighted UniFrac distances (considering both species rank and abundance differences) were calculated. Principal Coordinate Analysis (PCoA) was then performed on the resulting distance matrix between samples. The outcomes are presented in Fig. 3. The samples within each group exhibited a significant level of clustering, indicating that the microbial community structure within each group was similar and displayed good reproducibility. Additionally, there were noticeable differences observed between the L15 and L30 samples, suggesting that the cage feeding model led to substantial changes in microorganisms at different stages. This finding aligns with the results obtained from the Alpha diversity analysis.
Analysis of Bacterial Community Structure Differences
To further explore the differential microorganisms in air samples from different cages, a heat map was constructed by phylogenetic tree and sample clustering based on the top 50 bacterial genera with relative abundance, and the results are shown in Fig. 4. The results showed that at the genus level, there were significant differences in airborne microorganisms in cages among the three rearing practices. These results indicated that the composition of the microbial community structure was related to feeding methods and feeding time.
Analysis of the Microbial Interaction Network
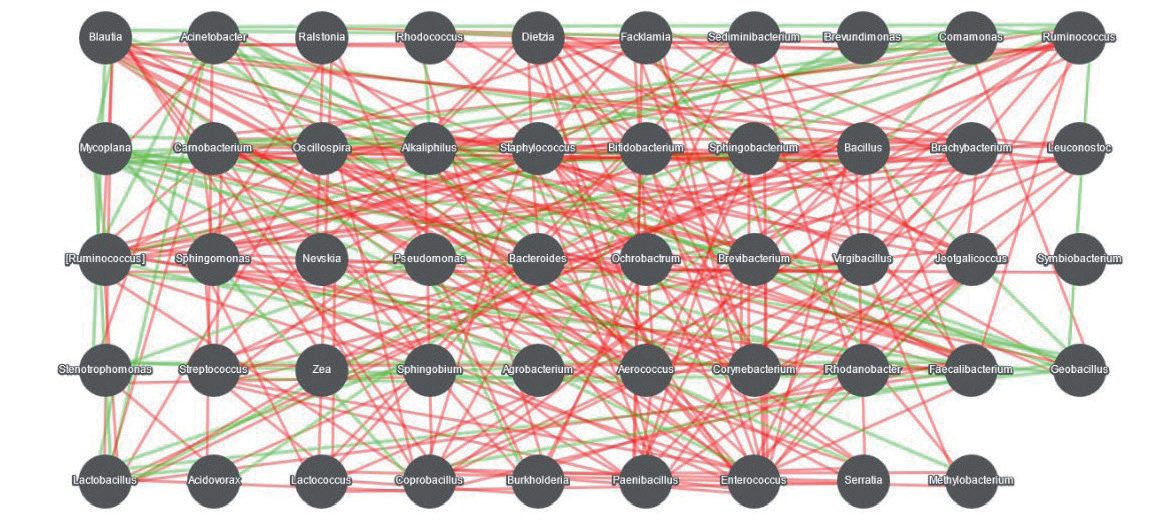
Calculate the advantage of relative abundance is located in the top 50 Spearman rank correlation coefficient between microbial species, of which | R |>0.6 and P<0.01 of the relevant dominant genus to construct the interaction network, and the results are shown in Fig. 5. There are complex interactions between microorganisms.
The modern animal-intensive farming mode includes high breeding density, closed or semi-closed management in the house, poor air mobility, high moisture in the house, low direct sunlight area, and robust conditions for the survival and reproduction of microorganisms [21]. Many microorganisms are present in the animal body and are discharged into the air simultaneously through the body surface, respiration, sneezing, and excretion, and the animal excrement, litter, and feed accumulated in the culture environment are relatively high [3, 4]. The study on microorganisms demonstrated that the air in the animal house contains various pathogens (such as Staphylococcus, Streptococcus, Salmonella, Escherichia coli, and other pathogenic bacteria and avian influenza, chicken Newcastle disease, and other viruses) that cause respiratory diseases in livestock and poultry through physical and external factors that enter the air and adhere to the surface of fine particles of dust to form a microbial aerosol. The pathogenic microorganisms in the air can enter the body of the livestock through the respiratory tract, causing respiratory diseases. Previous studies have shown that the pathogens of many malignant infectious diseases of livestock and poultry can be transmitted by air as a medium [22, 23]. When the quantity is sufficient to cause the disease or the resistance of the animal body decreases, the animal can be infected; also, the disease can be transmitted from the house to the outside by gas exchange and scaled up, causing microbial contamination and disease prevalence [16].
Fig. 4.
Genus-level community composition heatmap combined with cluster analysis. In the fig., red represents the genus with higher abundance in the corresponding sample and green represents the genus with lower abundance.
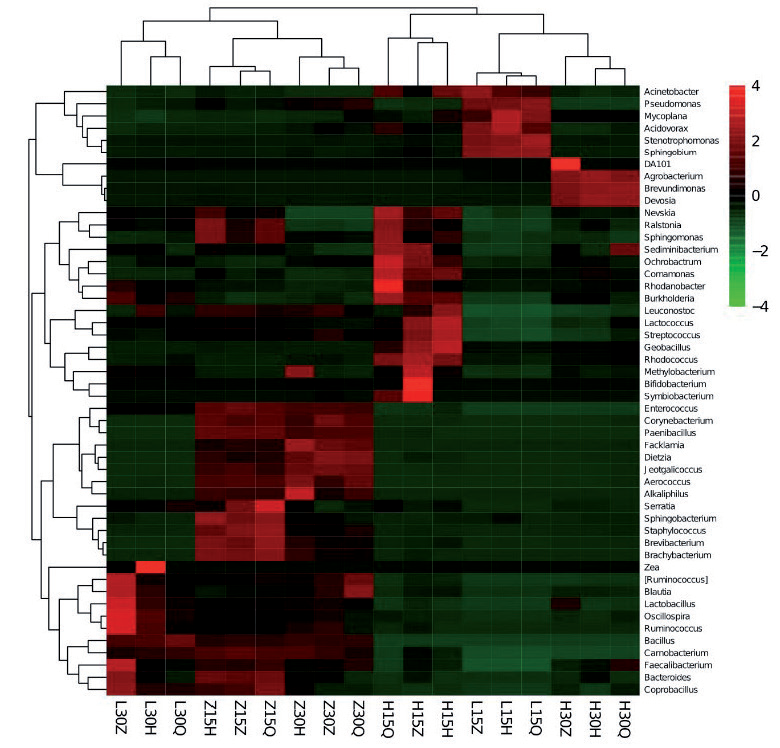
Fig. 5.
Diagram of the interaction network of microorganisms at the genus level. Note: Nodes represent each dominant genus and are identified by different colors; connections between nodes indicate a correlation between the two genera, with red lines indicating a positive correlation and green lines indicating a negative correlation. The more connections through a node, the more associations the genus has with other members of the flora.
Presently, the broiler feeding mode ensues thick padding, online Pingyang, and cage. With the standardization and large-scale development of aquaculture, the cage model has an increasing number of applications due to the significant advantages of saving land resources, facilitating intelligent mechanized operation, and the high feed conversion ratio. The investigators monitored the environmental indicators of broilers under different feeding modes and analyzed production performance. Consequently, the air quality of the poultry house was found to be satisfactory in the cage mode, and this study showed relatively few potential animal pathogens in the cage mode. The quality of the poultry house air severely restricted the healthy growth of broilers, and hence, the production performance of broilers in cage mode was high [23].
In recent years, molecular biology techniques based on bacterial 16S rRNA have been favored in the identification of strains of various diseases due to the advantages of rapidness, sensitivity, and accuracy. The 16S rRNA is a gene sequence corresponding to the 16S rRNA in prokaryotic ribosomes, which although conserved across evolution has some variability. The basic principle of such molecular biotechnology is to design universal primers in conserved regions and use the variations in the differential region to identify the strains [24]. Thus, the Illumina MiSeq sequencing technology was successfully employed to detect the diversity in the air bacterial community structure in chicken houses under different feeding modes by sequencing the P3-P4 hypervariable region of 16S rRNA, and a large amount of comprehensive and in-depth information on the flora was obtained.
By comparing with the RDP database, the dominant flora at the door level was Proteobacteria, Absidia, and Actinomycetes, of which Proteobacteria was highly abundant and Monocytogenes was maximal at the genus level [25, 26]. The bacteria in the ambient air of the chicken house are complex and numerous. Among the several pathogens designed in this experiment, several, such as Bacillus, showed robust pathogenicity [27]. Conditional pathogens, such as Streptococci, were also identified. With the rapid development of animal husbandry, the disease becomes complicated, and the damage caused by the conditional pathogens also increases. Thus, the prevention and control of good diseases is the key to ensuring the long-term development of the livestock industry.
Conclusions
In this study, Illumina MiSeq sequencing technology was used for the first time to comprehensively analyze the microbial diversity in the air of a chicken coop under different feeding methods. The results showed that Firmicutes and Proteobacteria were the dominant phyla in the air of the three chicken coops. Firmicutes accounted for a high proportion of the air of the chicken coops, and there were all potential pathogenic bacteria. Streptococcus, Ochrobactrum, Clostridium, and Rhodococcus were highly prevalent in net flat feeding. Therefore, to minimize the risk of diseases, it is advisable to avoid using net flat feeding as a reproduction method. In addition, regularly cleaning and disinfecting the coop, improving ventilation, and using antimicrobial agents/disinfectants with caution can reduce the presence of particles. This study can provide a scientific basis for guiding the prevention and control of diseases in chicken coops and provide a basis for disinfection and medication in chicken coops.

