

Introduction
The extensive production and use of plastic materials are always followed by an increase in the amount of plastic waste generation. Approximately 2.41 million tons of plastic waste enter the ocean annually, and this number is predicted to keep increasing in the future [1]. It is estimated that 80% of the plastic debris eventually ends up in the ocean [2]. Microplastics are defined as plastic particles smaller than 5 millimeters in size [3]. Due to their ultra-small size, microplastic particles can be found in nearly every environmental compartment. In addition, microplastic particles have a potential to accumulate in the environment since the particles are not easily reacted and degraded during transport in the environment [4, 5]. Microplastics can originate from primary sources, such as the micron-sized plastic beads added in cosmetics and medicine, and secondary sources, which refer to the microplastics particles resulted from the fragmentation of larger plastics (macroplastics) due to the complex physical, chemical, and biological processes in the environment [6]. The majority of microplastics that are present in the ocean are transported from the river system [7]. The amount of microplastics in the ocean is equivalent to the amount of microplastics in the freshwater environments.
Rivers, as vital conduits of water and sediment, play a crucial role in the transport and dispersal of microplastics from various sources to oceans and other water bodies. The presence of microplastics in rivers has raised alarms due to their potential ecological consequences. Microplastics have been found to permeate throughout the water column and accumulate in the sediments. In rivers, microplastics can interact with various aquatic organisms and can further affect their health and ecosystem functions. In addition, microplastics can be transferred to the food chain. Therefore, the study of microplastic sources, distribution, and fate in rivers has become an interesting topic of research interest.
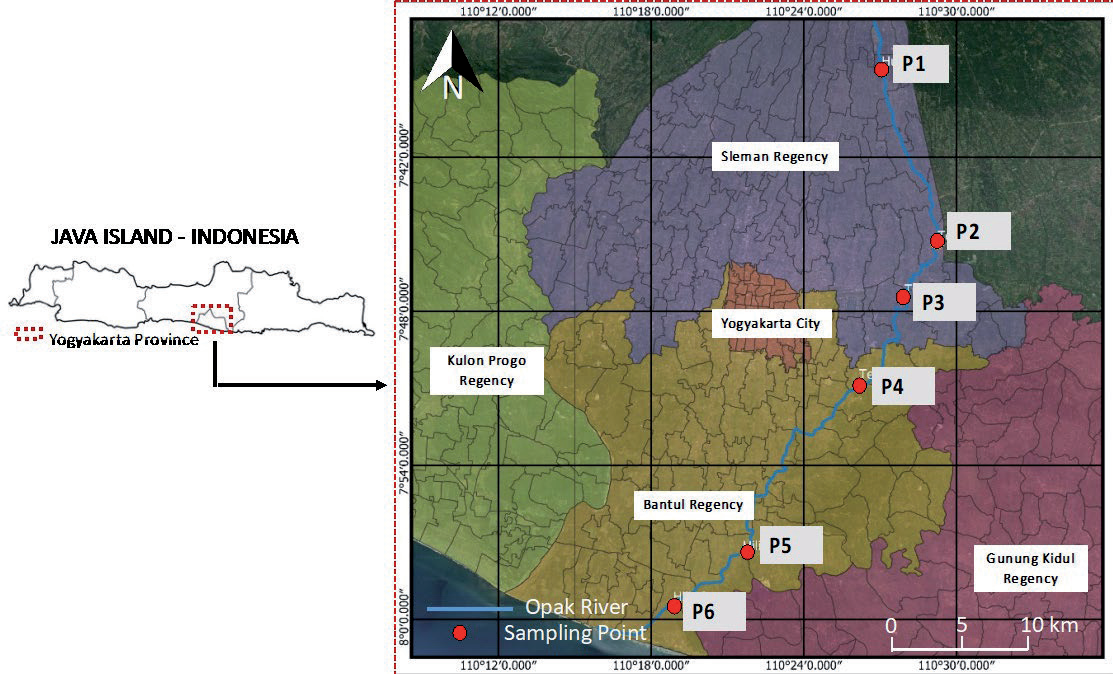
Some studies on microplastic occurrence in rivers and sediments in Indonesia have been reported, such as in the water and sediment of the Surakarta City river basin [8], in the midstream of the Citarum River [9], water and sediments of the Ciliwung River [10], in the sediments of East Surabaya [11], and on river sediments in Medan City [12]. The studies show that microplastics are ubiquitous in river and sediment systems. One of the rivers in Indonesia that has not been studied for its microplastics is the Opak River. This river is situated in Yogyakarta and has a flow length of about 65 km. The Opak River’s upstream is situated in Sleman Regency, on the slopes of Mount Merapi. The downstream part of the river flows to the south into the Indian Ocean near Bantul Regency. There are various types of human activities in the river basin area of the Opak River that can become the source of pollutants entering the Opak River, including microplastics. This study investigates the distribution of microplastics in surface water and sediments in the Opak River. Microplastics were characterized by abundance, shape, and color using a microscope, and the polymer types of microplastics were analyzed using Fourier-transform Infrared Spectroscopy. The purpose of this research is to contribute to the advancement of knowledge in the identification of microplastics in river environments.
Material and Methods
Study Area and Sampling Methods
The Opak River is located in Yogyakarta, Indonesia. The sampling points in Fig. 1 and Table 1 were selected based on the accessibility and the possibility of entry channels for microplastics. Sampling point P1 represented the upstream, sampling points P2, P3, and P4 represented the middle stream, and sampling points P5 and P6 represented the downstream of the Opak River.
Water and sediment samples were collected in May 2023. The pH of the water varied between 6 and 7. Surface water samples were collected using a plankton net (200-mesh size) with a dimension of 100 cm x 50 cm. Twenty liters of the river water were filtered on-site by the net, and the water volume was reduced to 350 mL in an amber bottle. The sediment samples were collected using a grab sampling method and were placed in a sealed bag. The water and sediment samples were kept at 4ºC prior to the analysis.
Sample Preparation and Microplastic Identification
Organic matters in the water sample were removed by oxidation using the mixture of 0.05 M Fe(II) and 30% H2O2 solution (Sigma Aldrich, Germany) at 70ºC. The density separation was then carried out using a saturated NaCl solution (Sigma Aldrich, Germany). The saturated NaCl solution was prepared by dissolving 50 g of NaCl into 100 mL of distilled water. The mixture was allowed to settle for 24 h. The supernatant was filtered using Whatmann Microfiber Filter GF/B.
The sediment samples were oven-dried at 75ºC for 24 h. After the drying, the dried sediments were sieved using a 5-mesh sieve to remove the macroparticles. The density separation was conducted using a saturated NaCl solution; after the mixing, the mixture was allowed to settle for 24 h. The degradation of organic matter was conducted by adding 30% H2O2 and a 0.05 M Fe(II) catalyst at 70ºC. The solution was filtered using Whatmann Microfiber Filter GF/B. The filtered microplastics on the filter paper were analyzed using a microscope (Olympus BX53 Trinocular) and Attenuated Total Reflection-Fourier Transform Infrared Spectroscopy (ATR-FTIR; Shimadzu, IRTracer-100).
The cross-contamination of microplastics from other sources during sample preparation and analysis was highly avoided. The solutions used in preparing the sample were filtered, and all experimental equipment was rinsed with Milli-Q water and covered with aluminum foil prior to use. The use of plastic equipment was avoided as much as possible. After the filtration of the solution containing the extracted microplastics, the filter paper was kept in a glass Petri dish.
Data Analysis
The abundance of microplastics in surface water samples was calculated by dividing the number of microplastics obtained from the observation using the microscope by the total volume of the water sample (unit in particles/L). The abundance of microplastics in sediment samples was calculated by dividing the number of microplastics obtained from the observation using the microscope by the dry weight of the sediment sample (unit in particles/kg). The microplastics were identified based on their shapes (fragment, fiber, film, foam, pellet) and their colors.
Results and Discussion
Abundance and Distribution of Microplastics
Microplastic particles were detected in both the water and sediment samples collected from the Opak River. The abundance of microplastics in water and sediments of the Opak River is shown in Fig. 2. The microplastics found in the surface water in this study varied from 4.15 to 12.3 particles/L. The abundance of microplastics in sediment samples varied from 960 to 3080 particles/kg of dry sediment. These values are relatively high compared to other reported values of microplastic abundance in rivers and sediments, as shown in Table 2.
The abundance of microplastics in the Opak River is higher in the downstream areas (P5 and P6). Downstream regions often have a higher density of human activities, which increases the runoff from urban and industrial areas that can carry microplastics into the river, contributing to higher concentrations downstream. Near the sampling point P5, there is a tourist village and a camping area, which are often visited by many visitors. The water in P5 represented the river, which has passed through housing, restaurants, rice fields, tourist destinations, and the Piyungan landfill. Rivers may accumulate various types of debris, including microplastics, from their surroundings during the downstream flow. In addition, the larger plastic items will fragment into smaller microplastic particles due to physical weathering and UV degradation over time. These smaller particles are more easily transported by the river’s flow and can accumulate in the downstream regions.
For the sediments, the abundance of microplastics is higher in the middle stream regions (P2). The high abundance of microplastics in this region may originate from the localized sources near the headwaters of the river, such as the agricultural area that can release microplastics into the environment and subsequently accumulate in the river sediments. Plastics are widely used in agricultural practices, such as in the form of mulch films, bags and sacks for fertilizers and seeds, bottles, plant protectors, nets, and others. Mulch film accounts for up to 50% of the total plastic materials used in agricultural activities [18].
Shape and Color of Microplastics
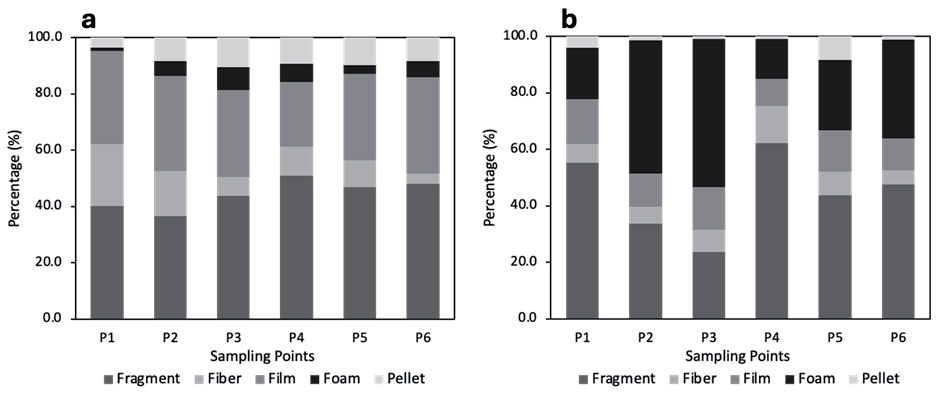
Identification of the shape of microplastics is important for us to identify the source of microplastics and to understand the possible fate and transport of the microplastic particles. The shape of microplastics significantly influences their behavior and distribution throughout various environmental compartments. In addition, it has been documented that particular shapes of microplastics are selectively consumed by various aquatic organisms [19]. This implies that the shape of microplastics has great implications for their bioavailability to aquatic organisms. In this study, microplastic particles such as fragments, fiber, film, foam, and pellets are found in water and sediments of the river (Fig. 3). In water, microplastics are dominant as fragments and film shapes, while in the sediment, they are dominant as fragments and foams. The dominance of fragment microplastics in water and sediments of the Opak River suggested that the microplastic particles found in this study resulted from the degradation of larger plastics (macroplastics). The fiber microplastics found in Opak River could be generated from the effluent of synthetic textile washing of the residents living near Opak River [20, 21]. Foamed microplastics usually come from single-use Styrofoam containers. Some shapes of microplastics in this study are shown in Fig. 4.
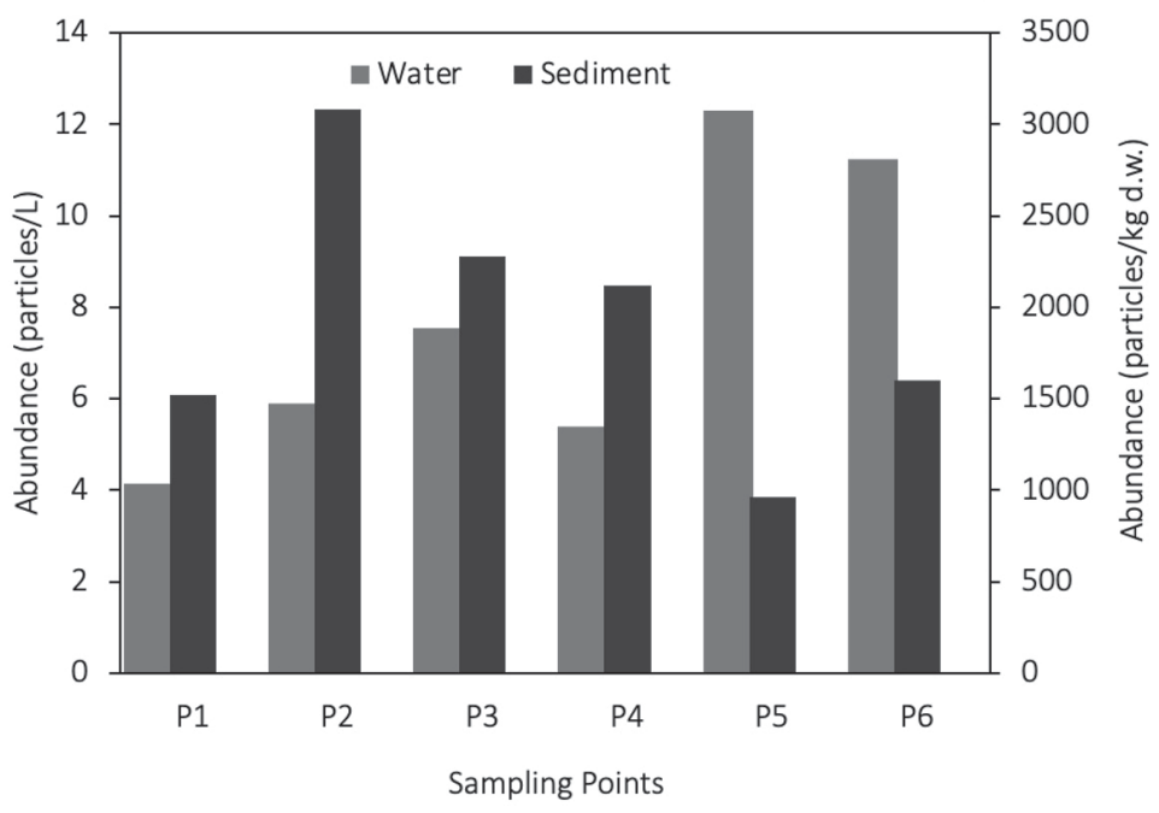
Table 2.
Abundance of microplastics in various river water and sediments.
Aquatic biota are known to eat microplastics that are similar in color to their natural diet; thus, the prevalence of colored microplastics in this study is of significant concern [22]. The issue with colored microplastics is not just their preferential ingestion by aquatic life, but also the toxicity of the coloring agents, such as pigments and dyes [23]. This implies that aquatic organisms may be exposed to a range of hazardous compounds linked to microplastics. In this study, microplastic particles are found in black, brown, transparent, red, green, and yellow colors (Fig. 5). In the Opak River’s sediment, the dominant color of microplastics found in all sampling points is black, while in the water, microplastics are mostly found in black and transparent colors. The dominant black microplastic particles can originate from the black plastic products such as plastic bags and mulch film that are widely used in Indonesia, including Yogyakarta.
Identification of Polymer Type
A qualitative analysis was conducted using an FTIR instrument to investigate the types of polymers found in microplastics in this study. Each type of polymer will have specific impacts on the organisms that ingest and/or accumulate the microplastics. Some types of polymers and their FTIR absorption peaks found in the Opak River are listed in Table 3.
Fig. 4.
Some microplastics found in the Opak River (a)pellet, (b) fragment, (c) fiber, (d) film, and (e) foam.
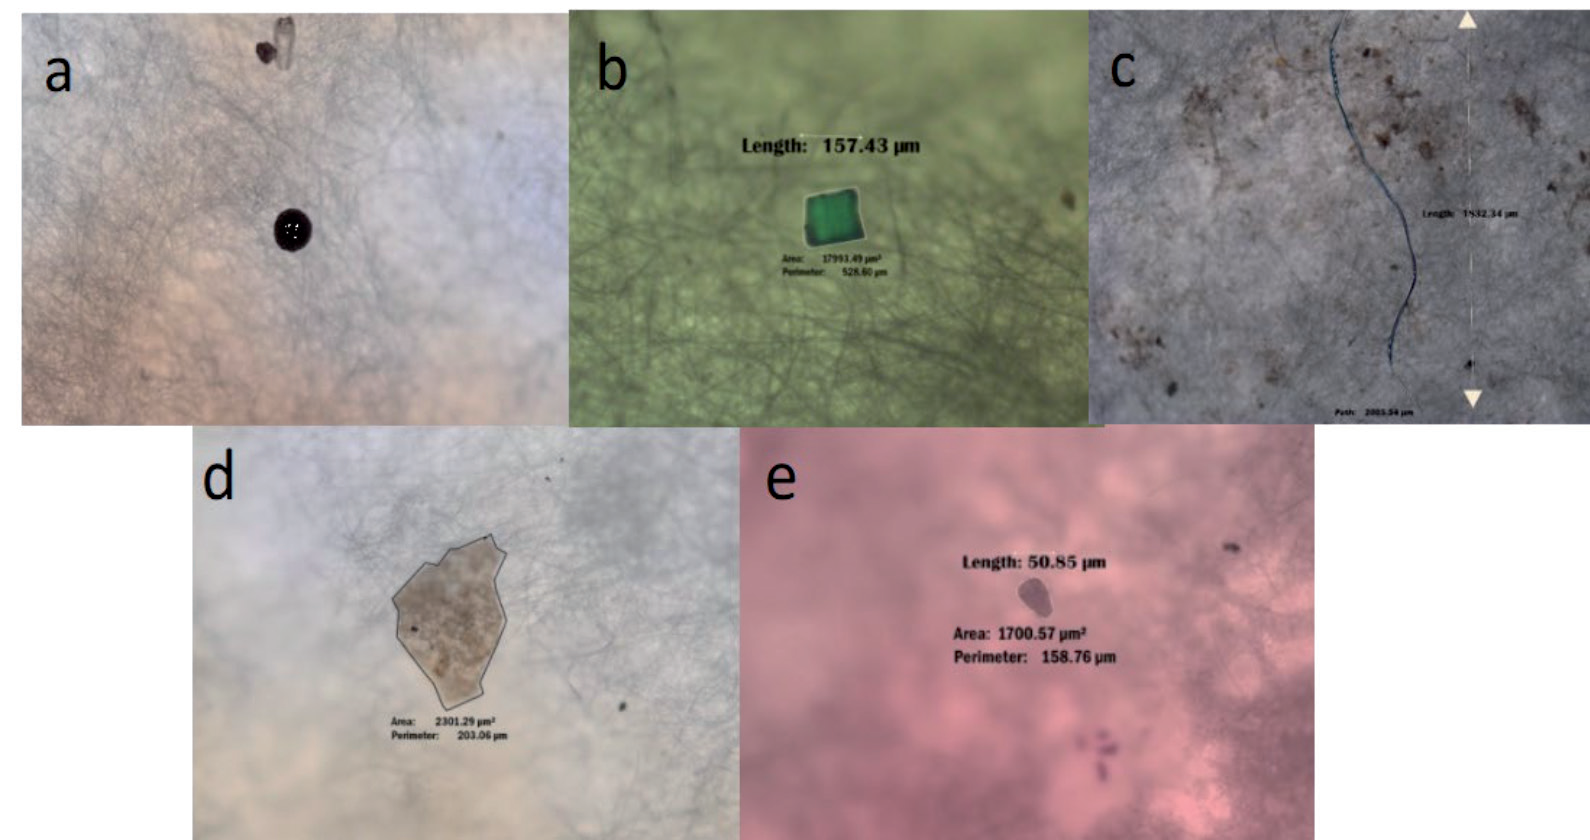
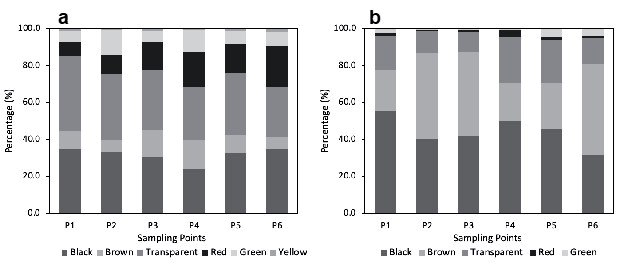
Table 3.
FTIR absorption peaks for various types of microplastic polymers in Opak River.
The microplastic polymers extracted in this study were only those that could be extracted using NaCl solution, which means that the polymers had a density lower than 1.2 g/mL [24]. The higher density polymer could be extracted using other high-density salts, such as CaCl2 and ZnCl2. Therefore, it is believed that there are many other types of microplastic polymers that exist in the Opak River water and sediment that were not detected in this study.
Conclusions
The present study examined the level of abundance and distribution of microplastics in both water and sediment samples collected from the Opak River in Yogyakarta, Indonesia. The extraction of microplastics from water and sediments involves digestion using H2O2 with an iron catalyst, density separation using NaCl, and filtration. It was found that the amount of microplastics in the Opak River’s water ranged from 4.15 to 12.3 particles/L, while the microplastics in the sediments ranged from 960 to 3080 particles/kg dry sediment. The microplastic particles in the Opak River were found as pellets, fragments, fiber, foam, and film, with fragments as the dominant type. The color of the microplastics was dominated by black and other colors of microplastics found in this study are brown, transparent, red, green, and yellow. The polymer analysis using FTIR showed that the microplastic polymers in Opak River include polystyrene, high density polyethylene (HDPE), polycarbonate, and nylon. The result of this study indicated the first evidence of microplastic pollution in the Opak River.

