

Introduction
Organophosphate esters (OPEs) are emerging persistent organic pollutants with various types of toxicity [1], and are classified into three categories: halogenated OPEs, alkyl OPEs, and aromatic OPEs. OPEs, also known as organophosphorus flame retardants, have been used as substitutes for brominated flame retardants for decades worldwide [2]. Compared to traditional flame retardants, OPEs can also be used as plasticizers and defoamers, making their use more widespread and their sales higher than traditional flame retardants [3]. In Europe, the demand for OPEs in 2006 was 93,000 tons, accounting for 20% of the annual consumption of flame retardants [4]. It is reported that the annual production volume of OPEs was estimated at 598,422 metric tons in China in 2020 [5]. Due to their characteristics, OPEs can be released into the environment throughout their life cycle, including production, use, transportation, recycling, and disposal [6]. OPEs have been found in various environmental matrices worldwide, such as air [7], water [8], and sediment [9].
OPEs were widely detected in surface water and the concentration varied greatly. The concentration of OPEs was at the ng/L-μg/L level in surface water [10], which was much lower than the lethal concentration of 50% of OPEs (mg/L level) [11, 12]. However, tris(1-chloro-2-propyl) phosphate (TCIPP) and tris(2- chloroethyl) phosphate (TCEP) have potential risks of bioaccumulation [13]. The bioaccumulation of OPEs may magnify their toxicity to biota.
OPEs in source water have negative effects on both human health and the environment. OPEs have the potential to pose a threat to human health through multiple exposure pathways, including dietary intake, skin exposure, ingestion of dust, and inhalation [8, 14, 15]. Conventional drinking water treatment plants have limited capacity to remove OPEs, especially chlorinated OPEs [16, 17]. Also, OPEs were detected in tap water in many studies [18-20]. As source water is the source of drinking water, OPEs in source water may be ingested by humans and pose a threat to human health. In addition, OPEs have potential toxicity to organisms. TCEP and tri-n-butyl phosphate (TNBP) could reduce cell viability, increase cell apoptosis, and change the cell morphology of PC12, which indicated that TCEP and TNBP had possibilities of cytotoxicity and neurotoxicity [21, 22]. Triphenyl phosphate (TPHP) at μg/L level could downregulate regulatory feedback genes in the zebrafish [23]. It is necessary to evaluate the health and environmental risks of OPEs.
This study investigated the occurrence and evaluated the health and ecological impact of 14 OPEs in source water in South China. Specifically, the objectives of this study were to (1) investigate the occurrence of OPEs in source water in South China; (2) assess the health risk of OPEs to humans; and (3) assess the ecological environmental risk of OPEs to aquatic biota.
Experimental
Chemicals
The standards of 14 OPEs were all purchased from AccuStandard Inc. (New Haven, CT, USA). Organic solvents including dichloromethane and acetonitrile were all of chromatography grade. Ultrapure water (Milli-Q, MA, USA) was used for all solution preparation and vessel cleaning in this study.
Study Area and Sampling
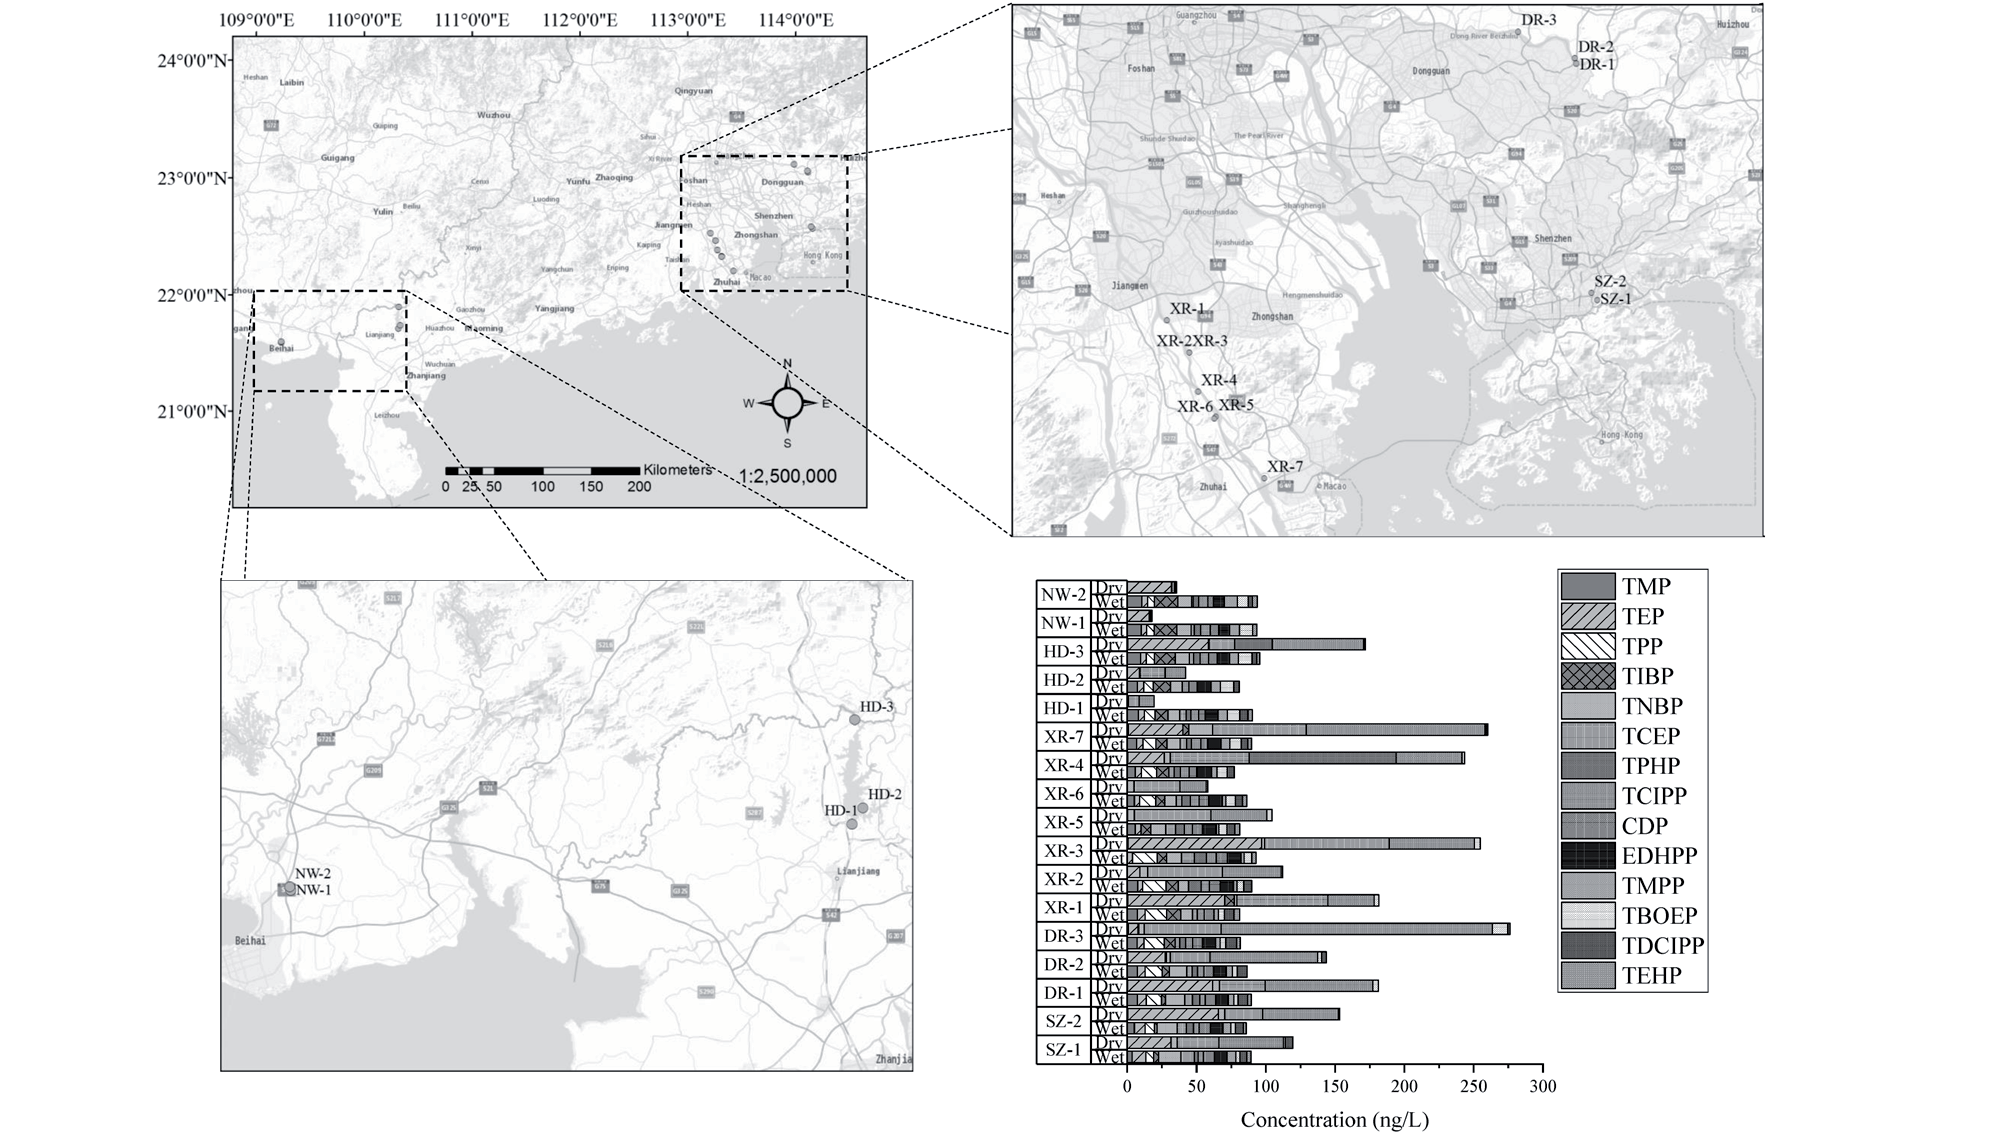
This study selected the southern region of China as the research site, encompassing three reservoir water sources (Hedi, Shenzhen, and Niuweiling), and two river water sources (Xi River and Dong River) (Fig. 1). A total of 34 samples were collected, including 4 from Shenzhen reservoir (SZ-1 to SZ-2), 6 from Hedi reservoir (HD-1 to HD-3), 4 from Niuweiling reservoir (NW-1 and NW-2), 6 from the north branch of Dong River (DR-1 to DR-3), and 14 from the lower reaches of Xi River. (XR-1 to XR-7). The samples were collected in March and August 2023, which represented the dry and wet seasons, respectively. Water samples (50 cm depth) were collected using an organic glass water sampler, stored in brown glass bottles at 4ºC, and preprocessed within 72 hours.
Chemical Analyses
The water samples were filtrated with 0.7 μm glass fiber filters (Whatman, GF/F). The filtrated samples (500 mL each) were spiked with 5 ng surrogate (TPP-d21, TNBP-d27, TCIPP-d18, and TPHP-d15) and processed by solid-phase extraction (SPE). The ENVI-18 cartridges (6 mL, 500 mg, Supelclean) were conditioned with sequential elution of dichloromethane (5 mL), acetonitrile (5 mL), and Milli-Q water (10 mL). The samples were passed through the cartridges at a flow rate of 1 mL/min. The cartridges were dried under high-purity nitrogen. The analytes were subsequently eluted with 8 mL of dichloromethane/acetonitrile (25:75, v/v). The extracts were evaporated by nitrogen at 40ºC to nearly dry and diluted to 1.0 mL with acetonitrile. Extracts were filtered with 0.22 µm membrane prior to analysis by liquid chromatography.
The concentrations of OPEs in samples were analyzed by an ultra-high performance liquid chromatography tandem mass spectrometry system (Xevo TQ-S micro IVD system, Waters, Manchester, UK) according to the method previously described with slight modification [24]. Briefly, all analytes were separated on a Waters BEH C18 column (2.1 mm × 50 mm, 1.7 μm particle size, Milford, MA). The flow rate was 0.4 mL/min, and the column temperature was set at 40ºC. The source temperature was set at 150ºC and the ionization mode was positive. The analytes were quantified in the multiple reaction monitoring (MRM) mode.
Statistical Analysis
The Wilcoxon signed-rank test was performed using IBM SPSS 22 to evaluate the disparity in organophosphate esters across different seasons and water source types.
Quality Assurance and Quality Control
The experimental process followed strict quality assurance and quality control procedures. Quantification using internal standards was the approach to determine the concentration of compounds. The calibration curves (0.01~500 µg/L) for organophosphate esters exhibited good linear relationships (R2 ≥ 0.995). The recoveries of the organophosphate esters from the water samples ranged from 88.68 to 109.56 %. The limit of detection (LOD) ranged from 0.0101 to 2.7192 ng/L while the limit of quantification (LOQ) ranged from 0.0176 to 7.6451 ng/L.
Human Health Risk Assessment
The potential risk to human health arising from OPEs through water consumption was evaluated by considering the average daily intake (ADI) of OPEs through drinking, along with the reference dose (RfD) and cancer slope factor (CSF) [25, 26]. The ADI of a specified OPE was calculated using Eq. (1).
where C is the detected concentration of a specified OPE, ng/L; IR is the water intake daily, L/d; EF is the exposure frequency, days/year; ED is the exposure duration, years; AT is the average lifespan, days; and BW is the body weight, kg.
The non-carcinogenic risk (NCR) of a specified OPE was calculated using Eq. (2).
where RfD is the reference dose value of a specified OPE, mg/(kg bw·day). When the value of NCR exceeds 1, it is deemed that there is a non-cancer risk. [16, 25].
The carcinogenic risk (CR) for a specified OPE was calculated using Eq. (3).
where CSF is the cancer slope factor of an OPE, 1/(mg/(kg·day)). A CR value less than 10-6 shows negligible cancer risk, whereas a CR value ranging from 10-6 to 10-4 suggests a potential cancer risk and a CR value over 10-4 indicates a high potential risk [25, 26].
Environmental Risk Assessment
The environmental risk of OPEs was evaluated using the risk quotient (RQ) that has been widely employed in aquatic environmental risk assessment [27, 28]. RQ was a ratio of the measured environmental concentration (MEC) and predicted no-effect concentrations (PNEC). If RQ is lower than 0.1, the risk is considered low. If RQ is higher than 0.1 and lower than 1, the risk is considered medium. If RQ is higher than 1, the risk is considered high [29]. RQ was calculated using Eq. (4) and Eq. (5).
where MEC is the measured environmental concentration; PNEC is the predicted no-effect concentration, generally estimated as a quotient of the toxicological relevant concentration (EC50 or LC50) and a safety factor (f) obtained from available literature [28].
Results and Discussion
Occurrence and Seasonal Difference of Organophosphate Esters in Source Water
All investigated OPEs were detected in source water in South China during the wet season while 10 of 14 investigated OPEs were detected during the dry season. During the wet season, the detection frequencies of triethyl phosphate (TEP), TCIPP, tricresyl phosphate (TMPP), and tributoxyethyl phosphate (TBOEP) were 100% while the detection frequencies of trimethyl phosphate (TMP), tripropyl phosphate (TPP), TNBP, TCEP, TPHP, 2-Ethylhexyl diphenyl phosphate (EDHPP), tris(1,3-dichloro-2-propyl) phosphate (TDCIPP), and tris(2-ethylhexyl) phosphate (TEHP) ranged from 82-94%. The detection frequencies of OPEs during the dry season followed the order: TNBP, TCEP, and TCIPP (100%) > TMP and TBOEP (88%) > TEP (82%) > tri-iso-butyl phosphate (TIBP) and TDCIPP (35%) > TPP (18%) > TPHP (12%), while cresydiphenyl phosphate (CDP), EDHPP, TMPP, and TEHP were not detected during the dry season. The higher detection frequencies of OPEs during the wet season, compared to the dry season, might be attributed to the increased rainfall during the wet season, which leads to a greater influx of OPEs from soils, roads, and wet deposition into surface water [8, 30]. Besides, the increase in human activities during the wet season (summer), especially in transportation, could result in the use and production of a wider range of OPEs [30]. This could contribute to the higher detection frequency of OPEs during the wet season. The detection frequencies of TPHP, CDP, EDHPP, TMPP, and TEHP were much higher during the wet season than during the dry season. This may be due to their high log Kow values (4.70-9.49), which cause most of these substances to attach to solid particles. Rainfall can transport them to source water along with solid particles, especially during the wet season.
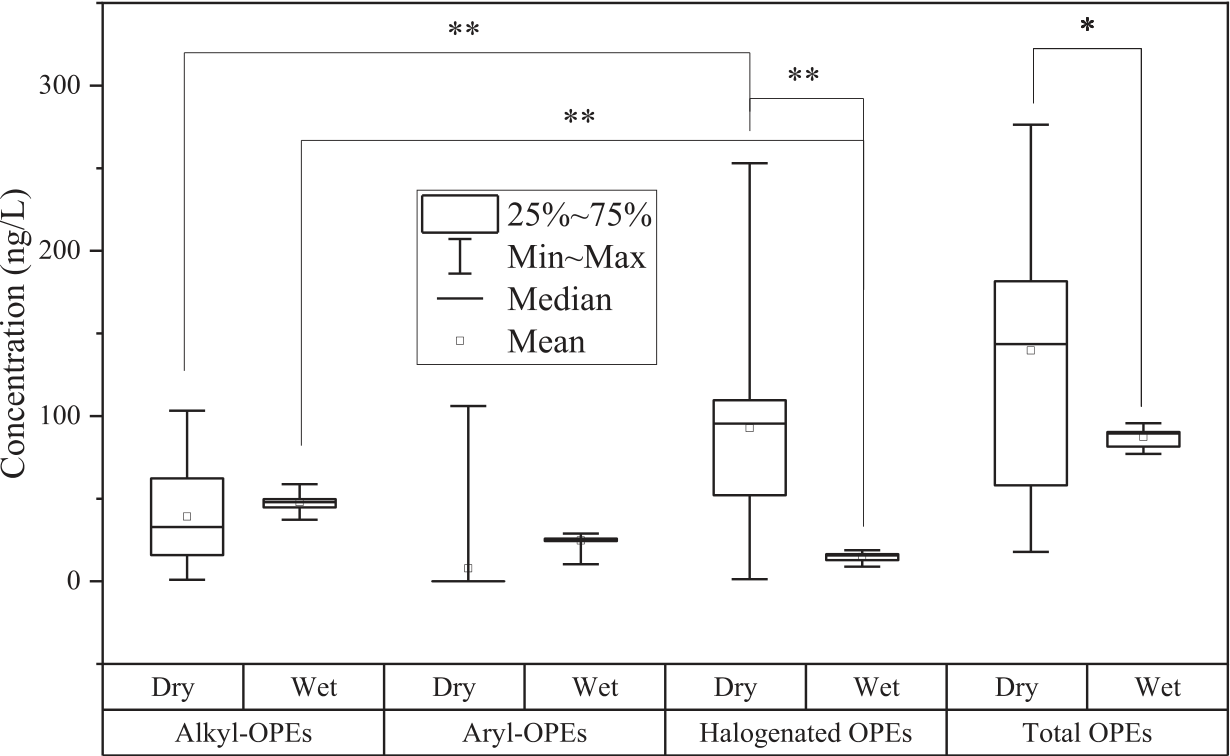
The median total concentration of OPEs was 89.4 ng/L (range 77.1-95.7 ng/L) during the wet season and 144 ng/L (range 17.8-276 ng/L) during the dry season (Fig. 2). The total concentration of OPEs was significantly lower during the wet season than during the dry season (p<0.05). The median total concentration of alkyl-OPEs was 47.9 ng/L (range 37.2-58.7 ng/L) during the wet season and 32.9 ng/L (range 0.928- 103 ng/L) during the dry season. However, there is no significant difference in the total concentrations of alkyl-OPEs between the wet and dry seasons (p>0.05). The median total concentration of halogenated OPEs was 15.7 ng/L (range 8.91-18.8 ng/L) during the wet season and 95.5 ng/L (range 1.33-253 ng/L) during the dry season. The total concentrations of halogenated OPEs were significantly higher during the dry season than during the wet season (p<0.01). The concentrations of alkyl-OPEs were higher than the concentrations of halogenated OPEs during the wet season (p<0.01), while the concentrations of alkyl-OPEs were lower than the concentrations of halogenated OPEs during the wet season (p<0.01). This may be because halogenated OPEs are more resistant to photodegradation than alkyl-OPEs [31].
The dominant OPEs of the 14 investigated OPEs in source water were TCIPP (median: 46.6 ng/L), TCEP (32.8 ng/L), and TEP (27.1 ng/L) during the dry season. The annual production volumes of TCIPP, TCEP, and TEP were reported as 44,681, 30,957, and 64,694 metric tons, respectively [5], which were relatively higher compared to the other 11 investigated OPEs. This may explain their dominance during the dry season. During the wet season, the median concentrations of OPEs in source water were relatively similar (2.61-10.1 ng/L). Factors such as high water flow, redissolution from sediment, and wet deposition affected the concentration of OPEs in source water during the wet season [8].
TCIPP, primarily used as a flame retardant and plasticizer [32], is frequently employed due to its cost-effectiveness and superior flame retardancy [33]. The poor removal of TCIPP observed in wastewater treatment plants, as reported in previous studies [34, 35], could be a contributing factor to its high concentration. The European Union banned the production of TCEP in 2011 due to its high toxicity [36], leading to its replacement by TCIPP. The significant levels of TCEP and TCIPP detected in this study underscore their extensive usage in China and the pressing need for innovative eco-friendly alternatives.
The maximum concentrations of OPEs detected in the source water of this study were found to be at the medium level when compared to the concentrations observed in surface water worldwide (Table 1). The maximum concentration of TCIPP observed in this study (196 ng/L) was higher than that in Taihu Lake (10.29 ng/L) [37], Bohai Sea (93 ng/L) [38], and Henan (66.4 ng/L) [39], similar to that in Pearl River (215 ng/L) [33], River Elbe (250 ng/L) [40], River Rhine (160 ng/L) [40], and Rhône River (173.1 ng/L) [41], but lower than that in Jiaozhou Bay (835.27 ng/L) [42] and Lake Shihwa (5102 ng/L) [43]. The maximum concentration of TCEP observed in this study (89.9 ng/L) was higher than that in Taihu Lake (27.83 ng/L) [37], Hanshui River (16.4 ng/L) [18], Yangtze River (11.2 ng/L) [18], River Elbe (20 ng/L) [40], River Rhine (25 ng/L) [40], and Rhône River (25 ng/L) [41], comparable to that in Pearl River (102 ng/L) [33], but lower than that in Jiaozhou Bay (691.18 ng/L) [42] and Bohai Sea (1721.3 ng/L) [38] and Shihwa Lake (5963 ng/L) [43].
Comparison Between the River and Reservoir Source Water
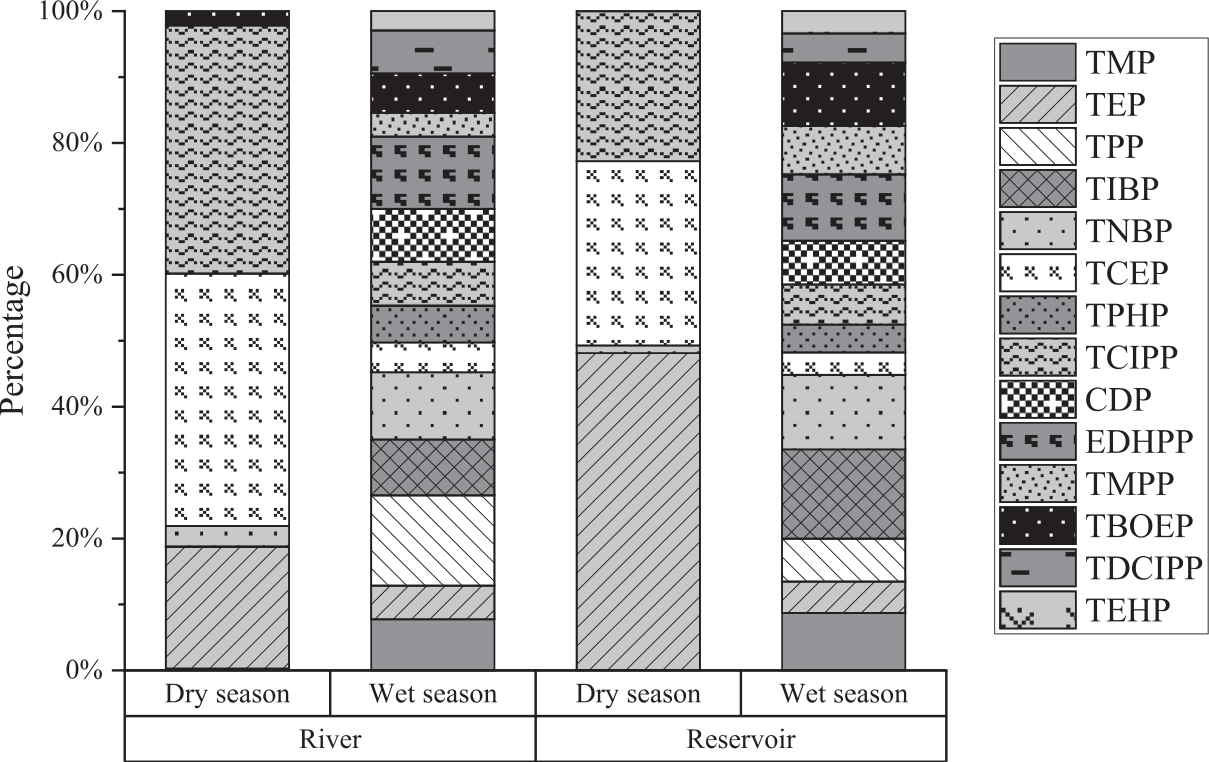
The median total concentration of OPEs in the river source water (86.4 ng/L) was similar to that in the reservoir source water (90.3 ng/L) during the wet season. During the dry season, the median total concentration of OPEs was generally lower in the river source water (42.1 ng/L) than in the reservoir source water (181 ng/L). However, there was no significant difference in the concentration of OPEs between the river and reservoir source water during the dry season (p>0.05). The profile of OPEs in the river source water was similar to that in the reservoir source water (Fig. 3), suggesting that the pollution source of OPEs was similar in both the river and reservoir source water. However, the OPE profile in both the river and reservoir source water differed between the wet and dry seasons. TCIPP, TCEP and TEP were the dominant OPEs during the dry season, while there was no OPE monomer that had a particularly high proportion during the wet season. These results suggested that the effects of OPE pollution in South China on the river and reservoir source water were similar.
Human Health Impact of Organophosphate Esters in Source Water
OPEs have been found to impose various health hazards on organisms, such as reproductive and developmental toxicity [44], cardiac developmental toxicity [45], brain developmental toxicity and neurotoxicity [46], bone developmental toxicity [47], endocrine toxicity [48], and metabolic toxicity [48]. Since drinking water treatment cannot fully eliminate OPEs in source water [49], this study evaluated the health risks of OPEs in the source water to humans. The ingestion of OPEs through drinking water was a direct exposure to the OPE pathway for humans [17, 50]. Considering that water sources are typically protected and rarely have direct human contact, only oral ingestion has been considered as the exposure route in this study.
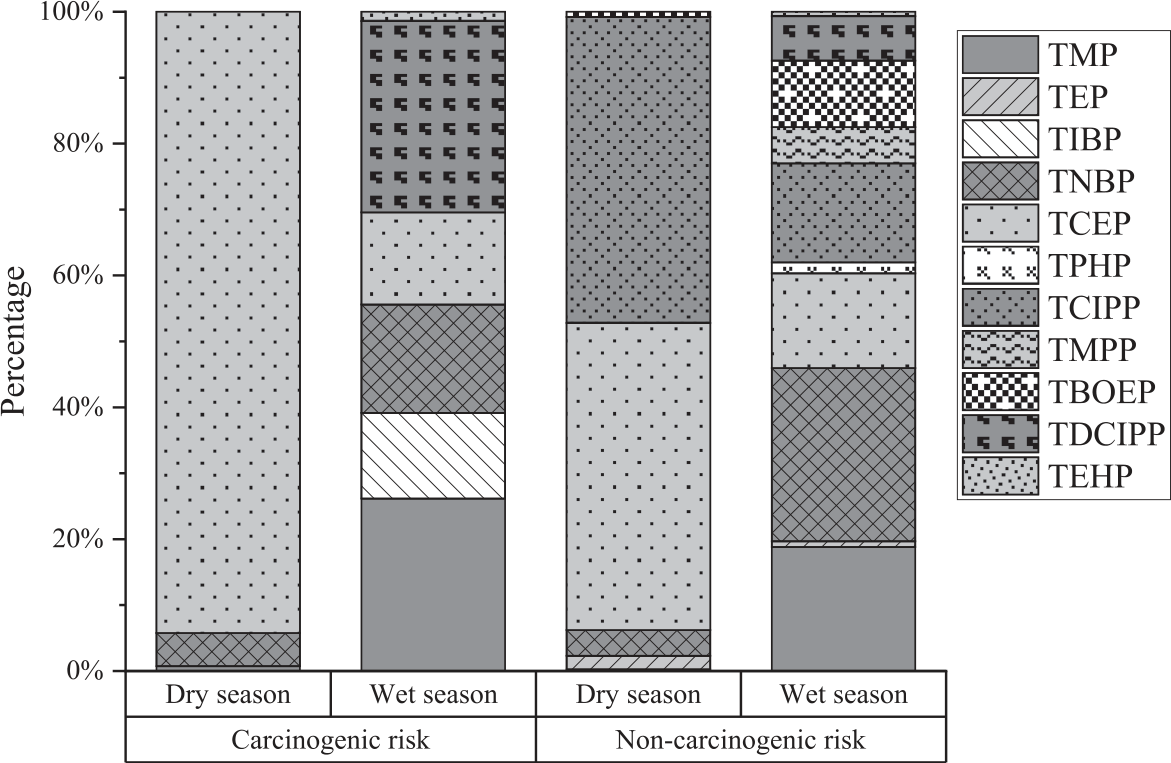
The total NCR of 10 OPEs with available RfDs ranged from 3.99×10⁻⁶ to 3.21×10⁻⁴ for male consumers and 3.54×10⁻⁶ to 2.86×10⁻⁴ for female consumers, suggesting negligible non-carcinogenic risks of OPEs to humans (NCR<1). The median total NCR of OPEs for male consumers was lower during the wet season (4.60×10⁻⁵) than during the dry season (1.41×10⁻⁴). A similar was found in female consumers (4.09×10- 5 vs. 1.25×10⁻⁴). The results suggested that the non-carcinogenic risk of OPEs in source water was lower during the wet season than during the dry season. The dominant contributors to NCR were TCEP and TCIPP during the dry season, accounting for a median of 37%, while the dominant contributor to NCR was TNBP during the wet season, accounting for a median of 24% (Fig. 4).
The total CR of 6 OPEs with available CSFs ranged from 2.25×10⁻¹⁰ to 2.04×10⁻⁸ for male consumers and 2.00×10⁻¹⁰ to 1.81×10⁻⁸ for female consumers, suggesting negligible risks of OPEs to humans (CR<10-6). The maximum total CR of OPEs in this study was lower than that in the middle (1.3×10⁻⁷) [26] and lower (9.63×10⁻⁸) [25] Yangtze River Basin and the 90% CR in tap water in a national-scale report in China (1.45×10- 6) [17]. The median total CR of OPEs was 6.36×10⁻⁹ for male consumers during the wet season, which is the same order of magnitude as that during the dry season (7.92×10⁻⁹). A similar was found in the total CR for female consumers (5.65×10⁻⁹ vs. 7.04×10⁻⁹). The results suggested that the carcinogenic risk of OPEs in source water during the wet season was similar to that during the dry season. The dominant contributor to CR was TCEP during the dry season, accounting for a median of 92%, while the dominant contributor to CR was TDCIPP during the wet season, accounting for a median of 28% (Fig. 4). TCEP was the dominant contributor to both the non-carcinogenic and carcinogenic risk during the dry season, which can be attributed to its high concentration and toxicity.
Table 1.
Maximum concentrations of investigated OPEs in surface water worldwide (ng/L)
Environmental Impact of Organophosphate Esters in Source Water
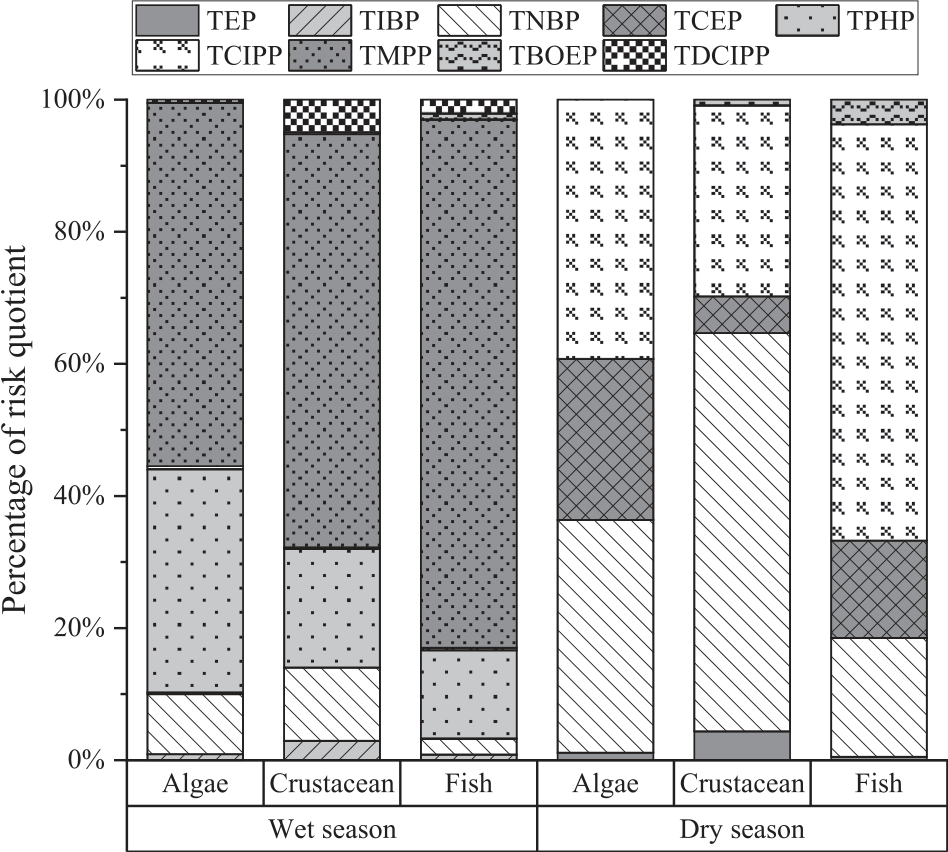
The values of RQs of 9 OPEs with available PNEC were calculated. The joint effect of the OPEs was estimated using the summed value of their RQs [6, 30]. The median total RQ of OPEs to algae, crustaceans, and fish were 2.79×10⁻², 2.59×10⁻², and 4.73×10⁻², respectively, during the wet season. During the dry season, these values were 3.10×10⁻³, 2.17×10⁻³, and 2.80×10⁻³, respectively. The results suggested that the environmental risk of OPEs in source water was higher during the wet season than during the dry season. The total RQ of OPEs in all sampling points, except for XR-4, suggested a low environmental ecological risk (RQ<0.01), while the total RQ of OPEs in XR-4 was 0.215, suggesting a medium environmental ecological risk. The dominant contributor to the total RQ varied at sampling points; however, TMPP was the most prevalent during the wet season, and TCIPP and TNBP were both the most prevalent during the dry season (Fig. 5). The maximum total RQ of OPEs in this study (0.215) was higher than that in Haihe River (4.46×10⁻²) [51], but lower than that in Luoma Lake in Jiangsu province (~1.7) [52].
Conclusions
The occurrence and seasonal difference of 14 OPEs in the river and reservoir source water in South China were investigated. All OPEs were detected in the source water during the wet season while 10 OPEs were detected during the dry season. A higher total concentration of OPEs was found during the dry season than during the wet season. The difference in OPEs in source water between the river and reservoir source water in South China was limited. Although the health and environmental risk of OPEs in source water in South China was mostly negligible, the potential risk of OPEs to humans and the aquatic environment may increase due to bioaccumulation and persistence.

