

Introduction
The phenomenon of global climate change induced by greenhouse gas emissions has gradually permeated every aspect of our lives [1-4]. From the increasing frequency of extreme weather events and the loss of biodiversity to the instability of agricultural production, it has posed unprecedented challenges to the stability and security of human society with its irreversible nature. This challenge demands immediate action and full commitment to counteract its effects [5-9]. In the pursuit of transitioning to a low-carbon economy, governments and the international community are demonstrating unprecedented determination and effort, seeking an effective combination of technological innovation, policy guidance, and market mechanisms. On one hand, the vigorous development of renewable energy sources, such as wind and solar power, aims to reduce reliance on fossil fuels and thereby decrease greenhouse gas emissions [10, 11]. On the other hand, enhancing energy efficiency, optimizing industrial structures, and promoting green and low-carbon development are critical measures in this endeavor [12, 13]. After prolonged efforts, major developed economies globally have made significant progress in building low-carbon economies [14]. Specifically, in terms of energy efficiency improvement, the European Union has enacted the “European Green Deal,” which aims to reduce carbon emissions by raising energy efficiency standards and investing in clean technologies [15]. The United States has implemented the Energy Independence and Security Act, which includes increasing fuel efficiency standards and supporting energy efficiency projects. Japan has introduced the “Green Economy Strategy,” focusing on improving energy efficiency through technological innovation [16]. Regarding the development of renewable energy, Germany has significantly increased the proportion of renewable energy in its electricity generation through the Renewable Energy Sources Act (EEG) [17]. Spain and Portugal have collaborated on the “Mediterranean Solar Plan” to develop solar energy resources in the Mediterranean region [18]. California has passed the “Global Warming Solutions Act,” which mandates that power companies gradually increase their share of renewable energy [19]. In terms of carbon pricing mechanisms, the EU has established the Emissions Trading System (EU ETS), the world’s largest carbon market, which controls greenhouse gas emissions by capping and trading carbon emission allowances [20]. California has implemented its own carbon trading system, connected with the EU ETS, forming the world’s largest trans-regional carbon market. In the area of green finance, the EU has set up the European Green Bond Standard, providing financing channels for green investments [21]. The International Finance Corporation (IFC) has introduced the “Green Bond Principles,” establishing international standards for green bond issuance [22]. For low-carbon transportation, the Norwegian government has incentivized the purchase and use of electric vehicles through tax benefits and infrastructure development. France has launched the “Future Mobility Plan,” aiming to reduce urban transportation carbon emissions through public transport and non-motorized travel [23]. These initiatives demonstrate that developed economies are actively promoting the development of low-carbon economies through comprehensive policy portfolios to achieve emission reduction targets and address climate change. However, these efforts face challenges such as technological hurdles, funding requirements, and the need for international coordination, necessitating continuous innovation and international cooperation to overcome.
Since the reform and opening up, China’s economy has maintained a high growth rate and achieved remarkable accomplishments [24, 25]. However, along with the continuous increase in energy consumption, a series of environmental issues have gradually emerged [26-28]. Problems such as air pollution, water shortages, and ecological degradation have become increasingly severe, posing significant challenges to the daily lives of the people [5, 29, 30]. Therefore, actively promoting green development and strictly controlling carbon emissions have become crucial for achieving sustainable development. Properly balancing regional economic development and carbon emissions is particularly important for attaining emission reduction targets [31].
As a vital hub of heavy industry in China, the three northeastern provinces boast well-established infrastructure and industrial systems, playing a significant role in the country’s industrialization [32, 33]. Moreover, serving as a crucial gateway for economic cooperation between China and Northeast Asia, the strategic importance of the region cannot be overstated [34, 35]. However, in recent years, negative repercussions stemming from population outflows and uneven industrial development have significantly impeded the overall progress of the three northeastern provinces [36-38]. Therefore, this paper focuses on analyzing the northeastern provinces to address these challenges.
In this context, effectively addressing these challenges to promote sustainable development in Northeast China has become the focus of this research. Based on carbon emission data from 2002 to 2021, our study employs the Tapio decoupling model to thoroughly analyze the decoupling relationship between carbon emissions and economic growth in Northeast China. By examining this relationship, we can gain a clearer understanding of the trends in carbon emissions during the region’s economic development, providing scientific evidence for formulating targeted carbon reduction strategies. Additionally, our study uses multiple methods, including factor decomposition and cointegration analysis, to comprehensively reveal the influencing factors of carbon emissions and their dynamic interrelationships [39]. This helps us deeply understand the root causes of carbon emissions and the interaction mechanisms between various factors, providing strong support for the development of integrated carbon reduction measures. Through this study, we aim to explore feasible carbon reduction strategies that offer significant theoretical and practical value for promoting sustainable economic and social development in Northeast China and across the country. This not only helps alleviate the pressures of global climate change but also makes an important contribution to the sustainable development of China’s economy and society. Compared to other similar studies, our research not only encompasses traditional energy data from the Northeast region but also integrates more recent statistical data. This approach extends the study’s time span, allowing for a more comprehensive reflection of the region’s economic development and carbon emission historical trends. Based on the research findings, a series of targeted policy recommendations are proposed. These recommendations take into account the current economic situation and anticipate potential future developments, providing policymakers with forward-looking guidance. Our study not only offers new research perspectives and methodologies for the academic community but also directs subsequent related research. Especially in the context of globalization and climate change, it holds significant reference value for the study of economic development and carbon emissions in other developing countries and regions.
Material and Methods
Research Methods
Total Carbon Emissions Accounting
Utilizing the sectoral approach outlined by IPCC (2006) [40], we computed the total carbon emissions for China and its 30 provinces from 2017 to 2021. The calculation formula is presented as follows:
Here, j represents various industries, CEdirect, j denotes the aggregate of direct carbon emissions, CEenergy–related, j signifies the carbon emissions arising from fossil fuel combustion within industry j, and CEprocess–related, j indicates carbon emissions resulting from industrial processes.
The carbon emissions from the combustion of fossil fuels can be calculated using the following formula:
Where ADij represents the consumption of fossil fuel i divided by department j. NCVi×CCi×Oij represents the emission coefficient of fossil fuel i burned by department j, which can be further divided into three parts: net calorific value NCVi, carbon content CCi of fossil fuel i, and oxidation rate Oij of fossil fuel i used by department j. For industrial production processes, only cement production is considered in this study, which accounts for nearly 70% of China’s processing-related carbon emissions. The calculation formula is as follows:
Where t represents the industrial production process, ADt,j represents the amount of cement consumed by industry j for industrial production, and EFt,j represents the emission factor.
Decoupling Model
The Tapio model is a data-driven decomposition method that categorizes influencing factors into four types: technological factors, structural factors, activity level factors, and efficiency factors. This model is commonly utilized to analyze the trends in energy consumption, carbon emissions, and other indicators, as well as the driving forces behind these changes. Through this decomposition, policymakers and researchers can gain a better understanding of which factors exert positive or negative impacts on environmental indicators. Consequently, they can develop appropriate policies or take measures to promote sustainable environmental development. The Tapio model excels in providing a structured framework for analyzing complex environmental indicator changes, aiding in the identification of key driving factors. Its data-driven nature makes it applicable across various contexts, whether at the national, industrial, or regional levels. By analyzing historical data, the Tapio model can help forecast future trends, thereby offering a scientific basis for decision-making. Our study adopts the Tapio decoupling model [41-43], integrating the actual situation of the industrial structure in the three northeastern provinces of China, where industrial production serves as the primary industry. Gross Industrial Product (GIP) is introduced as an intermediary variable to decompose the causal chain of decoupling equations. The decoupling coefficient is calculated according to the following formula. The determination of decoupling status is illustrated in Table 1.
Where CT1 and CT2 represent the carbon emissions in the initial and final years, respectively. ET1 and ET2 represent the total energy consumption in the initial and final years, respectively.
Element Decomposition
Our study decomposes the factors influencing carbon emissions and explores the interactions among various factors by analyzing existing research. Factor detection and interaction detection in the Geographic Detector (Geodetector) are employed for the analysis [44, 45]. Geodetector is utilized to detect spatial differentiation and reveal its driving forces. If a certain independent variable significantly influences a dependent variable, their spatial distributions should exhibit similarity, allowing for the analysis of their correlation. Geodetector is applied to calculate the explanatory power of each driving factor on carbon emissions in the study area, expressed as the q value. A higher q value indicates a stronger driving effect of the factor on carbon emissions, while a lower value indicates a weaker effect. Interaction Detector is utilized to study the interactions among different driving factors, determining whether the combined effects of two evaluating factors increase or decrease the explanatory power on the dependent variable or if these factors’ impacts on the dependent variable are independent of each other. The calculation formulas are presented as follows:
In the formula, q is the degree of explanation of carbon emissions by the influencing factor; n and σ2 denote the total number of samples and the variance, respectively; nh and σh denote the sample size and the sample variance of the hth stratum (h = 1, 2, ···, L), respectively. q is in the range of [0,1], and the closer the value is to 1, it implies that the influence of the factor on carbon emissions is bigger, and vice versa, the weaker it is.
Cointegration Test
Cointegration tests are a statistical method used to analyze whether a long-term equilibrium relationship exists between two or more non-stationary time series data [47]. This relationship implies that even if these series themselves are non-stationary, certain linear combinations of them may be stationary. The core idea of the cointegration test is that if a long-term stable relationship exists between the non-stationary time series of two or more variables, their deviations from the long-term equilibrium state should be temporary and tend to disappear over time. Our study employs cointegration tests to analyze non-stationary time series [48]. Firstly, the augmented Dickey-Fuller test is conducted to examine the stationarity of the time series variables. Subsequently, the Johansen test method is utilized for cointegration analysis to determine whether there exists a cointegration relationship between carbon emissions and their influencing factors. Finally, based on the cointegration analysis, the Granger causality test is employed to analyze whether there exists a causal relationship between carbon emissions and its influencing factors. The Granger causality test, established by Clive W.J. Granger, is used to analyze the causal relationships between economic variables. This test is based on time series data and determines the existence of causality by comparing the predictive power of different models. The central concept of the Granger causality test is to observe whether the historical data of one variable provides additional informational gains for predicting the future values of another variable, thereby establishing whether a causal relationship exists between the two variables [49].
Data Sources
This study focuses on the northeastern region of China, comprising Heilongjiang, Jilin, and Liaoning provinces. Data utilized in this research are sourced from the “China City Statistical Yearbook” and the “China Energy Statistical Yearbook.” To mitigate potential lag effects between carbon emissions and economic development, the study period is divided into four stages, each spanning five years: 2002-2006 (Stage 1), 2007-2011 (Stage 2), 2012-2016 (Stage 3), and 2017-2021 (Stage 4).
Results
Carbon Emission Changes
The overall trend indicates a year-on-year increase in carbon emissions across the three northeastern provinces of China, albeit with fluctuations in certain years. Carbon emissions in Liaoning Province have shown relatively stable growth over the past two decades, trending upward consistently. Starting from 220.69 million tons in 2002, it escalated to 545.67 million tons in 2021, signifying a considerable growth rate. Conversely, carbon emissions in Jilin Province have exhibited fluctuating growth patterns, with significant increases observed between 2003 and 2004 and again from 2011 to 2012. Despite these fluctuations, an overall upward trend is evident. Similarly, carbon emissions in Heilongjiang Province have demonstrated stable growth over the past two decades, particularly noticeable during the period from 2009 to 2012 (Fig. 1).
Table 1.
Classification of the 8 decoupling states [46].
Regarding annual variations, carbon emissions in all provinces showed fluctuations, with a notable increase during the years from 2009 to 2012, possibly attributed to the rapid economic development and industrialization in the northeastern region. The growth in carbon emissions is influenced by various factors, including industrial production levels, energy structures, and policy measures. In the northeastern provinces, industrial production stands out as a primary source of carbon emissions, underscoring the significance of policies aimed at industrial restructuring and energy transition in curbing the overall carbon emissions.
Decoupling Relationship Analysis
During the research period, the decoupling statuses of the three provinces in Northeast China are shown in Table 2. Analysis reveals that, regarding the decoupling relationship between carbon emissions and energy consumption, all provinces started from a state of decline initially and then followed different trajectories. Concerning the decoupling relationship between energy consumption and industrial gross domestic product (GDP), Heilongjiang Province gradually progressed towards the most ideal state of strong decoupling, Jilin Province transitioned from strong negative decoupling to expanding negative decoupling, while Liaoning Province gradually shifted towards negative decoupling. Regarding the decoupling relationship between industrial gross domestic product (GDP) and GDP, there were no changes in the decoupling statuses of the three provinces throughout the period; all remained in a state of strong decoupling. Analyzing the decoupling relationship between carbon emissions and GDP, Heilongjiang Province and Liaoning Province transitioned from strong decoupling to expanding decoupling, while the decoupling status of Jilin Province remained unchanged, maintaining the most ideal state of strong decoupling.
Element Decomposition
The present study reveals that GDP, population, coal consumption, oil consumption, and natural gas consumption exert the most significant effects on carbon emissions [50, 51]. Therefore, these factors were selected as driving forces in this study. Factor analysis indicates that GDP, oil consumption, and population passed the significance test. Among them, GDP exhibits the strongest influence with a q value of 0.821, followed by oil consumption (q = 0.574) and population (q = 0.460). Natural gas consumption and coal consumption have q-values of 0.227 and 0.185, respectively, indicating weaker effects.
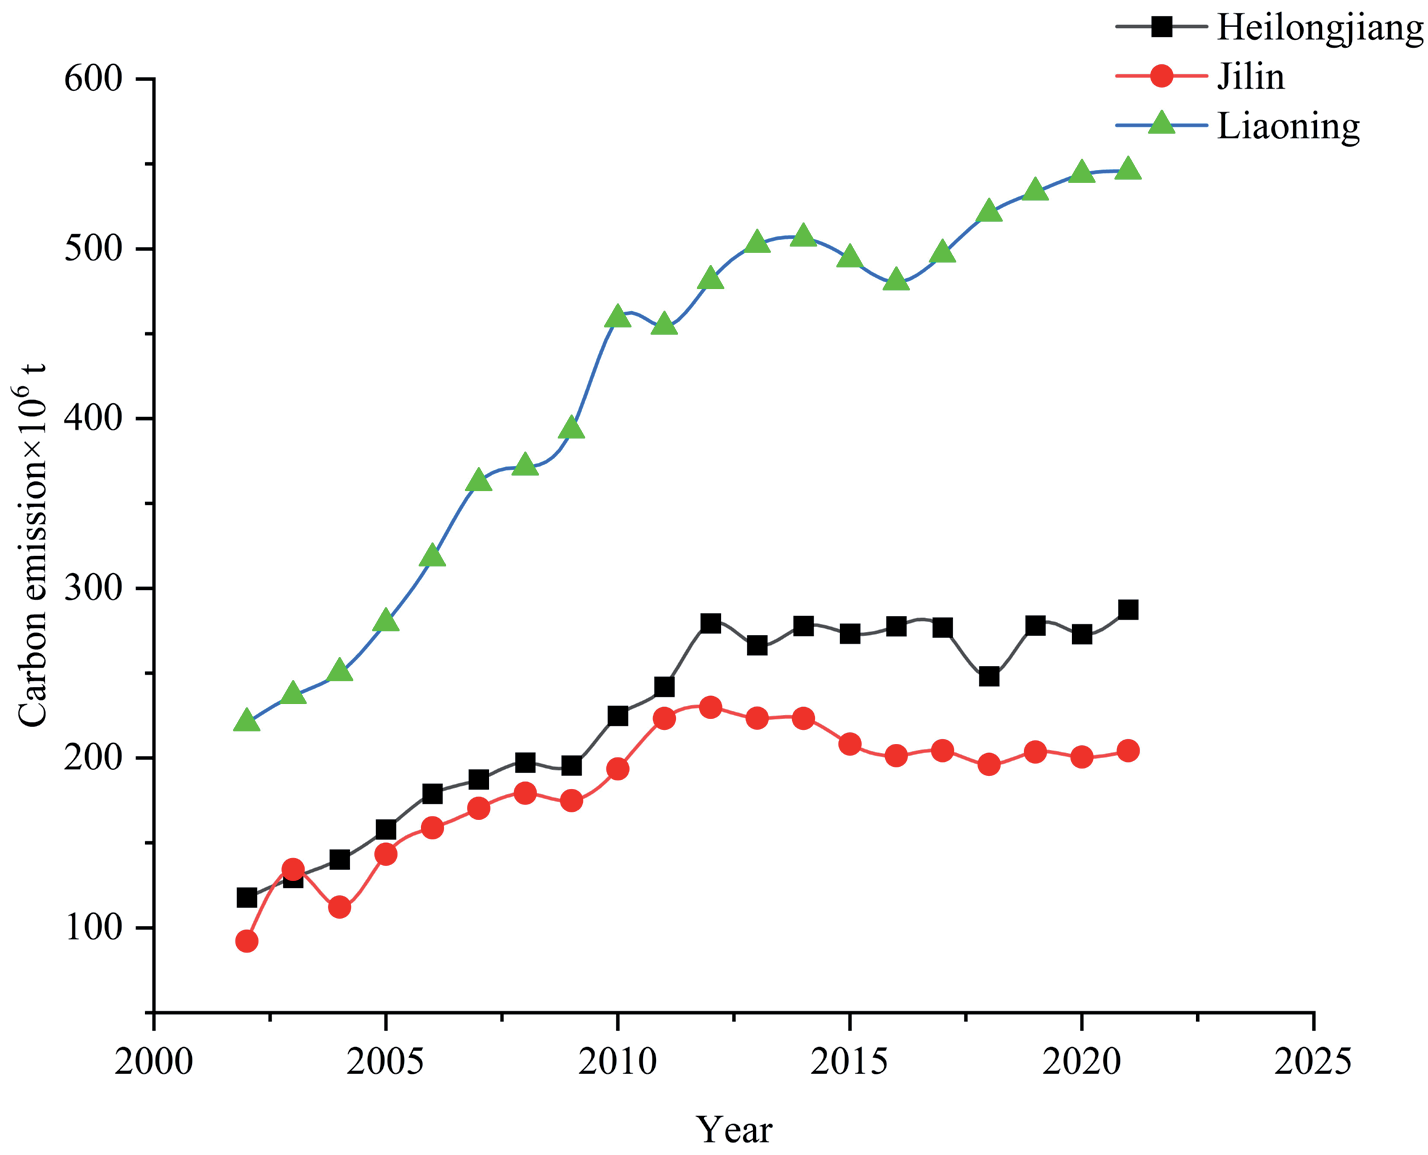
Table 2.
Decoupling status causal chain decomposition.
Results from interaction analysis (Table 3) demonstrate that the combined effects of multiple factors significantly increase total carbon emissions. Bivariate interactions are stronger than univariate ones, with two pairs of interaction effects surpassing the sum of the two individual univariate effects, showing nonlinear enhancement. In contrast, other interactions yield values lower than the sum of the two individual univariate effects, indicating linear enhancement. The interaction between population and GDP has the greatest impact on carbon emissions (0.902), followed by GDP and natural gas consumption (0.860), and GDP and oil consumption (0.858). This further emphasizes the increased significance of results through the combined effects of multiple factors.
Cointegration Test
The results of the factor detection by the geographic detector indicate that GDP has the greatest impact on carbon emissions. Therefore, a cointegration analysis between GDP and carbon emissions was conducted. First, a stationarity test was performed. According to the results of the Augmented Dickey-Fuller (ADF) unit root test (Table 4), both GDP and carbon emissions exhibited stationarity at a lag of 2, satisfying the conditions for cointegration analysis. The cointegration equation computed using Stata 15 software reveals a long-term equilibrium relationship between GDP and carbon emissions. Specifically, in Heilongjiang Province, a 1% increase in GDP leads to a decrease in carbon emissions by 0.026%; in Jilin Province, a 1% increase in GDP results in a decrease in carbon emissions by 0.461%; whereas in Liaoning Province, a 1% increase in GDP causes a 0.397% increase in carbon emissions. Hence, carbon emissions vary in response to GDP changes across different regions.
Table 3.
The interaction detection results (q).
Table 4.
ADF unit root test.
Table 5.
Granger test results.
Causality Test
The results of the Granger causality test (Table 5) reveal that when the lag order is set to 3 for Heilongjiang Province, a unidirectional causality is observed, indicating that GDP causes carbon emissions, but carbon emissions do not Granger-cause GDP. This suggests that the lagged term of carbon emissions does not effectively explain GDP development. For Jilin Province, with a lag order of 1, a unidirectional causality is evident, where GDP is not the cause of carbon emissions, but rather, carbon emissions Granger-cause GDP development. Similarly, for Liaoning Province with a lag order of 4, a unidirectional causality is observed, showing that GDP does not Granger-cause carbon emissions, but carbon emissions Granger-cause GDP.
Discussion
The northeastern region of China, historically recognized as the “Eldest Son of the Republic,” was once a pivotal industrial base. In the early stages of China’s economic development, this region played a crucial role, particularly in heavy industries and defense sectors [52, 53]. However, with the advent of economic reforms and the development of a market economy, the economic structure and growth model of the northeastern region faced significant challenges, leading to economic decline and industrial aging [54]. Specifically, the economic development of the Northeast region faces several critical challenges:
(1) Monolithic Industrial Structure: The industrial structure of the Northeast region has long been dependent on heavy industries and energy-intensive sectors such as steel, coal, and chemicals. While these industries contribute significantly to the economy, their growth has slowed, and they exert considerable environmental pressure.
(2) Insufficient Innovation Capacity: Compared to the eastern coastal regions, the Northeast region has relatively weak technological innovation capabilities. The development of high-tech industries and the service sector lags behind, lacking new growth drivers. This limitation hampers the diversification and high-quality development of the economy.
(3) Population Loss: In recent years, the Northeast region has faced issues of population aging and labor force outflow. The migration of young people to other regions has led to a tight labor market, impacting economic vitality and development potential.
To rejuvenate the northeastern economy, the Chinese government implemented the Northeast Revitalization Strategy in 2003. This strategy aimed to restore the region’s economic vitality through a series of policy measures, including the reform of state-owned enterprises, attraction of foreign investment, development of high-tech industries, and improvement of infrastructure. After years of effort, the northeastern economy has shown signs of recovery, with some areas even experiencing rapid growth. In the context of the new era, the northeastern region is at a critical stage of comprehensive revitalization.
In recent years, the carbon emissions issue in the northeastern region has received widespread attention [55]. According to the latest research, carbon emissions in this region are primarily derived from energy consumption, particularly coal usage [56]. Statistics indicate that the northeastern region accounts for nearly a quarter of the nation’s total coal consumption [57]. The substantial coal energy consumption for winter heating and industrial production has resulted in high levels of direct carbon emissions. Multiple factors influence the carbon emissions in the northeastern region, including the energy structure, industrial structure, and residential lifestyles. In terms of the energy structure, the region still relies heavily on coal, with traditional coal-fired units having low efficiency and emitting large amounts of waste gas, leading to high direct carbon emissions. Regarding the industrial structure, the region’s industrial profile is characterized by a high proportion of heavy industries, especially steel, coking, aluminum, and cement, all of which are energy-intensive and have significant environmental impacts. Moreover, the northeastern region of China faces several challenges related to carbon emissions. On one hand, industrial enterprises in this region encounter significant difficulties in energy conservation and emission reduction. Some outdated equipment and processes fail to meet new environmental standards, and upgrading them requires substantial financial investment. On the other hand, although China has established a nationwide carbon emission trading market, participation from enterprises in the Northeast remains low. This is due to a lack of effective incentive mechanisms to promote the application of low-carbon technologies and reduce carbon emissions. Furthermore, Carbon Capture and Utilization (CCU) technology, which is a crucial method for reducing carbon emissions, is still in its initial stages of application in the Northeastern region. The progress of technology research and industrialization is slow. Thus, it is evident that the problems of economic development and carbon emissions in the Northeastern region are intertwined. To achieve a green economic transformation and sustainable development, a multifaceted approach is required, including industrial structure adjustment, innovation-driven development, optimization of population policies, and measures for energy conservation and emission reduction.
The economic development and carbon emissions in Northeast China exhibit a complex relationship. According to our research and other relevant studies, there exists a long-term cointegration between economic growth and CO2 emissions in this region, indicating that economic growth leads to increased carbon emissions [58]. However, this increase is not an inevitable path to achieving economic growth. Northeast China should aim for low-carbon development by optimizing industrial structures, adjusting energy compositions, and improving energy efficiency. In the context of the “carbon peak and carbon neutrality” goals, the Northeast region should fully consider the stage of economic development, regional differences, and the heterogeneity of carbon emission drivers to balance regional economic growth and carbon emissions. The study also found that carbon emissions and economic growth in Northeast China are predominantly weakly decoupled, with characteristics of periodicity. Furthermore, empirical research based on the Environmental Kuznets Curve (EKC) model shows that the relationship between carbon emissions and economic development in Northeast China conforms to an inverted U-shape pattern. It is predicted that the region’s major energy-related carbon emissions will peak around 2035. This implies that in the coming years, Northeast China needs to adopt proactive policies to ensure carbon emissions peak, thereby achieving the goal of a low-carbon economy.
To mitigate carbon emissions, the Northeastern region needs to implement a series of measures, including promoting clean energy, enhancing energy efficiency management, optimizing industrial structures, establishing a carbon trading market, accelerating urbanization, and fostering technological innovation. For instance, the widespread adoption of clean energy sources such as solar, wind, and hydropower should be vigorously promoted to gradually reduce the reliance on high-carbon-emission traditional energy sources like coal. Simultaneously, energy efficiency management should be strengthened to increase energy utilization efficiency and reduce waste. Moreover, optimizing industrial structures to promote the development of advantageous industries and advancing industrial greening, intelligence, and energy-saving practices are also effective ways to reduce carbon emissions.
Conclusions
Our study, based on the carbon emissions generated by energy consumption in the three northeastern provinces of China from 2002 to 2021, combined with the actual situation of the research area, has reorganized and constructed the decoupling theory from the perspective of industrial gross domestic product (GDP). Furthermore, it has improved the research methodology, vividly demonstrating various decoupling states through three decoupling coefficients. Within the research period, significant variations in decoupling states were observed across different regions.
Regarding factor decomposition, geographical detectors were utilized to analyze the interactions among various factors. Our study revealed that GDP, petroleum consumption, and population factors had the most significant promoting effect on the increase of carbon emissions, with the interactions of multiple factors being more pronounced than single-factor effects. A long-term cointegration correlation was identified between GDP and carbon emissions.
To achieve carbon neutrality and reduce carbon emissions while promoting high-quality and sustainable economic development, we propose the following specific measures for the Northeastern region of China:
(1) Optimize Industrial Structure: Implement industrial restructuring policies to gradually eliminate traditional industries with high energy consumption and pollution. Develop modern manufacturing and service industries characterized by low energy consumption and emissions. Increase support for high-tech industries, attracting and nurturing a cohort of innovative enterprises with international competitiveness. Promote the development of industrial clusters to create distinctive, highly competitive clusters, thereby enhancing overall economic efficiency.
(2) Strengthen Energy Structure Adjustment: Increase the proportion of clean energy in energy consumption, particularly by developing and utilizing renewable energy sources such as wind and solar power. Implement energy-saving retrofit projects to improve energy efficiency in industries, buildings, and transportation sectors. Promote the adoption of new energy vehicles and smart grid technologies to reduce dependence on oil and enhance the flexibility and stability of the power system.
(3) Promote Green and Low-Carbon Technological Innovation: Establish a green technology innovation system, encouraging enterprises to increase their R&D investments, especially in energy-saving, emission reduction, clean production, and circular economy. Collaborate with universities and research institutions to jointly develop and apply low-carbon technologies. Set up a green and low-carbon industry development fund to support the growth of innovative small and medium-sized enterprises (SMEs) and startups.
(4) Improve Carbon Emission Management Systems: Establish and improve systems for carbon emission monitoring, reporting, and verification to ensure data accuracy and transparency. Actively participate in the national carbon emissions trading market to promote emission reductions through market mechanisms. Develop stringent carbon emission standards and regulations, imposing punitive measures on enterprises that exceed emission limits.
(5) Cultivate Green and Low-Carbon Talent: Enhance higher and vocational education curricula in green and low-carbon fields to cultivate professional talent. Conduct green and low-carbon skills training to improve the technical and managerial capabilities of current employees. Attract high-end domestic and international green and low-carbon talent to work and innovate in the Northeastern region.
(6) Promote Regional Cooperation and Exchange: Strengthen cooperation with other regions domestically and internationally in green and low-carbon fields to share experiences and technologies, jointly addressing climate change. Participate in international green and low-carbon projects and cooperation networks to enhance the international influence of the Northeastern region.
(7) Raise Public Environmental Awareness: Conduct extensive environmental education and awareness campaigns to increase public recognition and participation in low-carbon lifestyles. Promote energy-saving and emission-reduction lifestyle practices such as green travel, water conservation, and rational electricity use. Encourage public participation in environmental public welfare activities to create a favorable atmosphere of societal engagement.
By implementing the above recommendations, the Northeastern region can effectively reduce carbon emissions and achieve carbon neutrality, while steering economic development towards higher quality and sustainability. This requires the concerted and continuous efforts of the government, enterprises, research institutions, and the public.

