


Introduction
The importance of renewable energy has significantly increased in recent years, with biodiesel emerging as a promising source derived from the biomass of photosynthetic organisms. Due to the abundant availability of raw materials in nature, biodiesel has the potential to meet energy demands. Additionally, biodiesel is considered environmentally friendly as it can significantly reduce greenhouse gas emissions, including carbon dioxide (CO2), sulfur dioxide (SO2), and nitrogen oxides (NOx) [1-3].
One potential source of biomass raw materials for biodiesel production is microalgae [4, 5]. Microalgae, which are small-sized photosynthetic organisms with diameters ranging from 3-30 µm, include both single cells and colonies that thrive in fresh and marine waters, commonly known as phytoplankton [6]. These organisms encompass both prokaryotic and eukaryotic species and have significant potential as raw materials for biofuel production and natural food sources. Microalgae are advantageous because they are easy to cultivate, exhibit rapid growth, do not require fertile growing media, and do not compete with terrestrial plants for resources [3]. Typically, microalgae possess chlorophyll a and c and are currently classified under the kingdom Chromista within the division Ochrophyta. This division includes eight classes: Bacillariophyceae (diatoms), Bolidophyceae, Chrysophyceae (golden algae), Eustigmatophyceae, Dictyhophyceae, Phaeophyceae (brown algae), Raphidophyceae, and Xantophyceae (yellow-green algae) [7].
Microalgae offer numerous advantages for development as an alternative energy source. They possess a simple cell structure and can be cultivated under controlled conditions without reducing productivity. Microalgae exhibit very high photosynthetic efficiency, converting approximately 3-8% of sunlight into energy, compared to higher plants, which convert only around 0.5%. They also have a short life cycle, can thrive in extreme environmental conditions such as high salinity or polluted environments, and do not compete with food crops [8].
Naturally, microalgae produce biomass, but the quantities are often limited. Large-scale cultivation of microalgae is typically enhanced using photobioreactors. A photobioreactor is a transparent reactor equipped with media supply and gas emission systems designed to culture microalgae and facilitate CO2 absorption [9]. Gu et al. [10] demonstrated that optimizing photobioreactor conditions and designs could potentially increase microalgae biomass productivity by up to 40%. The growth rate of microalgae is influenced by various factors within the photobioreactor, including photosynthetic efficiencies, light-dark cycles, CO2 concentrations, mass transfer, hydrodynamic behavior, and pH, which are crucial for maximizing CO2 absorption [11, 12].
Microalgae require essential nutrients to promote their growth, which can be provided by adding macronutrients, micronutrients, and vitamins [13]. While microalgae naturally obtain nutrients from their surrounding environment, large-scale cultivation for biomass production necessitates using artificial media to supply these nutrients. The provision of adequate nutrients in the cultivation media is a critical factor influencing the quantity of biomass produced during microalgae cultivation [14].
One commonly used artificial medium in microalgae cultivation is Guillard (f/2) [15], which provides a comprehensive range of nutrients essential for microalgae growth. Mardalisa et al. [16] reported that the Guillard medium resulted in the highest density and average specific growth rate of Chlorella vulgaris compared to urea and Walne media. Similarly, Jati et al. [17] found that the Guillard medium supported a more stable growth pattern for Chaetoceros gracilis than the Walne medium.
Guillard medium has also been effectively used to cultivate Navicula sp., resulting in significant biomass production [18, 19]. Navicula spp. (class Bacillariophyceae) are microalgae species widely cultivated for biodiesel production due to their high adaptability and rapid growth [3, 20]. Zhao et al. [21] reported that the growth of Navicula spp. depends on the availability of SiO32−, with optimal concentrations of NO3− and PO43− being 3.6 mmol/L and 0.18 mmol/L, respectively. Silica is essential for forming the cell walls (frustules) of Navicula spp., involving various internal factors such as sensors, transporters, vesicles, protein expression, and intercellular communication [12]. Optimal silica application enhances cell wall formation and is crucial for the survival of Navicula sp. [17, 22].
Based on the background above, this research utilized the Guillard medium with the addition of silica as a nutrient source to cultivate the microalgae Navicula sp. The study measured the cell abundance and biomass of Navicula sp. at various concentrations of Guillard medium and silica nutrients.
Experimental
Research Equipment and Materials
The equipment used in this research included culture containers, Tubular Lamps (TL), and electromagnetic air pumps as components of the culture system. For data collection, a digital analytical scale with 0.0001 g accuracy, sample containers, aluminum foil, Eppendorf tubes, an Olympus microscope, a camera, a Neubauer hemocytometer counting chamber, 4-micron Munttel filter paper, an oven, cover glass, a refrigerator, an autoclave, and laminar airflow were utilized. The materials used in this research included Navicula sp. cultures obtained from PT. Pertamina with seawater as the cultivation medium, Guillard medium, 1% Lugol solution as a cell preservative, a Si solution in the form of Na2SiO3 for microalgae cell wall formation, Reverse Osmosis (RO) water, and 70% alcohol for solvent and sterilization purposes.
Research Locations
This research was conducted at the Environmental Technology Center Laboratory, Agency for the Assessment and Application of Technology in Serpong, South Tangerang, and at the Central Microbiology Laboratory of the Integrated Laboratory at Islamic State University of Syarif Hidayatullah Jakarta.
Experimental Design
This experimental research used a Randomized Block Design to test eight treatments on Navicula sp. microalgae cultures, each with different concentrations of Guillard medium and silica (Si), repeated three times. The treatments included varying harvest volumes and nutrient provisions (Table 1).
Harvest volumes of 10% and 20% corresponded to taking 200 mL and 400 mL of culture samples, respectively. The nutrient top-up treatment involved adding 1 mL of NaNO3, NaH2PO4, and trace elements, along with 0.5 mL of vitamins. The 10% nutrient provision involved 20 µL each of NaNO3, NaH2PO4, and trace elements, and 10 µL of vitamins, while the 20% nutrient provision involved 40 µL each of NaNO3, NaH2PO4, and trace elements, and 20 µL of vitamins. Si concentrations of 0.5 g/L and 0.05 g/L corresponded to 1 mL and 0.5 mL additions to the Navicula sp. treatment cultures.
Equipment Sterilization
The initial sterilization stage involves autoclaving equipment such as measuring cups, micropipettes, tips, Eppendorf tubes, and sample bottles for 4-5 hours. The plastic aerator hose can be sterilized by spraying it with 70% alcohol and then drying it with a tissue. The cultivation container is sterilized with a chlorine solution (10%), left for 24 hours, and rinsed with RO water. Seawater was also sterilized to reduce contaminants that could affect the growth of Navicula sp. This is done by filtering the seawater four times using graduated cartridge sizes of 9 µm, 5 µm, 4 µm, and 2 µm.
Preparation of Guillard Medium and Silica Stock Solutions
The stock solution of Guillard’s medium is prepared by weighing the macronutrient and micronutrient chemicals using an analytical balance. The macronutrient and micronutrient chemicals are added one by one into a 500 mL beaker, ensuring that each component is dissolved immediately after being added. Once all the ingredients are dissolved, RO water is added to bring the total volume to 500 mL. The solution is then homogenized using a magnetic stirrer. The prepared solution is transferred to bottles, which are tightly sealed and labeled. Meanwhile, the silica (Si) solution is already available in liquid form and can be used directly without further preparation.
Inoculum Preparation
The Navicula sp. inoculum was inoculated into 1 L of sterile seawater in two 3 L Duran bottles and three 5 L Duran bottles. The culture was then scaled up to full volume using seawater to increase the number of Navicula sp. cells. Each scale-up occurred one week apart, with Guillard medium stock solution added for the 3 L and 5 L volumes at each scale-up.
Inoculation Process
Inoculation was carried out by preparing 12 cultivation bottles, each with a capacity of 2.5 L. Each bottle was filled with 1.8 L of sterile seawater, 200 mL of Navicula sp. inoculum, and Guillard and Si stock solution according to the specific treatment. The cultivation bottles were then labeled with the appropriate treatment codes. A hole was made in each bottle cap, and a plastic hose was attached, connecting the bottle to an electromagnetic air pump. The cultures containing Navicula sp. inoculum were moved to a closed room and illuminated with fluorescent lamps for 24 hours at a room temperature of 25ºC.
Table 1.
Treatment Scheme for Guillard (f/2) Nutrient and Silicon (Si) Concentrations in Navicula sp. Growth.
Harvesting Process
Navicula sp. culture was harvested daily starting on day 5, based on the assumption that the growth of Navicula sp. had reached the logarithmic phase. Before harvesting, the cultivation bottles were gently stirred to ensure homogeneity and prevent settling. Cultures were harvested according to the treatment codes from the 12 cultivation bottles. The harvested cultures were then placed in labeled containers corresponding to their treatment codes.
Addition of Guillard Medium and Silica Stock Solutions
The addition of the Guillard medium stock solution began on the 5th day, assuming that the growth of Navicula sp. had reached the logarithmic phase, where the population increases sharply and requires additional nutrients for continued growth. After harvesting, concentrations of Guillard and Si stock solutions were added according to the specific treatments. Sterile seawater was then added to the 12 cultivation bottles until the volume reached 2 L.
Sampling
Sampling of Navicula sp. culture was conducted daily, starting on day 0 and continuing for 14 days. It is assumed that by day 14, the Navicula sp. cell population would begin to decline. Before sampling, the temperature was measured in the 12 cultivation bottles. The bottles were then stirred to ensure that the Navicula sp. culture was homogeneous and did not settle. Subsequently, 50 mL culture samples were taken from each of the 12 cultivation bottles. During sampling, it was essential to ensure that all installations remained in place and functioned properly.
Cell Counting
A total of 0.8 mL of Navicula sp. culture was collected and transferred into an Eppendorf tube containing 0.2 mL of Lugol solution. The tube was then labeled with the treatment code and sampling date. This step ensures that the microalgae cells maintain their shape and do not lyse during microscopic counting. Cell abundance was determined using a Neubauer Hemocytometer, which was rinsed with RO water and dried with tissue. A cover glass was placed over the counting chamber, and the sample was carefully stirred before being added to ensure it filled the chamber without air bubbles. Cells were counted under a microscope at 20x magnification. Cell abundance was estimated using a formula based on Punchard [23].
where D = cell count/mL; N1 = cell count in the first observation counting chamber; N2 = cell count in the second observation counting chamber; 25x104 = constant of Hemocytometer Neubauer; n = number of counting chambers observed; F = dilution factor.
Cell Biomass Measurement
A 50 mL culture sample of Navicula sp. was filtered using pre-weighed filter paper. The biomass collected on the filter paper was then dried in an oven at 105ºC for 24 hours. After drying, the biomass (W1) was weighed using an analytical balance. The weight of the filter paper (W0), measured before filtering, was subtracted from W1 to obtain the biomass of Navicula sp. (Bi). This value was calculated using the following formula:
where Bi = Biomass (g/L); W1 = Filter paper + sample weight (g); W0 = Filter paper weight (g)
Data Analysis
The data obtained from the research were analyzed using the IBM SPSS Statistics 24 program. An independent t-test was performed with a significance level of 5%. The test involved calculating the t-value and comparing it with the critical value from the t-table. Suppose the calculated t-value is less than or equal to the critical t-value at the 5% significance level. In this case, the null hypothesis (H0) is accepted, indicating that the group or treatment has no significant effect. This outcome is labeled as “ns” (not significant). Conversely, if the calculated t-value exceeds the critical t-value, the null hypothesis is rejected, suggesting a significant effect (labeled “s”). In addition, an ANOVA test followed by post hoc analysis was conducted to examine differences among groups or treatments. A two-way univariate ANOVA was applied to assess differences in growth (abundance and biomass) between the lag and log phases as well as across treatments.
Results and Discussion
Cell Abundance of Navicula sp.
Based on the cell count data, the increase in Navicula sp. cell abundance shows a similar growth pattern, forming a sigmoid curve. This growth curve allows for the analysis of different growth phases. During the first four days, the growth of Navicula sp. did not show a significant increase in cell number (ANOVA, p = 0.884), with cell abundance ranging from 0.16 x 10⁶ cells/mL to 0.40 x 10⁶ cells/mL. This indicates that Navicula sp. was in the lag phase (Fig. 1).
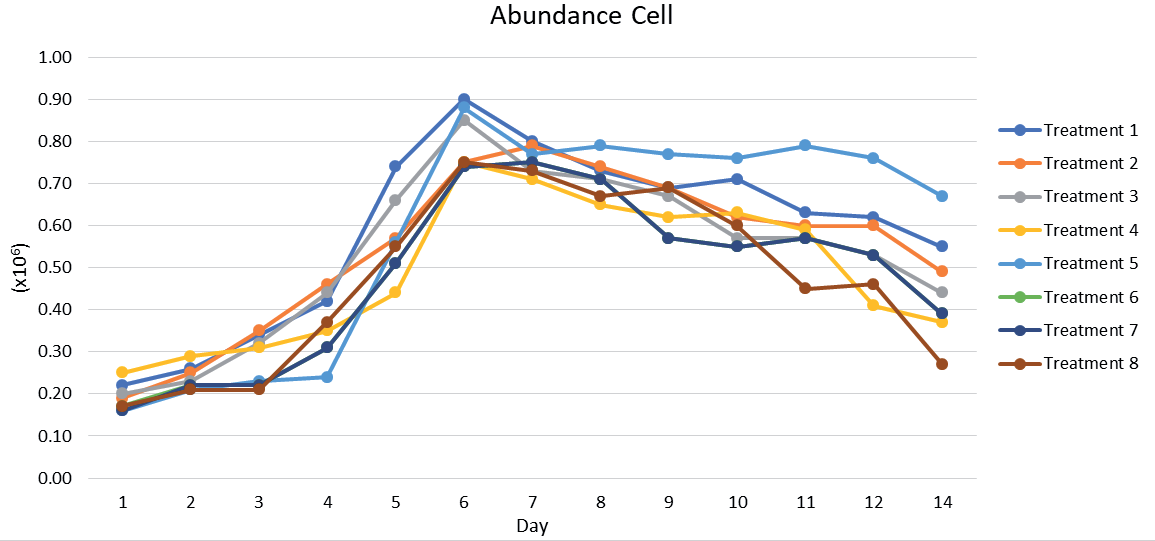
The lag phase observed in this study was slightly longer than that reported by Chen et al. [24], where Navicula sp. exhibited a 0- to 3-day adaptation period, followed by a log phase from days 3 to 10. This suggests that the Navicula sp. culture in the current study was still adapting and had not yet fully optimized nutrient utilization. When exposed to a new environmental setting, microbes, including Navicula sp., enter a lag phase during which cell growth is temporarily halted, allowing the cells to adjust to the actual conditions [25].
The growth pattern depicted in Fig. 1 shows no significant difference in cell abundance among treatments but shows a significant increase in cell abundance after the first four days (two-way univariate ANOVA; p = 0.280, p = 0.000, respectively), marking the entry of the Navicula sp. culture into the exponential (log) phase. The highest cell abundances were observed in treatments 1 (Fig 1a), 5 (Fig 1e), and 3 (Fig 1c), with values of 1.01 x 10⁶ cells/mL, 0.97 x 10⁶ cells/mL, and 0.91 x 10⁶ cells/mL, respectively. This exponential phase indicates that Navicula sp. cells successfully adapted and optimally utilized the provided nutrients. The results of this study show a slightly higher cell abundance than previous research, which reported peak populations of 0.90 x 10⁶ cells/mL on day 5 [18] and a maximum of 0.99 x 10⁶ cells/mL [26]. In contrast, the cell abundance in this study reached 1.01 x 10⁶ cells/mL, indicating a higher yield. However, this cell abundance is still significantly lower than other findings, which reported a maximum cell abundance of 108 cells/mL, starting from an initial inoculation of 103 cells/mL within just 14 days [24]. Despite Navicula sp. having a relatively long generation time of 25.3 hours (likely due to its larger cell size compared to other tested microalgae, which suggests it requires more time for cell division [24]), the increase in cell number in the present study was still significantly low.
Another factor that triggers an increase in cell abundance is the frequent harvesting of microalgae and the subsequent culture recovery process. Harvesting and recovery involve adding nutrients at varying concentrations for each treatment, stimulating cell division, and increasing cell abundance. As a result, the Navicula sp. cultivation in this study did not exhibit a declining growth phase. The harvesting and recovery processes reduce the metabolic byproducts that can inhibit growth, known as Growth Inhibitors (GIs). Replacing the culture medium with a fresh medium during harvesting reduces GI levels, increasing cell abundance [27].
Cell Biomass of Navicula sp.
Microalgae growth in culture media can also be characterized by measuring biomass [28]. The biomass of Navicula sp. was obtained once daily from the start of cultivation until the fourth day and twice daily from the fifth day until the end of cultivation. This approach allows for observing biomass decreases and subsequent increases the following day. The biomass was measured using the gravimetric method to obtain consistent cell dry weight data. In the culture of Navicula sp., the biomass displayed a fluctuating pattern, tending to decrease towards the end of the cultivation period (Fig. 2) in accordance with its growth curve pattern.
Overall, the biomass of Navicula sp. shows a trend of continuous growth, followed by a decline at the end of cultivation. Previous research reported the highest biomass at 0.90 g/L [18]. In contrast, the results of this study showed higher biomass levels across all treatments. At the start of cultivation, the biomass ranged from 0.27 g/L to 0.36 g/L. An increase in biomass at peak population occurred on day 5 across all treatments. On the 5th day, the highest biomass of Navicula sp. was observed in treatments 1, 3, 5, 4, 2, 7, 8, and 6, with respective values of 1.09 g/L, 1.05 g/L, 1.03 g/L, 1.02 g/L, 1.01 g/L, 0.96 g/L, 0.99 g/L, and 0.97 g/L (Fig. 2). The increase in biomass on the 5th day is attributed to differences in the additional Si concentration provided. Si is a crucial component in the growth of microalgae, particularly Bacillariophyceae. Adding Si to the growth medium of Navicula sp. optimizes cell wall formation and cell division. The more optimal the Si application, the better the growth [17, 21, 22].
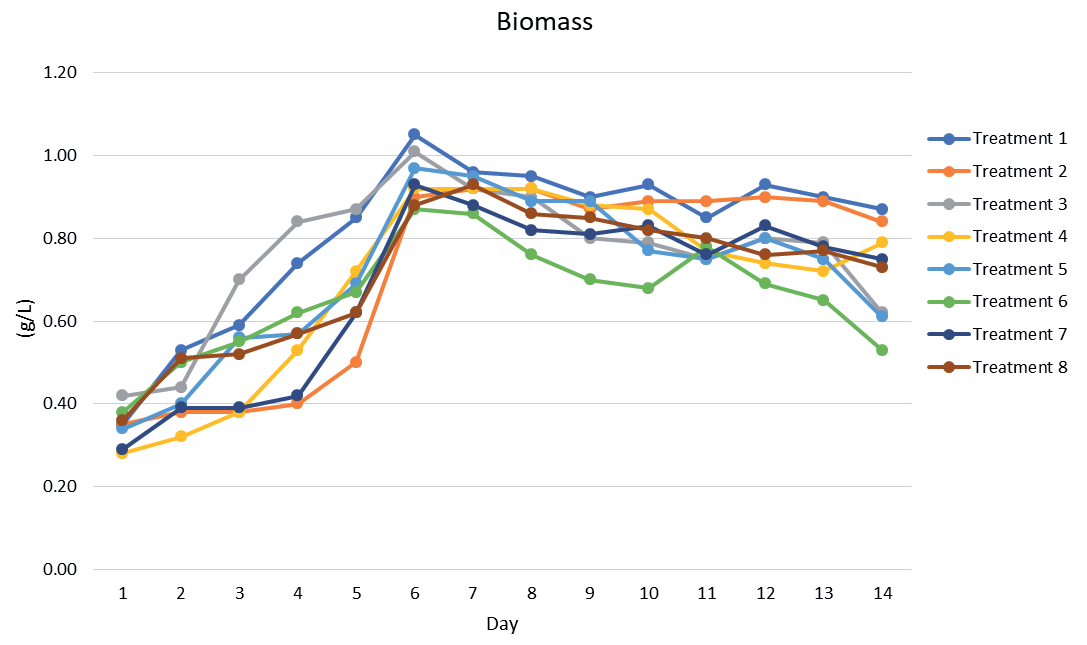
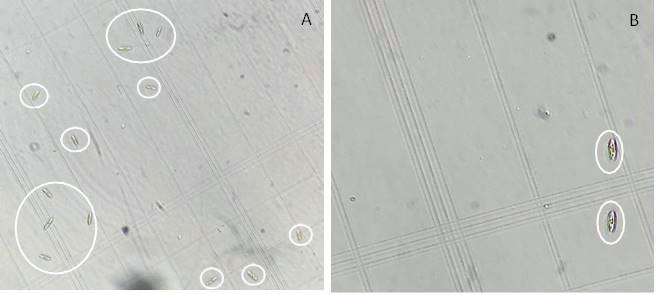
In contrast to cell abundance, which decreased towards the end of cultivation, the biomass of Navicula sp. in all treatments exhibited fluctuations throughout the cultivation period. This fluctuation is due to the recovery process, which accelerates cell growth and leads to daily variations. Microscopic observations revealed the presence of newly grown Navicula sp. cells (Fig. 3).
The growth of Navicula sp. demonstrates that new growth appears approximately ±24 hours after each harvest and continues to increase daily. However, this growth is not uniform, reflecting the ongoing recovery process across all culture treatments. This recovery process helps alleviate stress on the microalgae caused by excessive medium. Adapting these conditions is crucial for optimizing growth and metabolic activity in the microalgae. Consequently, the biomass weight in this study does not directly correspond to the cell abundance values.
Adding nutrients and regular medium replacement post-harvest promotes microalgae cell growth and increases biomass [29]. The results indicate that, in all treatments, Guillard nutrients enabled Navicula sp. to thrive in both low and high nutrient concentrations. This microalgae species can adapt its cell size according to its surrounding environmental conditions. Navicula sp. produces smaller cells when nutrient levels are low and grows larger cells when nutrients are abundant [29]. Additionally, Navicula sp. exhibits a strong affinity for higher nutrient concentrations [30].
Additionally, further analysis using an ANOVA test followed by post hoc analysis yielded results consistent with those of the t-test. The ANOVA test for biomass showed significant differences between treatments (p = 0.047). However, when followed by a Tukey HSD post hoc test, these differences were not statistically significant, with p-values of 0.347 (comparison 1) and 0.287 (comparison 2). In terms of abundance, the ANOVA indicated no significant difference between treatments (p = 0.112), and the subsequent Tukey HSD post hoc test also confirmed the lack of significance (p = 0.207).
The t-test and ANOVA results indicate significant differences in biomass across treatments, but these differences were not supported by the Tukey HSD post hoc test, suggesting that while treatment effects may vary, they are not consistently significant across comparisons. In terms of cell abundance, both the ANOVA and post hoc tests showed no significant differences between treatments, indicating a stable abundance level across the conditions tested.
Color Changes in Navicula sp. Culture
The growth of Navicula sp. in the culture media is marked by noticeable color changes over time. All treatments displayed a light brown color from the first to the fourth day due to the uniform nutrient concentration (Guillard medium) used during inoculation. From the fifth day until the eleventh day, the culture color shifted to a darker brown (Fig. 4). This change is attributed to the addition of Guillard medium and Si according to the treatment specifications.
Fig. 3.
Navicula sp. observed under the microscope: (A) magnification of 100x, (B) magnification of 400x.
After the tenth day, the culture color lightened to a brown hue, though it was not as dark as initially. This lighter color indicates that the microalgae are approaching the end of their growth phase and beginning to experience cell death. Over the entire cultivation period, the color of Navicula sp. culture remained predominantly brown. This brown coloration is primarily due to carotenoid pigments, which are more dominant than chlorophyll pigments in the cytoplasm of Bacillariophyceae cells. The concentration of carotenoid pigments correlates with cell growth, so as the number of microalgae cells increases, the intensity of the culture color becomes more pronounced [31].
Impact of Harvest Volume on Cell Abundance and Biomass of Navicula sp.
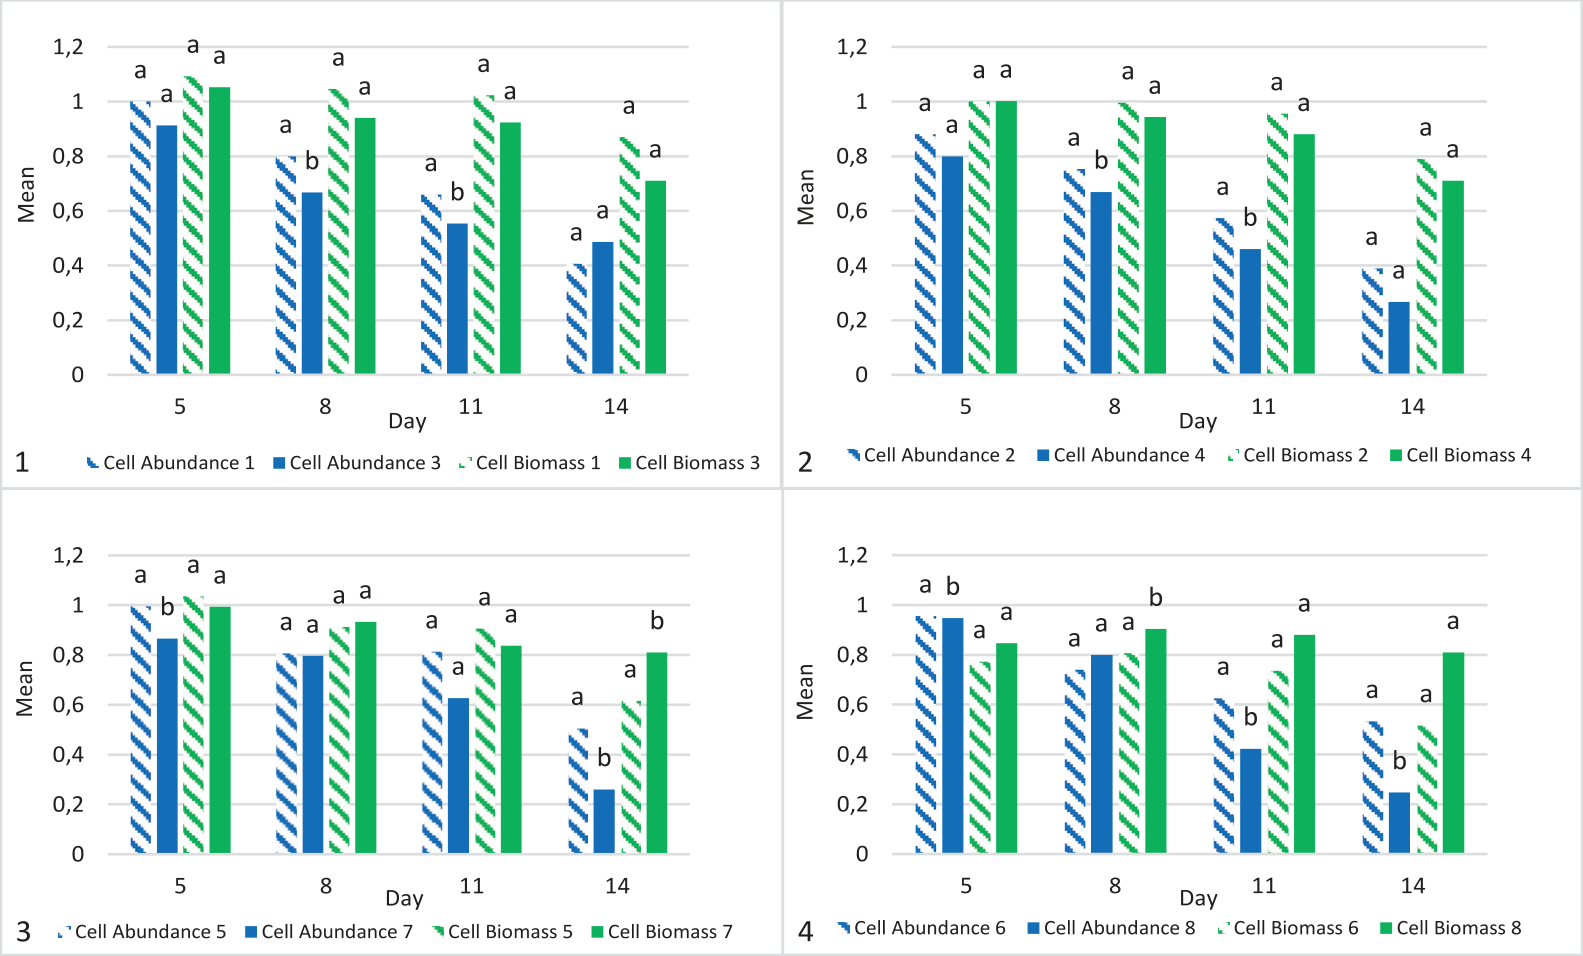
Differences in growth patterns during the cultivation of Navicula sp. may be due to variations in harvesting treatments, such as harvesting 10% versus 20% of the culture volume. Overall, the 10% harvest volume resulted in higher cell abundance and biomass of Navicula sp. However, the t-test results (2-tailed, p-value<0.05) indicate no substantial, significant difference in cell abundance except between treatments 5 and 7 on day 14 and treatments 6 and 8 on day 8. On the other hand, there are substantial significant differences in cell abundance across all treatments, particularly between treatments 1 and 3 and 2 and 4 on days 8 and 11; between treatments 5 and 7 on days 5 and 14; and between treatments 6 and 8 on days 5, 11, and 14 (Fig. 5). These results contrast with findings from other studies, where harvest treatment significantly influenced the growth of Chlorella sp. and Melosira sp., with a 10% harvest rate being particularly effective in optimizing biomass production [32]. Implementing effective harvest treatments can help reduce production costs [33], which are currently higher for microalgae than terrestrial plants. Despite the higher costs, the potential profits from microalgae products are significantly greater.
Effect of Guillard Nutrients on Cell Abundance and Biomass of Navicula sp.
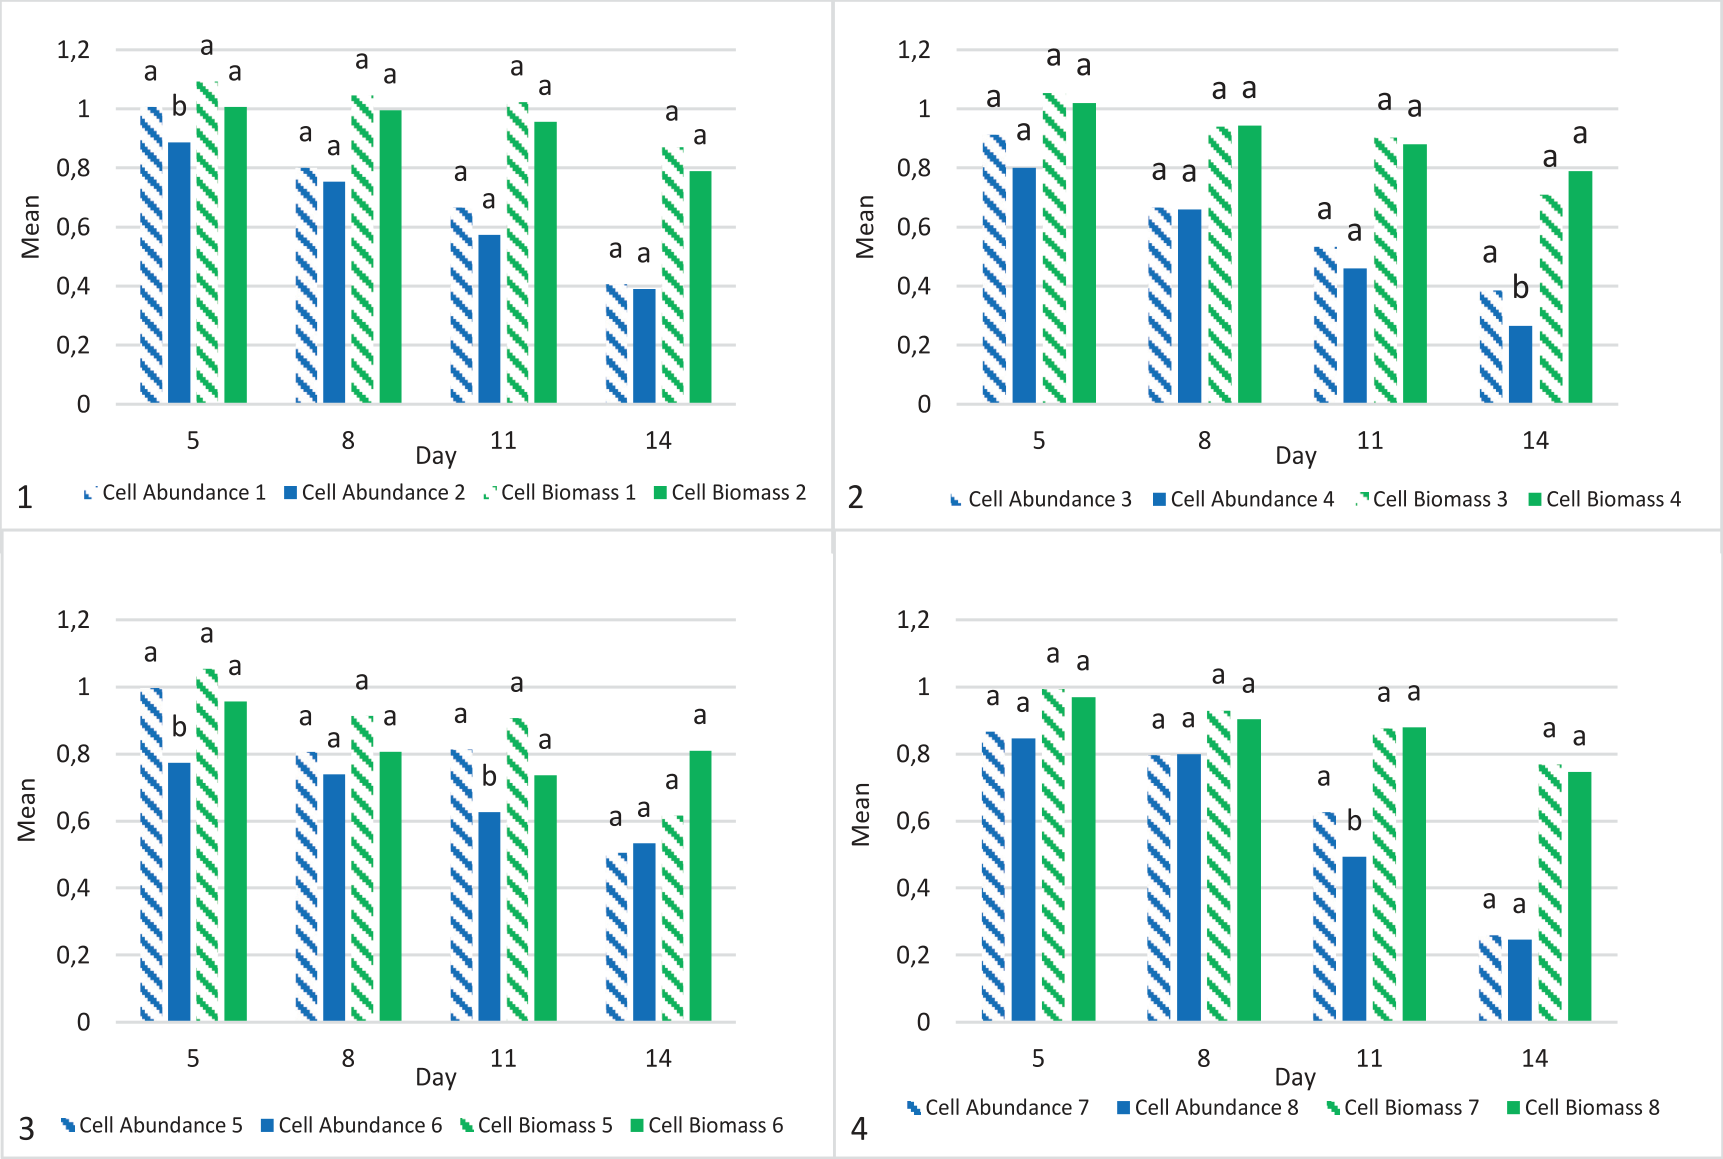
Factors affecting the growth patterns of Navicula sp. cultivation include the application of Guillard nutrients. In general, a nutrient top-up to 2 L culture resulted in higher cell abundance and biomass of Navicula sp. compared to 10% and 20% nutrient provision. However, the t-test results (two-tailed, p-value<0.05) show no significant difference in cell abundance. Additionally, there were no significant differences in cell abundance across all treatments, except between treatments 1 and 2 on day 5, treatments 3 and 4 on day 14, and treatments 5 and 6 on days 5 and 11, as well as between treatments 7 and 8 on day 11 (Fig. 6).
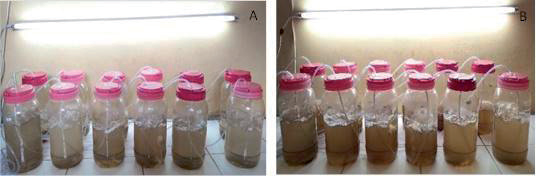
Fig. 5.
Results of the independent t-test on the effect of harvesting (10% and 20%) on the cell abundance and biomass of Navicula sp. over different days. The numbering 1-4 corresponds to the treatments as follows: 1 and 3, 2 and 4, 5 and 7, and 6 and 8, respectively. Different letters indicate significant differences (p<0.05).
However, the periodic addition of Guillard nutrients played a crucial role in enhancing cell abundance and biomass. Variations in Guillard nutrient concentrations among treatments were found to influence the biomass productivity of Navicula sp., which is a key factor in evaluating the feasibility of microalgae culture utilization [34]. Additionally, increased biomass productivity is often associated with higher production of unsaturated fatty acids in algal cultures [31].
Fig. 6.
Independent t-test results on the effect of Guillard nutrient administration (100% top up with 10% and 20% top up) on cell abundance and biomass of Navicula sp. over different days. The numbering 1-4 corresponds to the treatments as follows: 1 and 2, 3 and 4, 5 and 6, and 7 and 8, respectively. Different Letters Indicate Significant Differences (p<0.05).
Guillard nutrient is a complex medium formulated with a range of vitamins and trace elements. Essential macronutrients required by Navicula sp. include nitrogen (N), phosphorus (P), potassium (K), sulfur (S), sodium (Na), silicon (Si), and calcium (Ca). Nitrogen, phosphorus, and sulfur are crucial for protein synthesis, with phosphorus playing a key role in energy transfer and nucleic acid biosynthesis [3]. Potassium is involved in carbohydrate metabolism, while sodium is important for chlorophyll formation.
Compared to other media, Guillard nutrient offers superior benefits due to its comprehensive macronutrient profile. The solution includes sodium from two sources, NaNO3 and NaH2PO4, and provides significantly more silicon than media like Conway (nearly a thousand times more). Additionally, nitrogen is exclusively present in the Guillard medium [35].
Micronutrients essential for cultivating Navicula sp. include iron (Fe), zinc (Zn), manganese (Mn), copper (Cu), molybdenum (Mo), cobalt (Co), and boron (B) [36]. Guillard nutrient contains a diverse range of these micronutrients, which are not commonly found in other media. Iron is vital for chlorophyll formation and energy conversion in photosynthesis and respiration, and it is a component of cytochromes. The inclusion of Fe with Na2EDTA ensures its stability over time, as EDTA acts as a pH buffer and chelating agent to keep Fe in solution. Zinc is crucial for regulating the rate of microalgae photosynthesis [37].
Vitamin B-12 is commonly used to enhance growth by stimulating photosynthesis, while Thiamin HCl accelerates cell division. Guillard nutrients contain unique variations of Vitamin B-12, Thiamin HCl, and Biotin, which are not present in other microalgae growth media [35].
Impact of Silicon (Si) Addition on Cell Abundance and Biomass of Navicula sp.
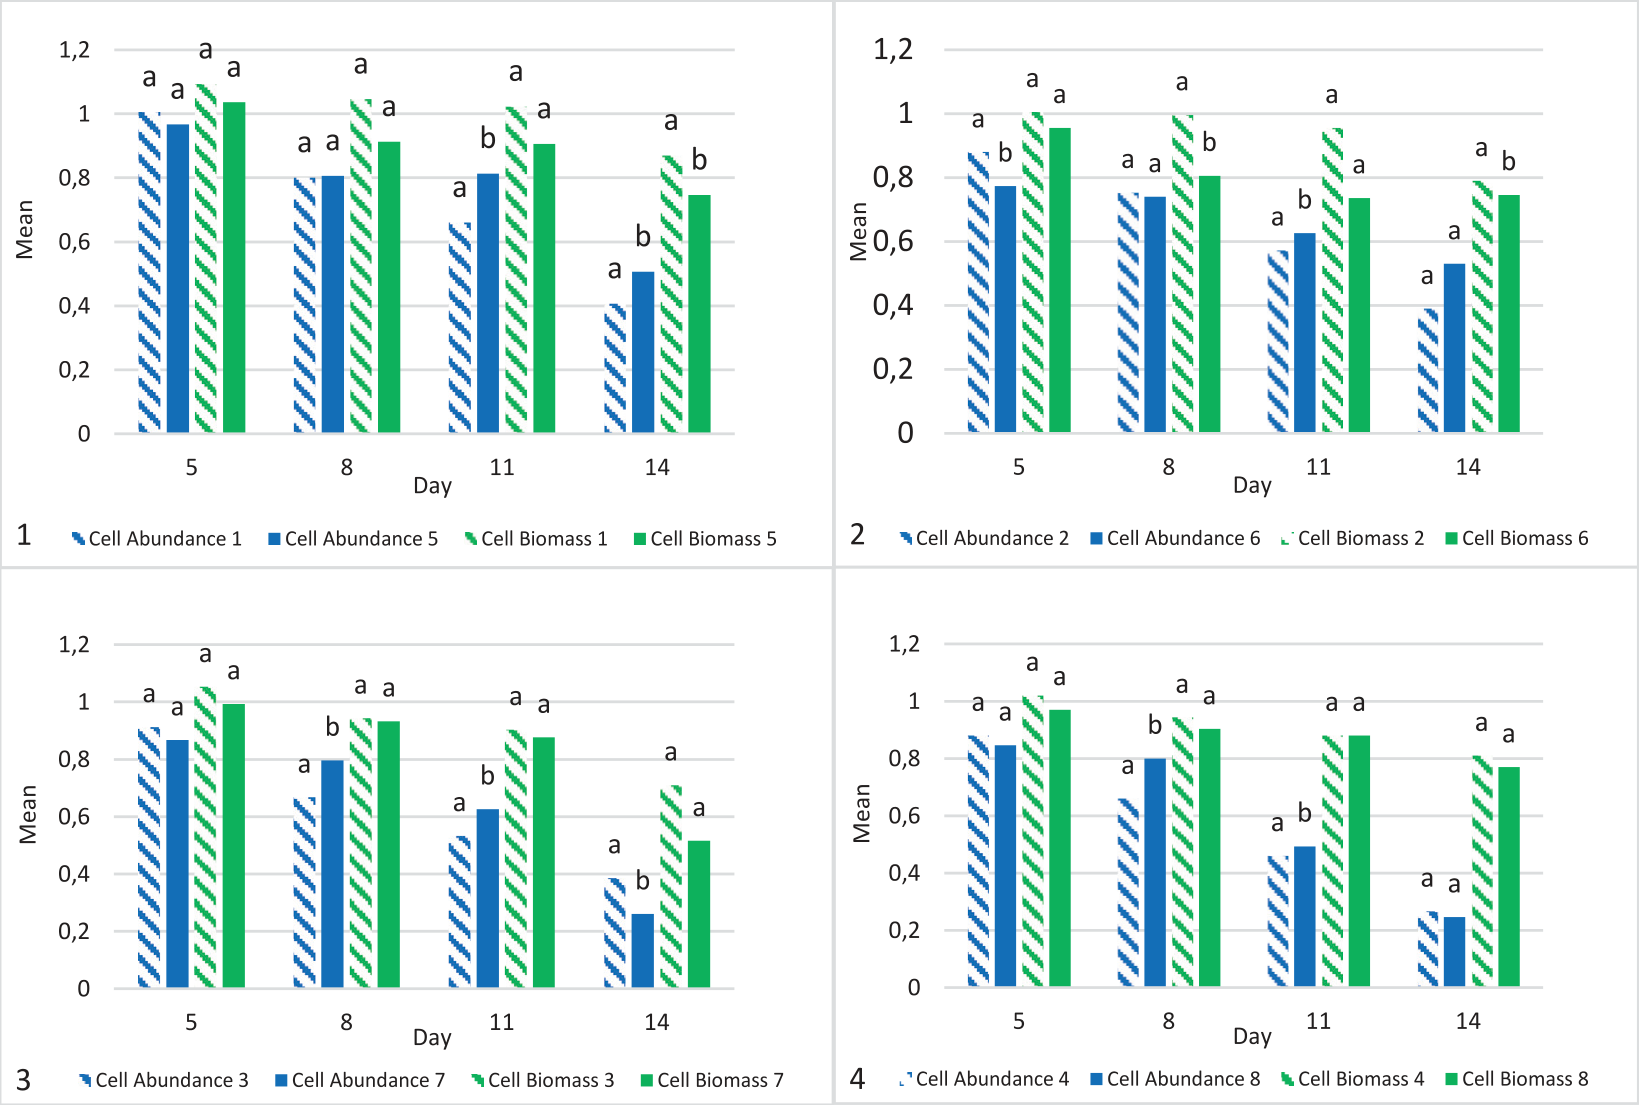
The variations in growth patterns of Navicula sp. were influenced by the different silicon (Si) concentrations administered, specifically 0.5 g/L and 0.05 g/L. Overall, a higher Si concentration of 0.5 g/L generally resulted in greater cell biomass than 0.05 g/L. T-test results (2-tailed, p-value<0.05) showed significant differences in cell biomass on day 14 between treatments 1 and 5 and treatments 2 and 6, as well as on day 8 between treatments 2 and 6. Interestingly, there were also significant differences in cell abundance, where the administration of 0.05 g/L Si led to higher cell abundance of Navicula sp. compared to 0.5 g/L, particularly on day 11 between treatments 1 and 5 and between treatments 2 and 6, on day 14 between treatments 2 and 6, and on days 8 and 11 between treatments 3 and 7 and between treatments 4 and 8 (Fig. 7).
The increase in biomass observed on the 5th day can be attributed to the varying concentrations of Si added to the growth medium. Si is a vital element for microalgae growth, especially in Bacillariophyceae, as it plays a key role in optimizing cell wall formation and cell division. The more effectively Si is administered, the better the growth [17, 21, 22]. However, the test results on the effect of Si administration on cell abundance and biomass (Fig. 7) showed no significant differences in the average values (2-tailed Sig > 0.05). Variations in cell abundance were noted on days 5, 8, 11, and 14. These findings suggest that Si administration did not significantly influence the growth pattern of Navicula sp. in this study, which contrasts with previous research [17, 21, 22], where Si played a more critical role in enhancing growth.
Fig. 7.
Independent t-test Results on the Effect of Si (0.5 g/L and 0.05 g/L) on Cell Abundance and Biomass of Navicula sp. Over Different Days. The numbering 1-4 corresponds to the treatments as follows: 1 and 5, 2 and 6, 3 and 7, and 4 and 8, respectively. Different letters indicate significant differences (p < 0.05).
Standardizing Si concentration is crucial for large-scale microalgae cultivation. Although Si is a key element for microalgae, particularly diatoms, the research suggests that a concentration of 0.05 g/L of Si is sufficient for optimizing Navicula sp. biomass. This approach could help reduce production costs while maintaining effective biomass utilization.
Temperature of Navicula sp. Culture
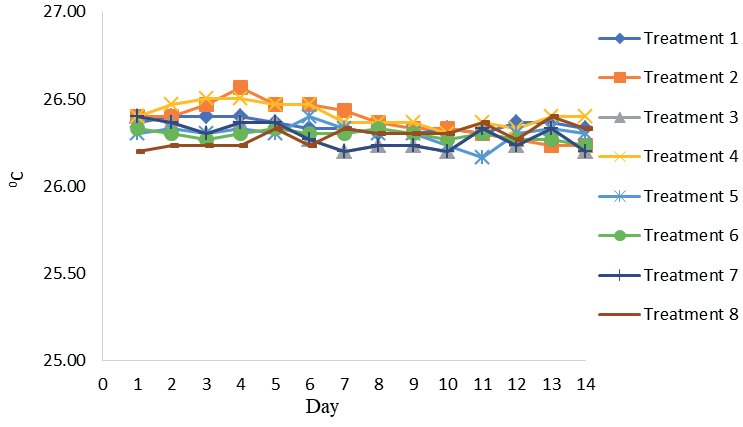
Temperature is a key external factor influencing the growth of Navicula sp. during cultivation. Daily temperature measurements were taken using a water thermometer immersed in each culture. The results indicate that the temperature range remained relatively consistent across all treatments (Fig. 8).
The optimal temperature range for microalgae growth is 25-40ºC [26]. In this study, the temperature across all treatments remained relatively stable, ranging from 26.17 to 26.50ºC (Fig. 8). This stability indicates that temperature dynamics were minimal. Typically, metabolic processes can influence the cultivation temperature of microalgae; for instance, catabolic processes, which involve nutrient utilization, can increase the medium’s temperature due to their exothermic nature. However, in this study, temperature variations were more influenced by room temperature (affected by air conditioning) than by metabolic activities. This suggests that the temperature range in this study did not significantly impact the metabolic processes of Navicula sp.
Fig. 8.
Temperature of Navicula sp. Culture Over 14-Day Incubation Across Treatments Listed in Table 1.
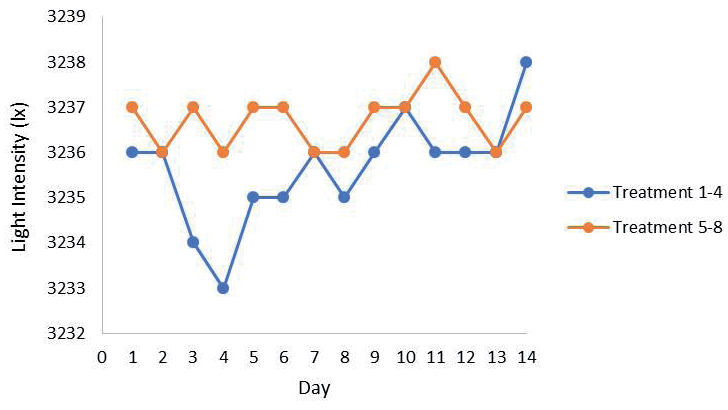
Light Intensity
One crucial factor in microalgae cultivation is light intensity [28]. Typically, laboratory-scale microalgae cultivation utilizes Tubular Lamps (TL) to mimic sunlight, which is essential for photosynthesis [34].
The light intensity in each treatment ranged from 3,234 to 3,238 lux (Fig. 9). This level of light intensity is considered stable and suitable for the growth of Navicula sp., aligning with the findings of Latuconsina et al. [34]. Their research indicated that the optimal light intensity for cultivating Navicula sp. on a laboratory scale falls within the range of 2,000 to 8,000 lux.
Conclusions
The study highlights the importance of both harvest volume and silicon (Si) concentration in influencing the growth and biomass production of Navicula sp. A 10% harvest volume with nutrient top-up generally resulted in higher cell abundance and biomass than a 20% harvest volume, suggesting that smaller harvest volumes can better sustain growth. While a higher Si concentration (0.5 g/L) typically resulted in greater biomass, there were instances where a lower Si concentration (0.05 g/L) led to higher cell abundance, indicating a complex interaction between Si concentration and growth that other environmental or metabolic factors may influence. This suggests that Si concentration significantly impacts growth, but its effects are not uniform and may depend on other conditions within the cultivation environment. To optimize Navicula sp. cultivation in large-scale photobioreactor systems, careful management of harvest volumes and Si concentrations is essential. The study also found that stable environmental conditions, such as a temperature range of 26.17-26.50ºC and light intensity of 3,234-3,3238 lux, were conducive to healthy Navicula sp. growth, aligning with established optimal ranges. While nutrient concentration, harvest volume, and light intensity are critical for effective cultivation, the study suggests that the role of Si administration should be further explored to better understand its varying effects on microalgae growth. Future research could investigate different Si concentrations or alternative nutrient strategies to enhance Navicula sp. cultivation, emphasizing the need for stable environmental parameters to ensure successful microalgae production.

