


Introduction
The natural circulation of water on Planet Earth is affected by various factors, including cold and heat, the three states of matter, and human use, to name but a few, so the natural replenishment of groundwater is slowing down. The water cycle is considered a biogeochemical cycle as it is part of the Earth’s biological, geological, and chemical systems; such systems are the foundation of life on Earth. Statistically, it is mentioned that two-thirds of the Earth's surface is covered by water; however, only 0.26% of it is freshwater for human consumption, according to the study carried out by the research and analysis service [1].
Different civilizations’ living environments have evolved over time due to changes in environmental and social conditions, population growth, scientific, technological, and political developments, customs and traditions, and others. In the 1930s, it was unimaginable that drinking water could be purchased in bottles. Nowadays, it is commonplace to buy bottled water for human consumption at a high cost, and the imbalance
Introduction
The natural circulation of water on Planet Earth is affected by various factors, including cold and heat, the three states of matter, and human use, to name but a few, so the natural replenishment of groundwater is slowing down. The water cycle is considered a biogeochemical cycle as it is part of the Earth’s biological, geological, and chemical systems; such systems are the foundation of life on Earth. Statistically, it is mentioned that two-thirds of the Earth's surface is covered by water; however, only 0.26% of it is freshwater for human consumption, according to the study carried out by the research and analysis service [1].
Different civilizations’ living environments have evolved over time due to changes in environmental and social conditions, population growth, scientific, technological, and political developments, customs and traditions, and others. In the 1930s, it was unimaginable that drinking water could be purchased in bottles. Nowadays, it is commonplace to buy bottled water for human consumption at a high cost, and the imbalance between the use and natural regeneration of water has led to a significant decline in this vital resource.
Technological development in many areas is advancing rapidly, but progress in water management remains slow. In future smart cities, all water-related systems – collection, treatment, distribution, filtration, and consumption – will be integrated into interconnected, automated networks designed to regenerate this essential resource.
In this paper, we propose using different types of water to optimize freshwater use through a mathematical model. This would allow a balance between water’s natural regeneration and its proper use for human consumption.
Materials and Methods
The distribution and use of water is currently a worldwide challenge. Statistics on the availability of this vital resource show that supply in some localities has declined and in others is altogether absent due to various factors. One of these is inefficient distribution networks caused by lack of maintenance, leaks, interruptions from construction, hazardous areas, insufficient infrastructure, and contamination, to name but a few. Whatever the cause, the failure to distribute this vital resource is impacting humanity so severely that access to drinking water has fallen dramatically. In 2023, the United Nations (UN) published a report on global water distribution. The situation, as can be imagined, is unfavorable: around 26% of the world’s population lacks safe drinking water, and this figure is set to rise inexorably in the coming decades [2].
Despite efforts to improve distribution networks and prevent leaks and aquifer contamination, the rise in population and demand for water and a lack of water‐ use culture mean that global per capita consumption should not exceed 50 liters per day for essential needs, according to the AQUAE Foundation [3, 4]. Additional requirements for industry, livestock, agriculture, and other uses exacerbate this. If these trends persist, coupled with inadequate infrastructure and recovery methods, the WHO and UNICEF warn that by 2030, billions will lack sufficient water to meet vital needs [5].
Addressing this global challenge, this article proposes a mathematical model to optimize potable water use by allocating alternative water types to secondary and tertiary demands. The objective is to preserve drinking water supplies for critical uses while satisfying other human needs with non-potable sources.
A review of the literature on the use and optimization of water reveals that recent population growth has increased the demand for drinking water in urban areas, thus underlining the need for more efficient water-management systems. Bouramdane [6] proposes a multi-criteria decision-making methodology to evaluate water-management strategies for smart cities, offering an alternative to traditional methods. Similarly, Figueiredo et al. [7] introduce the Water Wise System, a software platform that integrates Internet of Things (IoT) and artificial intelligence (AI) technologies, including machine learning and deep learning, to address water-related challenges and enhance predictive capabilities in smart cities. Pavolová et al. [8] emphasize the economic benefits of utilizing rainwater to reduce household drinking-water costs, suggesting its application in toilets, washing machines, and irrigation to decrease wastewater generation. Likewise, Quon and Jiang [9] advocate the use of non-traditional water sources such as atmospheric and condensate collection, rainwater, recycled wastewater, and greywater and underscore the necessity of clear policy guidance, on-site maintenance, rapid monitoring technologies, and transparent reporting systems to ensure water quality. Zhang et al. [10] assert that decentralized water treatment, while not a new concept, can effectively minimize potable water consumption through treated greywater recycling, which they argue is more efficient than rainwater harvesting in Beijing, China. Krishnan et al. [11] explore recent trends in wastewater recycling, rainwater harvesting, and irrigation management, highlighting the role of AI and deep learning in enhancing water distribution systems. From a computational perspective, Lazuka et al. [12] propose graph-theory-based algorithms, including Dijkstra’s and Bayesian network algorithms, for water management modeling. Meanwhile, Tzatchkov and Izurieta [13] developed a computational system utilizing the Newton–Raphson method for hydraulic-network calculations, incorporating hourly demand variations and tank operations. Montesinos-Barrios et al. [14] propose a genetic algorithm-based model for optimizing water-distribution networks in cost optimization. Arellano and Peña [15] introduce a linear regression model for estimating drinking water consumption to ensure resource allocation efficiency. Dasallas et al. [16] propose integrating information and communication technologies (ICT) to enhance water-management efficacy by providing real-time data for decision-making processes, thereby improving the coordination of diverse water-resource components such as stormwater, wastewater, and recycled water systems. Zhang et al. [17] developed a graph-theory-based optimization model for urban water-supply systems, demonstrating a 1.4% improvement in cost-effectiveness in a case study of Lishui City, which revealed that strategic water allocation can significantly enhance system resilience and efficiency. Nwokediegwu et al. [18] emphasize the importance of green infrastructure and integrated water-resource management. Their findings suggest that stakeholder engagement and innovative policies are essential for effective water management. Hidayat and Kurniawan [19] propose smart water-circulation systems that integrate recycling technologies with real-time monitoring to optimize water use and enhance security in urban areas, addressing the challenges of water scarcity. Beatley [20] advocates ecological planning as a holistic approach to urban water management, addressing both excess and scarcity to emphasize restoring natural environments and sustainable water supply systems. Akhayeva et al. [21] explore the role of big data and machine learning in optimizing water-resource management in smart cities, aiming to highlight the potential of these technologies for predictive analytics to improve water-consumption forecasting and resource allocation. Several researchers have also addressed hydrological modeling. Pérez-Martín [22] develops a tool to mathematically simulate the hydrological cycle and water quality in large groundwater basins and river aquifers. Vegas-Niño [23] proposes a mathematical model for monitoring water-distribution networks, while Villena-Martínez [24] focuses on optimizing reverse-osmosis efficiency for mineral removal in potable water sources. Additionally, Pérez-Martín [22] presents a distributed simulation model of the hydrological cycle and water quality using large-basin information systems.
From the literature review, several studies have examined drinking-water distribution models and the application of techniques and algorithms for network management. Some authors explore the incorporation of desalinated water, rainwater, and greywater. To date, no mathematical model has been proposed specifically to optimize potable water use, as we propose in this research.
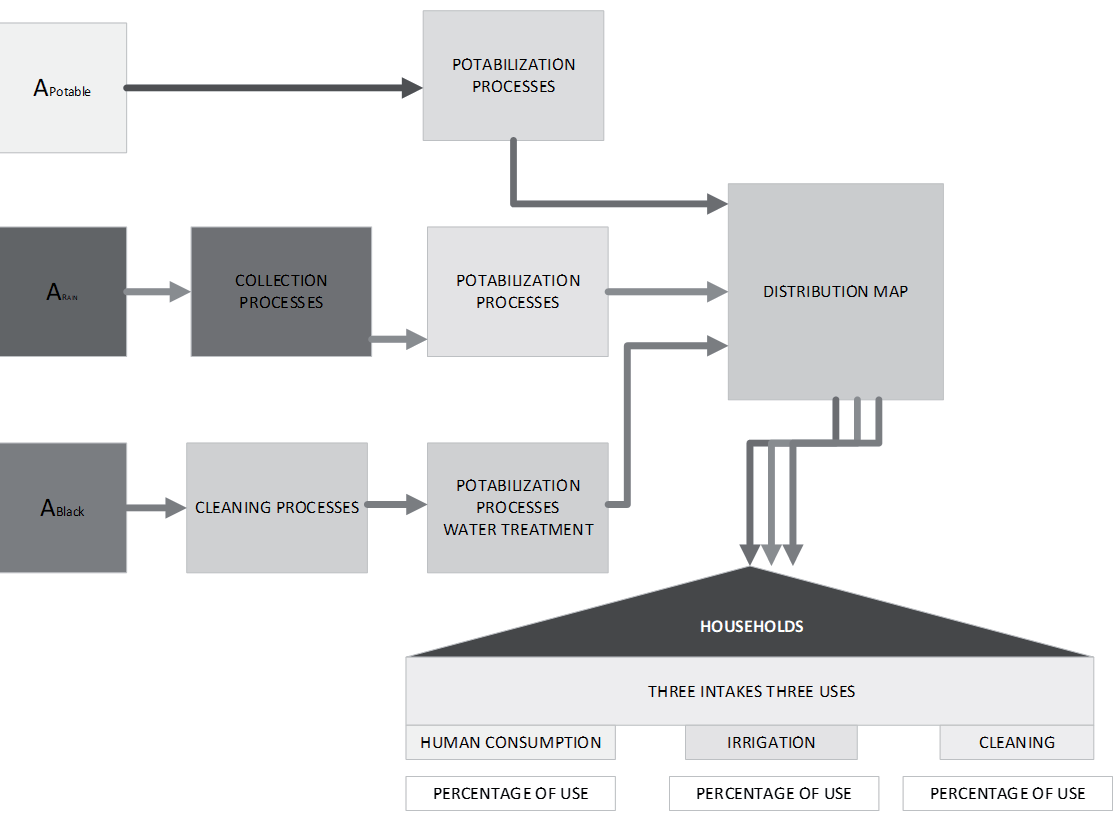
Globally, drinking water is currently reserved for human consumption; however, shortages have prompted the use of alternative sources, such as rainwater and recycled water, for non-essential activities. Implementing this approach requires modifying the distribution infrastructure to three separate pipelines – one for each water type – with corresponding household intakes and storage tanks, as illustrated in Fig. 1. In this model, potable water at the main intake supplies primary uses (drinking and cooking), rainwater is allocated to secondary uses (irrigation, livestock watering, and personal hygiene), and treated recycled water serves tertiary uses (sanitation, cleaning, and energy production). This scheme aims to reduce reliance on freshwater sources and permit natural replenishment of groundwater, rivers, and reservoirs.
Globally, water use follows patterns defined predominantly by agricultural needs. Approximately 70% of all freshwater abstracted goes to agriculture, a crucial sector that underpins food production and many regions’ economies. A further 20% is used in industry, where water is essential for processes such as machine cooling, manufacturing, and product processing. The remaining 10% is allocated to municipal uses, ranging from domestic supply to public utilities, reflecting the direct demand of the population. These percentages highlight the critical importance of sustainably managing water resources to support diverse uses without compromising future water availability [25].
Currently, population growth correlates with drinking water consumption. If demand for drinking water exceeds supply, water supply problems are anticipated. According to the Mexican Institute for Competitiveness (IMCO), the maximum volume of water that can be sustainably abstracted per year without harming the ecosystem is termed “renewable water”; it is replenished by rainfall [26]. Assuming an average per capita water use of 3,000 m³ annually [26] and a population of 131 million [27], this equates to approximately 436 thousand cubic hectometers per year.
The proposed mathematical model is a decision-optimization model whose objective function minimizes potable water use by supplementing it with rainwater and recycled water for various human activities:
Objective function:
Subject to:
Where z: Total cost of water supply, xij: Amount of water from source i used by sector j, Cij: Cost of the amount of water consumed by sector j of source i, COij: Cost associated with the use and treatment of water from source i by sector j per liter of consumption of type xij, CEij: Cost of the environmental impact of using water from source i in sector j per liter of consumption of type xij, CMij: Cost of maintaining the supply and treatment of water from source i for sector j per liter of consumption of type xij, CENij: Cost of energy used to supply and treat water from source i for sector j per liter of consumption of type xij. In the optimization function, the Greek letters represent the weights assigned to each term, indicating their relative importance. α: Weight assigned to minimizing the use of drinking water, β: Weight for the cost associated with the use and treatment of water, γ: Weight given to the environmental impact of water management, δ: Weight for the cost of maintaining infrastructure and operations related to water, ε: Weight assigned to energy use in the water treatment and distribution process.
Where: Condition 0. Positivity condition: In Equation (2), i denotes the water source (drinking water, rainwater, or wastewater), while j represents the sector (residential, agricultural, or industrial). The decision variable xij corresponds to the volume of water from source i allocated to sector j. This allocation must satisfy the non-negativity constraint, ensuring that all water distribution values remain non-negative, i.e., xij≥0, to maintain the model’s feasibility and physical validity.
Condition 1. Water availability from each source: In Equation (3), the total water extracted from each source i must not exceed its available supply Ai. This restriction ensures sustainable resource management, regulatory compliance, and ecological balance, preventing over-extraction that could compromise long-term water availability and resilience to environmental challenges [28].
Condition 2. Demand from each sector: In Equation (4), the water supplied to each sector j must meet its total demand Dj. This ensures the fulfillment of essential needs, economic productivity, and equitable distribution, preventing conflicts and promoting sustainable resource management [29].
Condition 3. Treatment capacity: In Equation (5), the volume of water treated at each plant must not exceed its maximum capacity Ct. Here, Tij represents the proportion of treated water from source i allocated to sector j. This constraint ensures operational efficiency, regulatory compliance, and infrastructure safety while maintaining water quality and environmental sustainability.
Condition 4. Water quality cost: In Equation (6), the water supplied to each sector must meet quality standards, ensuring that its quality cost Qij does not exceed the maximum limit Qmax. Here, Qij is defined as a percentage of COij, the water treatment cost per liter for source i and sector j. This constraint safeguards public health, environmental protection, and regulatory compliance while maintaining industrial and agricultural efficiency [30].
Condition 5. Maximum allowed cost: In Equation (7), the total cost of the water supply must not exceed the maximum budget B. This restriction ensures sustainable financial management, efficient resource allocation, and compliance with budgetary constraints, promoting the long-term viability of water management operations.
Condition 6. Environmental sustainability: In Equation (8), the total environmental impact of water use must not exceed the sustainable limit Emax. This restriction ensures ecosystem preservation, regulatory compliance, and sustainable resource management while mitigating climate change and protecting public health.
Condition 7. Equity in distribution: In Equation (9), water distribution must be equitable across sectors to ensure social justice, economic stability, and sustainable resource management. This restriction reduces conflicts, enhances well-being, and builds resilience to climate change, supporting long-term environmental and societal health.
Condition 8. Energy efficiency: In Equation (10), energy consumption for water supply and treatment must not exceed the allowed limit ENlim. This ensures environmental sustainability, cost efficiency, regulatory compliance, and system reliability while fostering technological innovation and reducing operational risks.
Condition 9. Use of wastewater: In Equation (11), at least a minimum proportion Rmin of the total water used must come from recycled sources R. This constraint promotes water conservation, environmental protection, and sustainable management while reducing treatment costs and enhancing energy efficiency [4].
Condition 10. Infrastructure capacity: In Equation (12), the volume of water transported must not exceed the infrastructure’s maximum capacity Cinfra. Here, Trij represents the percentage of water transported from source i to sector j. This constraint ensures operational efficiency, prevents overloading, and supports long-term sustainability in water distribution systems.
Condition 11. Limitation of drinking water use: In Equation (13), potable water consumption xPj must be minimized and not exceed the maximum limit Pmax. This ensures resource conservation, cost efficiency, regulatory compliance, and sustainable water management while prioritizing potable water for essential needs.
Condition 12. Use of rainwater: In Equation (14), a minimum amount of rainwater Lmin must be allocated to specific sectors. This promotes water conservation, reduces stormwater runoff, and enhances sustainability while ensuring regulatory compliance and economic efficiency.
Condition 13. Maximum daily consumption by sector: In Equation (15), water consumption per sector must not exceed the daily limit Dijmax. This ensures resource sustainability, operational efficiency, equitable distribution, and environmental protection while supporting long-term water availability [4].
Condition 14. Industrial water used: In Equation (16), industrial water consumption must remain within the maximum allowable limit Imax. This ensures sustainable resource use, equitable distribution, environmental protection, and regulatory compliance while promoting efficiency and innovation.
Condition 15. Aquifer protection: In Equation (17), water extraction from aquifers xAj must not exceed the maximum allowable limit Amax . This prevents overexploitation, preserves water quality, and ensures long-term ecological and economic sustainability.
Condition 16. Maintenance of water quality: In Equation (18), the supplied water must meet the minimum quality standard Qmin. This ensures public health, environmental protection, regulatory compliance, and long-term sustainability while maintaining consumer confidence and economic stability.
Condition 17. Storage capacity: In Equation (19), the stored water Sij must not exceed the maximum storage capacity Smax This ensures operational efficiency, prevents structural damage, and supports flood management, regulatory compliance, and long-term sustainability.
Condition 18. Delivery time: In Equation (20), the water supply time tij from source i to sector j must not exceed the required limit Treq. This ensures operational efficiency, service reliability, regulatory compliance, and optimized resource use while preventing economic losses and safeguarding public health [29].
Condition 19: Proportion of irrigation use: In Equation (21), the water allocated for irrigation must meet the minimum limit Imin to ensure sustainable distribution. This prevents overuse, protects ecosystems, supports agricultural stability, and ensures compliance with regulations and climate adaptation.
Condition 20. Resilience to droughts: In Equation (22), the system must maintain a minimum water reserve Rdrought to ensure supply during droughts. This safeguards public health, supports agriculture, protects the environment, and enhances economic and climate resilience.
Condition 21. Energy cost optimization: In Equation (23), the energy cost CEij for water supply and treatment must not exceed the maximum allowable limit Ecostmax. This ensures financial sustainability, reduces environmental impact, enhances efficiency, and supports long-term resilience and innovation.
Condition 22. Restriction of carbon emissions: In Equation (24), carbon emissions CO2ij from water treatment and distribution must not exceed the maximum limit CO2max. This ensures environmental sustainability, regulatory compliance, cost efficiency, and climate change mitigation while promoting long-term resilience.
Condition 23. Proportion of surface water storage allowed: In Equation (25), the use of surface water from sources S must not exceed the maximum allowable limit Smax. This ensures sustainable resource management, flood risk control, water quality preservation, and regulatory compliance while supporting economic and agricultural stability.
Condition 24. Wastewater pollution control: In Equation (26), the amount of contaminated wastewater Wij from source i to sector j must not exceed the maximum limit Wmax. This ensures public health protection, environmental sustainability, regulatory compliance, and pollution prevention while supporting economic and community well-being.
Condition 25. Reusability: In Equation (27), the amount of reused water Rij from source i to sector j must meet the minimum reuse capacity Rmin. This ensures optimal infrastructure use, economic efficiency, regulatory compliance, and environmental sustainability while enhancing resilience to water scarcity.
Condition 26. Compliance with local regulations: In Equation (28), water supply and usage must adhere to local and regional regulations, ensuring compliance with the legal limit Lnorm. This guarantees legal adherence, public health protection, environmental sustainability, and equitable water distribution while supporting risk mitigation and community trust.
Condition 27. Water balance in the system: In Equation (29), the system must maintain equilibrium between water input and output, ensuring that the amount of water leaving the system yij aligns with sustainable management. This supports resource conservation, operational efficiency, environmental protection, and long-term water availability [29].
Condition 28. Equitable distribution in times of scarcity: In Equation (30), water distribution must remain equitable among critical sectors during scarcity. This ensures social justice, public health protection, economic stability, and resilience to climate change while preventing conflicts and maintaining agricultural sustainability.
Condition 29. Maintenance of strategic reserves: In Equation (31), a minimum strategic water reserve Rstrategic must be maintained for emergencies. This ensures preparedness, public health protection, continuity of essential services, and resilience to climate change while supporting economic stability and risk mitigation.
Condition 30. Minimizing losses due to leaks: In Equation (32), water losses due to leaks Lij from source i to sector j must not exceed the maximum allowable limit Lmax Here, i represents the water source (drinking water, rainwater, or recycled water), and j denotes the sector (residential, agricultural, or industrial). This constraint ensures water conservation, economic efficiency, infrastructure longevity, and environmental protection while mitigating scarcity risks and supporting sustainability goals.
Condition 31. Maximizing greywater use: In Equation (33), the proportion of greywater used must not exceed the maximum allowable limit Gmax. This ensures water conservation, environmental sustainability, regulatory compliance, and wastewater reduction while promoting innovative water management and resilience to climate change.
Condition 32. Per capita consumption limit: In Equation (34), the per capita water consumption, determined by the population of sector j (Pj), must not exceed the maximum allowable limit Cmax. This ensures resource sustainability, equitable distribution, environmental conservation, and regulatory compliance while promoting long-term water efficiency and resilience.
Condition 33. Use of water-saving technologies: In Equation (35), the amount of water saved through technologies Tsaveij at source i for sector j must meet or exceed the minimum required savings Tmin. This ensures resource conservation, economic efficiency, regulatory compliance, and technological innovation while reducing water waste and supporting sustainable development goals.
Condition 34. Protection of aquatic ecosystems: In Equation (36), water extraction must not exceed the safe limit Esafe to prevent negative impacts on aquatic ecosystems. This ensures biodiversity conservation, water quality maintenance, regulatory compliance, and climate resilience while supporting sustainable resource management.
Condition 35. Continuous improvement in water management: In Equation (37), improvement measures Mij implemented at source i for sector j must meet or exceed the minimum required level Mmin. This ensures operational efficiency, resource conservation, regulatory compliance, and technological advancement while fostering long-term sustainability and resilience in water management.
Condition 36. Sediment control: In Equation (38), the sediment content SEDij in water from source i for sector j must not exceed the maximum allowable limit SEDmax. This ensures water quality, public health protection, environmental sustainability, and infrastructure longevity while optimizing operational efficiency and regulatory compliance.
Condition 37. Stormwater management: In Equation (39), stormwater from sources P must meet the minimum required capture and use Pmin. This ensures water conservation, flood risk mitigation, groundwater recharge, and environmental sustainability while supporting regulatory compliance and climate resilience.
Condition 38. Avoid salinization: In Equation (40), the salinity level SALij in water from source i for sector j must not exceed the maximum allowable limit SALmax. This ensures soil health, agricultural productivity, water quality, and environmental protection while supporting regulatory compliance and sustainable development.
Condition 39. Nitrate reduction: In Equation (41), the nitrate concentration NO3ij in water from source i for sector j must not exceed the maximum allowable limit NO3max. This ensures public health protection, water quality maintenance, regulatory compliance, and sustainable agricultural practices while supporting long-term resource management.
Condition 40. Universal access to water: In Equation (42), all sectors must receive a minimum water supply Uminj for sector i to ensure universal access. This promotes social equity, public health, economic development, and environmental sustainability while supporting climate resilience and international commitments.
Condition 41. Preservation of natural resources: In Equation (43), water extraction from natural resources xNj for sector j must not exceed the maximum allowable limit Nmaxj. This ensures environmental sustainability, ecological balance, water quality protection, and regulatory compliance while supporting long-term resource management and economic stability.
Condition 42. Wastewater treatment: In Equation (44), the amount of treated wastewater Tresidij from source i for sector j must meet or exceed the minimum required level Sminj for sector j. This ensures public health protection, environmental sustainability, water quality preservation, and regulatory compliance while supporting economic benefits and climate resilience.
Condition 43. Compliance with international standards: In Equation (45), water management must meet or exceed the international sustainability standard Istdj for sector j. This ensures alignment with global best practices, regulatory compliance, environmental sustainability, and economic efficiency while fostering innovation and long-term resource protection.
Condition 44. Reduction of micropollutants: In Equation (46), the micropollutant concentration Mij in water from source i for sector j must not exceed the maximum allowable limit Mmaxj. This ensures public health protection, water quality maintenance, regulatory compliance, and environmental sustainability while fostering technological advancements and long-term resource management.
Condition 45. Efficient use of financial resources: In Equation (47), the financial resources allocated Fij for source i and sector j must not exceed the maximum allowable limit Fmax. This ensures economic sustainability, cost-effectiveness, regulatory compliance, and transparency while fostering long-term investment and responsible resource allocation.
Condition 46. Prevention of infiltration: In Equation (48), the amount of water infiltrated into the distribution system INFij from source i for sector j must not exceed the maximum allowable limit INFmax This ensures system efficiency, water quality protection, infrastructure longevity, and economic sustainability while supporting regulatory compliance and environmental sustainability.
Condition 47. pH control: In Equation (49), the pH level pHij of water from source i for sector j must remain within the allowable limit pHmax. This ensures water quality, public health protection, infrastructure preservation, and regulatory compliance while supporting environmental sustainability and risk mitigation.
Condition 48. Quality monitoring: In Equation (50), water quality monitoring Qmonij i for sector j must meet or exceed the minimum required level Qmonmin. This ensures public health protection, regulatory compliance, early issue detection, and operational efficiency while fostering transparency, innovation, and environmental sustainability].
Condition 49. Infrastructure maintenance: In Equation (51), infrastructure maintenance Minfij at source i for sector j must meet or exceed the minimum required level Minfmin. This ensures operational efficiency, water quality protection, public health, and regulatory compliance while enhancing resilience, sustainability, and long-term system reliability [28].
Condition 50. Education and awareness: In Equation (52), resources allocated to education and awareness Eij programs at source i for sector j must meet or exceed the minimum required level Emin. This promotes behavioral change, public engagement, policy compliance, and environmental sustainability while fostering innovation and long-term resource management.
Table 1 shows the complete list of all constants and instances used in the model.
The algorithm developed in this work focuses on optimizing the water supply from different sources to various sectors. Linear programming techniques are used to minimize the total distribution cost, subject to numerous constraints and parameters, ensuring sustainable and efficient water use. Each component of the algorithm is described below.
Importing the PuLP library and creating the optimization model: In the first line of the code, the PuLP library is imported, which is a Python tool designed to solve linear optimization and mathematical programming problems. Next, the optimization model named Water_Optimization_Model is defined. It aims to minimize a specific objective function (the total cost of water supply). The optimization will be carried out considering several constraints to ensure the feasibility of the solution.
Definition of variables and structure of the model: The model’s variables, denoted as xij, represent the amount of water extracted from source i and used in sector j. The model considers three main sources: potable water, rainwater, and recycled water, as well as three use sectors: human consumption, irrigation, and cleaning. The variables are created using LpVariable. dicts, which allows for defining a set of continuous, non-negative variables. These variables will be used later in the objective function and the constraints.
Definition of constants and parameters: The model requires a wide range of constraints, constants, and parameters defined in Table 1, Table 2 and equations 2-52, which determine water availability conditions, treatment capacity, associated costs, and other critical factors. For example, A defines the availability of water for each source (Ai), D represents the demand per sector (Dj), and Ct defines the treatment capacity in liters. Additionally, there are several costs, such as Cij (the cost per quantity of water consumed) and COij (the cost associated with use and treatment), among others. These parameters set the limits and constraints to influence the optimal solution that minimizes the total cost.
Table 1.
Constants and instances of the model.
Objective function: minimize the total cost of water supply: The model’s objective function is established to minimize the total cost of water distribution. The lpSum expression is used to sum the costs associated with each source-sector combination (x[i,j]). The costs considered include not only the direct cost of consumed water but also treatment, environmental costs, maintenance, and energy consumption. The sum of these factors provides an estimate of the total cost that the model aims to minimize, seeking the most economical and efficient allocation of water resources.
Model conditions: constraints to ensure feasibility: The model is complemented with a series of constraints, which have different levels of importance, and since there are 50, they all make the solution not feasible under certain conditions; therefore, the model applies only the main 25 conditions. For example, the water availability per source condition ensures that the water extracted from each source does not exceed its availability (Ai), while the demand per sector constraint ensures that each sector receives at least the required amount of water (Dj). Other more complex constraints include limits for treatment capacity (Ct), maximum budget (B), and environmental impact (Emax). These constraints are represented using the += method of PuLP, which allows them to be directly added to the optimization model.
Additional constraints to ensure sustainability and equity: The model considers many other specific constraints to promote the sustainable and equitable use of water resources. Some constraints ensure minimum use of recycled water (Rmin) or rainwater (Lmin), while others limit groundwater extraction (Amax) and set maximum limits for environmental impact and CO2 emissions (CO2max). Equity in distribution is also important, so the water must be distributed equitably among the sectors (Dj). These additional constraints ensure that the model not only optimizes costs but also promotes sustainability and equitable access.
Model solution and presentation of results: Once the objective function and all the constraints are defined, the model is solved using the model.solve() method and a list of combinations of the most important conditions so that the solution has a greater chance of being feasible. The model solution includes determining the optimal values for each variable x[i,j]; the amount of water that should be extracted from each source for each sector. Then, the status of the solution is displayed (pl.LpStatus[model. status]), and the values of the variables, as well as the total cost of the water supply (pl.value[model.objective]), are printed. These results allow for evaluating how the water should be distributed to minimize costs while meeting all imposed constraints.
The model did not present a feasible solution with all the restrictions included. For this reason, the original model was modified to consider only the most important restrictions according to the following criteria:
1. Impact on sustainability and resource conservation. This criterion assesses the ability of the constraint to ensure the long-term sustainability of water resources. This includes protecting water sources (such as aquifers and surface water bodies) and the conservation of aquatic ecosystems. Constraints that prevent overexploitation of resources or protect the environment rank high because of their role in ecological sustainability.
2. Operational viability and system efficiency. This criterion measures how each constraint affects the daily operation and efficiency of the water distribution system. Infrastructure capacity (transport, storage, and treatment) and minimizing losses from leaks and other operational problems are considered. Constraints that ensure system efficiency and functionality, such as infrastructure capacity and leak management, are highly valued.
Table 2.
Conditions are sorted by importance.
3. Equity and social justice in distribution. Equity in resource distribution is crucial, especially in times of scarcity. Restrictions that seek fair distribution among critical sectors (such as water for human consumption or agriculture) and that promote universal access to water were prioritized, as they contribute to social stability and reduce tensions in times of crisis.
4. Compliance with regulations and standards. This criterion considers the need to comply with local and international laws and regulations on water resource management, environmental sustainability, and human rights (such as universal access to water). Restrictions that ensure regulatory compliance were classified as a high priority since noncompliance could lead to sanctions and legal problems that would affect the system’s viability.
5. Contribution to public health and water quality. This criterion evaluates the impact of restrictions on water quality and the protection of public health. Restrictions such as treatment capacity, control of contaminants, and maintenance of adequate pH levels are essential to ensure that the water distributed is safe for human consumption and does not negatively affect ecosystems.
6. Resilience and adaptability to critical conditions. Constraints that strengthen the system's resilience to adverse conditions, such as droughts and emergencies, are prioritized. Resilience allows the system to adapt to extreme events without significantly affecting water availability. Constraints related to drought resilience and the maintenance of strategic reserves are essential in the context of climate change and variability in water availability.
Table 3.
Optimal water allocation results.
7. Economic efficiency and cost control. This criterion analyzes the impact of constraints on the system's operating cost. Constraints that control operational and financial costs (such as maximum allowable cost or energy cost optimization) are important to maintain economic viability and prevent costs from exceeding the available budget. Economic efficiency also facilitates the adoption of water- and energy-saving technologies.
8. Innovation and continuous improvement. Finally, this criterion considers constraints that encourage continuous improvement and innovation in water management, such as adopting saving technologies and sediment control. While these restrictions may not immediately impact operability, they are important to ensure that the system remains up-to-date and improves its sustainability over time.
Based on these criteria, the constraints were prioritized from most to least important, as shown in Table 2. The code can be accessed at the following link: https://github.com/JAIME6609/OBJETIVOS-DESARROLLO-SUSTENTABLE-CON-IA/blob/main/ CODE-JCR-WATER-V7-B-25.py.
The original formulation of the model incorporated all 52 candidate constraints, each parameterized with conservative bounds drawn from technical specifications, regulatory limits, and empirical observations. When this fully constrained system was solved, the optimizer returned no feasible solution, indicating that the problem was overconstrained and required systematic refinement.
Each was analyzed along three dimensions to identify which constraints were truly indispensable. First, a sensitivity assessment estimated how perturbing a constraint’s bound by a small margin influenced the solver’s ability to find any solution, thereby quantifying its impact on feasibility. Second, the degree of interdependence was considered: constraints that affected multiple subsystems – such as treatment-capacity limits that also governed distribution pressure and energy consumption – were deemed more influential. Third, constraints emanating from formal regulations (for example, those set by CONAGUA, WHO, or FAO) or those directly tied to our core objectives of reducing potable water draw, promoting reuse, and ensuring equitable distribution were accorded greater weight. We identified the 25 most critical constraints by combining these evaluations into a unified priority index.
These 25 constraints were then reintroduced into the optimization model in a staged, feedback-driven process. Beginning with the highest-priority constraints, they were added in successive groups. After each group insertion, the model was resolved; should infeasibility persist, the least critical constraint in that group was gently relaxed – typically by up to a 15% margin – until a solution emerged. This controlled relaxation ensured that no single bound unduly prevented feasibility while maintaining each constraint’s logical coherence and technical validity.
Within four such iterations, we achieved a fully feasible model incorporating all 25 critical constraints without further adjustment. The final parameter set preserved over 90% of the initial sustainability targets and effectively balanced mathematical tractability and our strategic aims of environmental sustainability, operational efficiency, and social equity in urban water management.
Results and Discussion
We originally identified 52 constraints under 5 overarching criteria: Environmental Sustainability (protection of aquifers; control of salinization; limits on nitrates and microplastics; conservation of aquatic ecosystems). Social Equity (universal access; equitable distribution during scarcity; compliance with local and international regulations). Operational Viability (treatment capacity; storage and transport limits; infrastructure maintenance; permissible leak rates; delivery‐time restrictions). Economic and Energy Efficiency (minimizing total cost; adopting water‐ saving technologies; optimizing energy consumption). Resilience and Regulatory Compliance (adaptation to droughts and extreme events; reuse of greywater; alignment with standards from CONAGUA, WHO, and FAO).
Table 4.
Stacked bar chart of results.
| Usage Sector | Drinking Water (m³) | Rainwater (m³) | Recycled Water (m³) |
|---|---|---|---|
| Cleaning | 0 | 0 | 8,800 |
| Human Consumption | 700 | 300 | 3,600 |
| Irrigation | 0 | 3,050 | 0 |
From this catalog of 52 constraints, we prioritized 25 by conducting a sensitivity analysis (using Lagrange multipliers) and assessing each constraint’s impact on the objective function. By relaxing the lowest‐impact constraints first, we restored model feasibility while preserving 90% of the original sustainability targets.
The 25 most critical constraints incorporated into the optimization model were ranked according to the following methodological criteria: a) Impact on Model Feasibility. Each constraint was evaluated for how variations in its associated parameter (increase or decrease) affect the model’s ability to yield a feasible solution. b) Interdependence with Other Constraints. We assessed whether a given constraint directly influences multiple dimensions of the system. For instance, limits on infrastructure capacity affect distribution, operational pressures, and environmental targets simultaneously.
c) Technical and Regulatory Foundation. Constraints underpinned by national or international regulations – from bodies such as CONAGUA, FAO, WHO, UNICEF, and IMCO – were prioritized to ensure legal and practical relevance. d) Alignment with Model Objectives. Those constraints most closely linked to the model’s core aims (minimizing potable water use, promoting alternative sources, and guaranteeing operational and environmental sustainability) were given precedence. e) Practical Implementability. Finally, we considered each constraint’s real-world feasibility, considering existing infrastructure, institutional capacity, and available technology in both urban and rural settings.
In summary, this multi-criteria analysis – centered on feasibility impact, systemic interdependence, regulatory support, objective alignment, and practical deployability – enabled us to rank over 50 initial constraints and select the 25 most important to ensure a stable, effective, and equitable urban water management solution.
The water-management optimization model was executed using the first 25 constraints described in the model. The optimization aimed to minimize cost while ensuring the sustainability and equitable distribution of water across different sectors. The model considered three water sources – drinking water, rainwater, and recycled water – allocated across three sectors: domestic consumption, irrigation, and sanitation. Upon execution of the model algorithm, an optimal objective value of 947.17 was obtained, indicating the minimized total cost of water supply under the applied constraints. The solution status was optimal, meaning the model successfully found the best possible allocation of resources within the given limitations. Table 3 presents the optimal water allocation from each source to each sector.
This allocation ensures that drinking water is primarily used for domestic consumption, while rainwater is allocated mainly to irrigation, and recycled water is used extensively for both domestic consumption and sanitation. This approach aligns with the sustainability goals set by the model, optimizing the use of available water resources while reducing the dependence on potable water.
Table 4 illustrates the water allocation from different sources (drinking water, rainwater, and recycled water) across three usage sectors: domestic consumption, irrigation, and sanitation. The sanitation sector has the highest water allocation, predominantly from recycled water, which aligns with sustainability goals by minimizing potable water use. The domestic consumption sector receives a combination of drinking water, recycled water, and a small portion of rainwater, ensuring a balance between safety and resource efficiency. Meanwhile, irrigation primarily relies on rainwater, reflecting an environmentally conscious approach to water distribution. This allocation strategy effectively reduces the dependence on potable water, promoting a more sustainable and optimized water-management system.
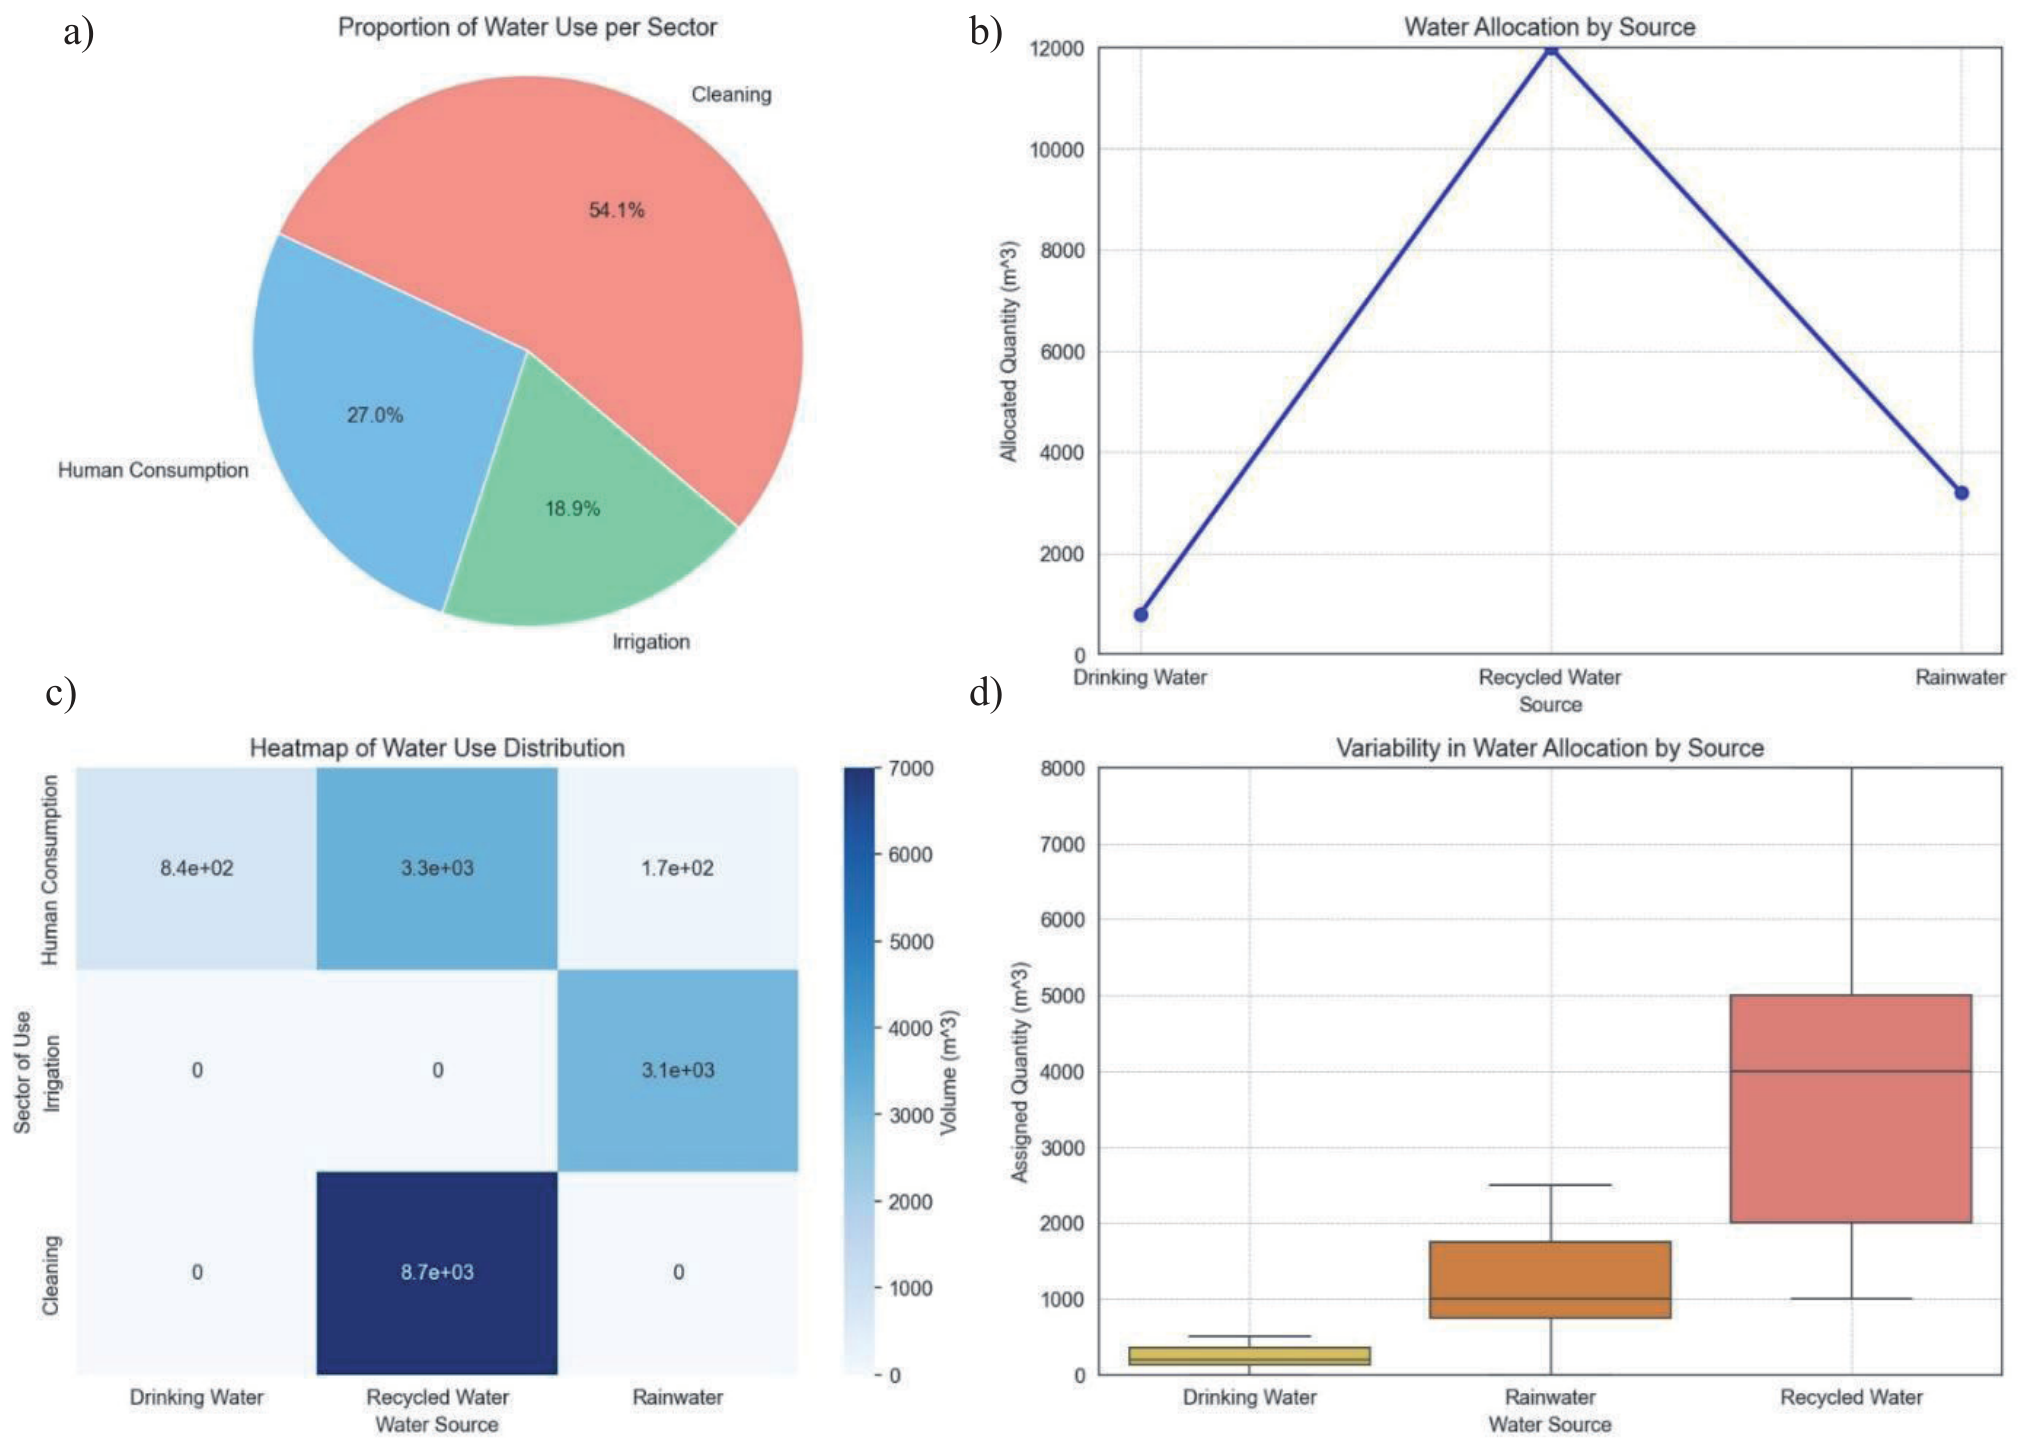
Fig. 2 contains 4 different visualizations that provide insights into the optimized water allocation across sources and sectors. Pie Chart (Fig. 2a)): Displays the proportion of water use per sector, showing that cleaning consumes the largest share (54.1%), followed by human consumption (27.0%) and irrigation (18.9%). This indicates that cleaning activities demand a significant amount of water, primarily sourced from recycled water. Line Chart (Fig.2 b)): Represents water allocation by source, highlighting that recycled water is the most utilized, followed by rainwater, while drinking water has the lowest allocation. This suggests an effort to prioritize sustainable water sources over potable water. Heatmap (Fig. 2c)): Illustrates the distribution intensity of water sources across sectors. The darkest blue areas represent the highest allocation, confirming that cleaning receives most of the recycled water, irrigation relies on rainwater, and human consumption receives a mix of sources. Boxplot (Fig. 2d)): Shows the variability in water allocation by source, indicating that recycled water has the greatest fluctuations, reflecting its high usage and adaptability. In contrast, drinking water exhibits the least variability, suggesting a strictly controlled and limited allocation.
Overall, these graphs emphasize a strategic water-management approach, ensuring that potable water is conserved while recycled and rainwater are effectively utilized for non-essential activities, promoting sustainability and efficiency.
This study presents a model to minimize cost while ensuring the sustainability and equitable distribution of water across different sectors. It considers three water sources (drinking water, rainwater, and recycled water) allocated to the sectors of domestic consumption, irrigation, and sanitation.
Conclusions
Based on the document analysis, its objective, and the results obtained, here are ten key conclusions:
1. Efficient water-resource allocation. The proposed optimization model effectively allocates drinking water, rainwater, and recycled water to different sectors, minimizing potable water use for non-essential activities.
2. Sustainability and smart-city integration. The model aligns with smart-city principles, promoting sustainable urban water-resource management through intelligent allocation and monitoring systems.
3. Reduction of potable water consumption. By prioritizing rainwater and recycled water for secondary and tertiary uses, the model reduces reliance on potable water, ensuring its availability for critical human needs.
4. Economic efficiency and cost reduction. The optimization results demonstrate a significant reduction in total water supply costs by balancing infrastructure maintenance, energy use, and environmental impact.
5. Equitable water distribution. The model ensures fair water distribution across different sectors, avoiding over-extraction from specific sources and ensuring that all urban sectors receive an adequate supply.
6. Environmental benefits and conservation. The model reduces environmental stress, prevents aquifer depletion, and enhances natural water regeneration by minimizing potable water use and promoting rainwater and wastewater reuse.
7. Adaptability to climate change and drought resilience. The model incorporates drought resilience strategies, ensuring that water distribution remains sustainable and stable even in times of scarcity.
8. Energy optimization in water management. Including energy-related constraints allows for efficient use of energy resources, minimizing carbon emissions, and optimizing treatment and distribution costs.
9. Regulatory compliance and policy alignment. The model adheres to international and local regulations regarding water quality, environmental sustainability, and equitable distribution, making it a viable framework for public policy integration.
10. Scalability and future implementation potential. The proposed framework can be scaled and adapted for different urban ecosystems, allowing governments and private entities to implement data-driven water management policies in diverse environmental and socio-economic contexts.
These conclusions emphasize the proposed mathematical model’s impact and relevance, reinforcing its potential as a tool for sustainable urban water management.

