

Abbreviation (In order of appearance in the text)
1. Light saturation point (Isat)
2. net photosynthetic rates (Pn)
3. Pueraria lobata (P. lobata)
4. Bougainvillea spectabilis (B. spectabilis)
5. water use efficiency (WUE)
6. transpiration rate (Tr)
7. stomatal conductance (Gs)
8. intercellular CO2 concentration (Ci)
9. CO2 response curve (A/Ci curve)
10. right-angle hyperbolic modified model (RHMM)
11. exponential model (EM)
12. right-angle hyperbolic model (RHM)
13. non-right-angle hyperbolic model (NRHM)
14. the maximum net photosynthetic rate (Pn max)
15. light compensation point (Ic)
16. dark respiration rate (Rd)
17. apparent quantum efficiency (AQE)
18. the Michaelis–Menten model (M-M)
19. the initial carboxylation efficiency (α)
20. CO2 compensation point (Γ)
21. photorespiration rate (Rp)
22. coefficient of determination (R2)
23. mean squared error (MSE)
24. mean absolute error (MAE)
25. photosynthetically active radiation (PAR)
26. CO2 saturation point Cisat
Introduction
The construction of highways in the karst areas of Guangxi inevitably leads to the creation of slopes due to excess soil excavation and the disposal of soil and debris. This directly damages mountain vegetation, causes severe soil erosion and a high rock exposure rate, and forms many rocky desertification slopes. Owing to poor site conditions and shallow, loose, backfilled soil, vegetation restoration of rocky desertification slopes is ineffective, with a low survival rate, maintenance difficulties, and high costs. Selecting plant species with high biomass and good drought resistance is crucial for achieving rapid vegetation restoration.
Previously, the screening of suitable plants primarily involved selecting dominant species in the local karst area and assessing their adaptability to drought stress and high-calcium environments [1]. This process involves various considerations, including morpho-anatomy, molecular physiological processes, and water utilization [2–4]. It is time-consuming and involves numerous indicators. Currently, there is no rapid and effective method to assess the suitability of alternative plants for specific environments, such as rocky desertification slopes along highways.
Understanding the photophysiological basis of photosynthesis and predicting photosynthetic trends under various environmental conditions is crucial for explaining crop productivity [5–7]. The quantitative relationship between the net photosynthetic rate (Pn) and photosynthetic effective radiation reveals the instantaneous response of plant photosynthetic physiological processes to environmental factors [8–10], termed the light response. This approach is the most effective for studying how the environment impacts plant photosynthesis. Specifically, the light-response curve model is ideal for evaluating the response of these plants to light. The corresponding physiological parameters can be obtained by analyzing the fitted light-response curve (light curve). Additionally, the CO2 response curve (A/Ci curve) of photosynthesis can be used to understand how photosynthesis responds to constantly changing environmental conditions [11, 12], and predict plant carbon absorption in future climate conditions [13, 14]. For example, the A/Ci curve has been used efficiently to screen plants using bicarbonate radical ions [15]. These results raise questions about whether light response characteristics can be used to compare the suitability of alternative plants for karst rocky desertification environments and how their adaptive strategies differ.
This study focused on two plant species planted on rocky desertification slopes under arid conditions. Photosynthetic instruments were employed to measure the light curve and A/Ci curve, and various models were utilized for fitting. Changes in the Pn and water use efficiency (WUE) were analyzed, and differences in their light response characteristics were compared. Strategies for adapting to environmental change were analyzed, and pioneer species for rapid vegetation recovery were screened.
Material and Methods
Study Area
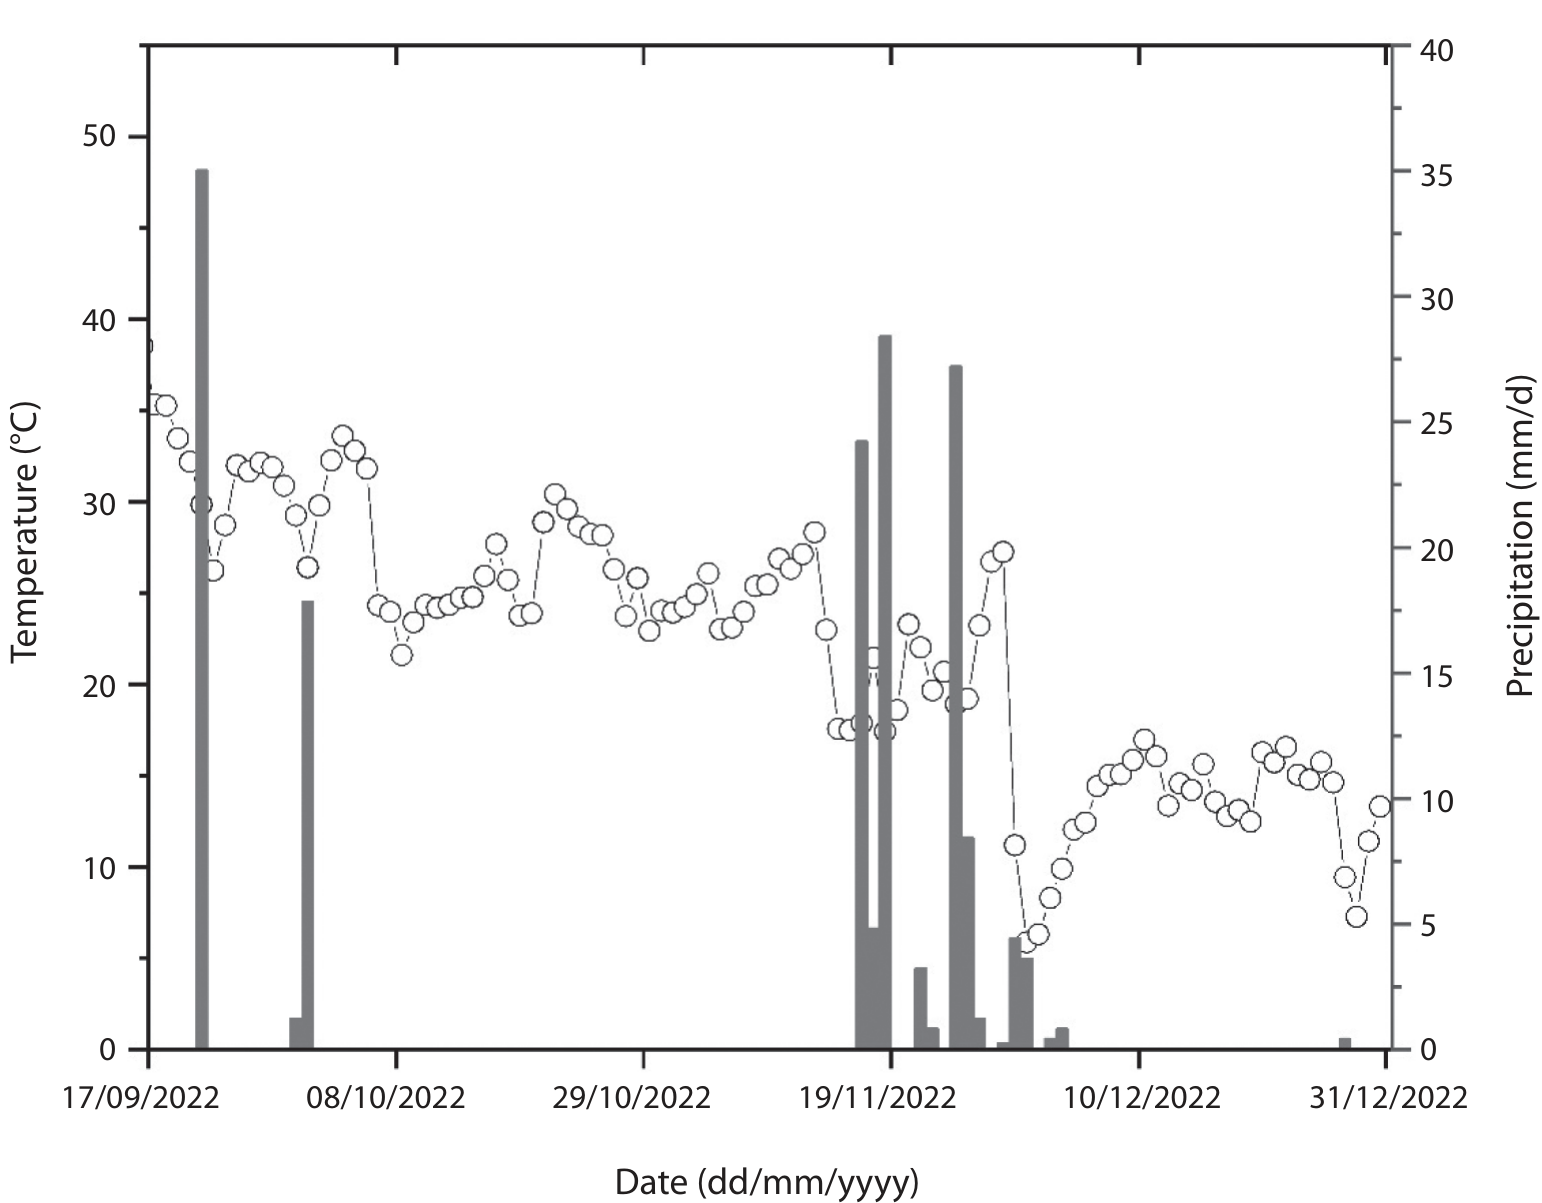
The research area was situated on the right slope of section No. 2 (YK296 + 300 – YK296 + 580) of the Laibin to Du’an highway, in Nongchang Village, Xincheng County, Laibin City, China. The slope extended over a length of 280 m, with a maximum vertical slope height of 26 m. The area was divided into three development levels, with a slope ratio of 1:1.75 for the first and second levels, and 1:2 for the third level. Active protective nets were employed for protection, along with the use of vines for greening purposes. Xincheng County is situated in a monsoon climate zone that transitions from subtropical to tropical regions, intersected by the Tropic of Cancer. The area experiences abundant sunshine and rainfall, with a mild climate. The terrain features erosion and hills, with ground elevations ranging from 145 to 180 meters and a relative height difference of 35 m. During autumn 2022, the area experienced minimal rainfall and severe drought conditions, as illustrated in Fig. 1. Between 17 September and 31 December 2022, the total rainfall amounted to 162 mm, with October recording only 17.8 mm of rainfall (Fig. 1).
Experimental Species
The experimental species selected were the small shrub Bougainvillea spectabilis (B. spectabilis) and the vine Pueraria lobata (P. lobata), which were planted on a first-level slope in August 2022. B. spectabilis is widely employed as a landscape plant in Guangxi, while P. lobata is commonly utilized to enhance vegetation coverage on highway slopes. The soil was locally backfilled yellow lime soil, with a soil bulk density of 1.29±0.12 g·cm-3, soil mass moisture content ranging from 6.5% to 8.9%, salinity of 66.33±1.52 ms·m-1, pH of 6.56±0.23, total phosphorus of 0.23±0.01 g·kg-1, total potassium of 1.78±0.02 g·kg-1, and a cation exchange capacity of 4.98±0.06 cmol·kg-1. The soil was characterized by aridity and barrenness. The sampling took place on 22–23 October 2022. During the dry season, the two plant species exhibit a decelerated growth rate without the manifestation of desiccation-induced leaf abscission or chlorosis.
Light Curve Determination
Fully unfolded upper leaves were selected and a Li6400 portable photosynthesis instrument (LI-COR, Lincoln, NE, USA) was used from 08:00 to 11:30 to provide varying levels of photosynthetically active radiation through red and blue light sources. Radiation intensity was set to 2000, 1500, 1000, 800, 500, 300, 200, 150, 100, 50, 20, and 0 µmol m-2s-1 to assess the Pn of the two plants under different light intensities. During measurements, the leaf temperature was set at 32℃, the gas source CO2 concentration at 400 µ mol·mol-1, and the relative humidity at 18%. The experiment was conducted in triplicate, and the average value was reported with an error margin of < 10%. The gas flow rate was set at 500 μmol·s-1 and the photosynthetically active radiation was measured using automatic measurement mode, with a dwell time of 120–200 s at each set value. The measurement period was from 22 to 23 October 2022.
A/Ci Curve Determination
On a sunny morning, with a light saturation intensity of 1000 μmol/(m2·s) for B. spectabilis and 1250 μmol·m-2·s-1) for P. lobata, an airflow velocity of 500 μmol·s-1and a leaf surface temperature of 30℃, 13 CO2 concentrations (400, 300, 200, 150, 100, 50, 400, 600, 800, 1000, 1200, 1600, and 2000 μmol·mol-1) were set for CO2 response curve measurement. An automatic measurement mode was selected with a dwell time of 60–300 s at each set value. The Pn of the two plants was measured and repeated three times, and the mean value of the three replicates was reported with an error margin of < 10%.
Determination of Meteorological Indicators and Soil Physicochemical Properties
Temperature and rainfall were recorded using a self-recording rainfall collector (Davis 6466M, Davis Instruments, Hayward, CA, USA). Soil pH, bulk density, cation exchange capacity, total phosphorus, and total potassium were measured according to the methods described by Lu [16].
Calculation and Analysis
The light curves of the tested plants were fitted and calculated using Photosynthesis Calculation software version 4.1.1, employing the right-angle hyperbolic modified model (RHMM), exponential model (EM), right-angle hyperbolic model (RHM), and non-right-angle hyperbolic model (NRHM) [17, 18]. Various indicators were calculated, such as the maximum net photosynthetic rate (Pn max), light compensation point (Ic), and dark respiration rate (Rd), along with other light response parameters and apparent quantum efficiency (AQE). The A/Ci curve of the tested plants was fitted and calculated using RHM, the Michaelis–Menten model (M-M), and RHMM [13, 14]. This analysis included calculating the initial slope of the CO2 response curve, known as the initial carboxylation efficiency (α), along with response parameters such as Pn max, CO2 compensation point (Γ), and photorespiration rate (Rp).
The coefficient of determination (R²), mean squared error (MSE), and mean absolute error (MAE) were employed to assess the goodness of fit for each model. An R² value approaching 1 indicates a closer match between the predicted or fitted values and the measured values, reflecting higher model accuracy [19–21]. Photosynthetic Calculation software (version 4.1.1) was utilized to compute R² directly and the following formulas were applied to calculate MSE and MAE:
where yt and
Results and Discussion
Light Response Model Goodness of Fit Evaluation and Photosynthetic Parameters
The fitting results of the RHM, NRHM, RHMM, and EM for the light response of both species are presented in Table 1 and Fig. 2. The results indicate that, aside from the B. spectabilis RHM which exhibited a poor fit (R² = 0.6076), the fitting curves of other models for B. spectabilis and all four models for P. lobata demonstrated excellent agreement with the measured values (R2 > 0.96). Except for the MSE and MAE values exceeding 1 for the B. spectabilis RHM, the MSE and MAE values for the other models were relatively small. Notably, EM for B. spectabilis exhibited the smallest MSE and MAE values, while NRHM for P. lobata demonstrated the smallest MSE and MAE values.
However, the methods used to estimate plant light saturation (Isat) for these four light response models varied, leading to substantially different Isat (Fig. 3). The Isat value obtained for B. spectabilis using the NRHM model is notably lower than the measured value (Fig. 3). The Isat estimated by the RHM and RHMM models closely approximated the actual values. However, the Pn max fitted by the RHM was 10, significantly higher than the measured value, whereas that estimated by the RHMM closely matched the observed value. Consequently, the larger the R2 value, the higher the fitting degree of the light response model; however, the fitting results will not always match the measured values. Overall, the RHMM had the closest Isat and Pn max to the measured values, with high fitting accuracy and the highest goodness of fit.
Table 1.
Photosynthetic parameters of light response curves for two plant species on rocky desertification slope during the dry season.
Fig. 2.
Four models fitting the photosynthesis response curves of B. spectabilis (I) and P. lobata (II).
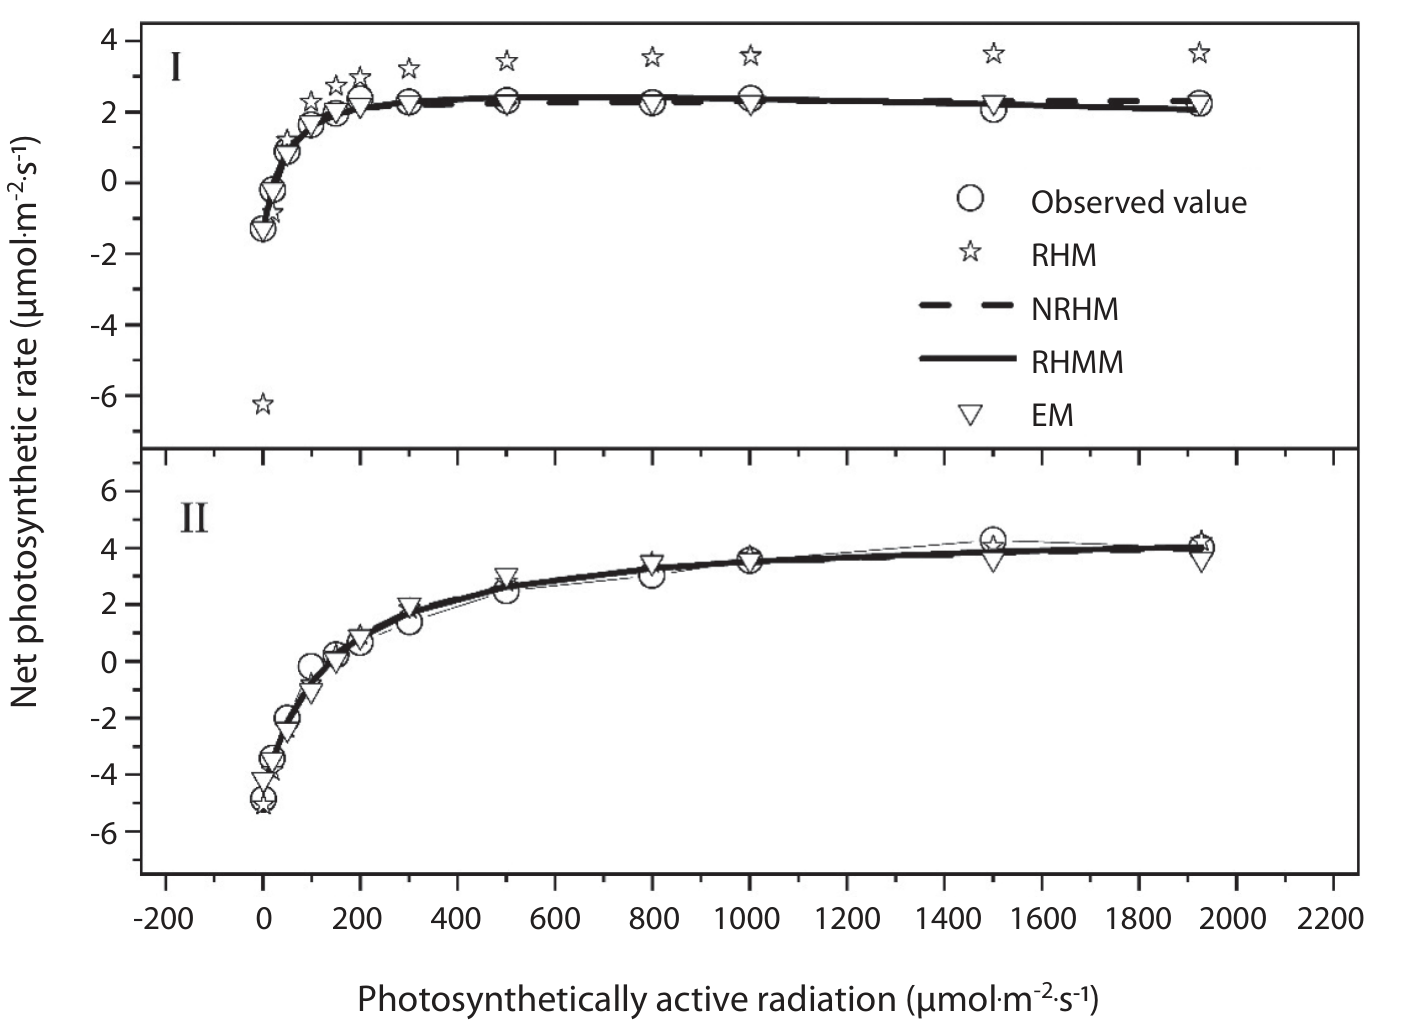
Fig. 3.
Methods for estimating irradiance saturation (Isat) using four photosynthesis response models. a. RHM; b. NRHM; c. RHMM; d. EM assumes that the Isat is the photosynthetically active radiation (PAR) corresponding to a Pn max of 0.9. The apparent quantum efficiencies (AQE) are the slopes of the linear fitting equations for the light response curve under PAR ≤ 200 μmol·m-2·s-1. a and b obtained the Isat by solving the linear equation Pn max = AQE × Isat – Rd (dark respiration rate).
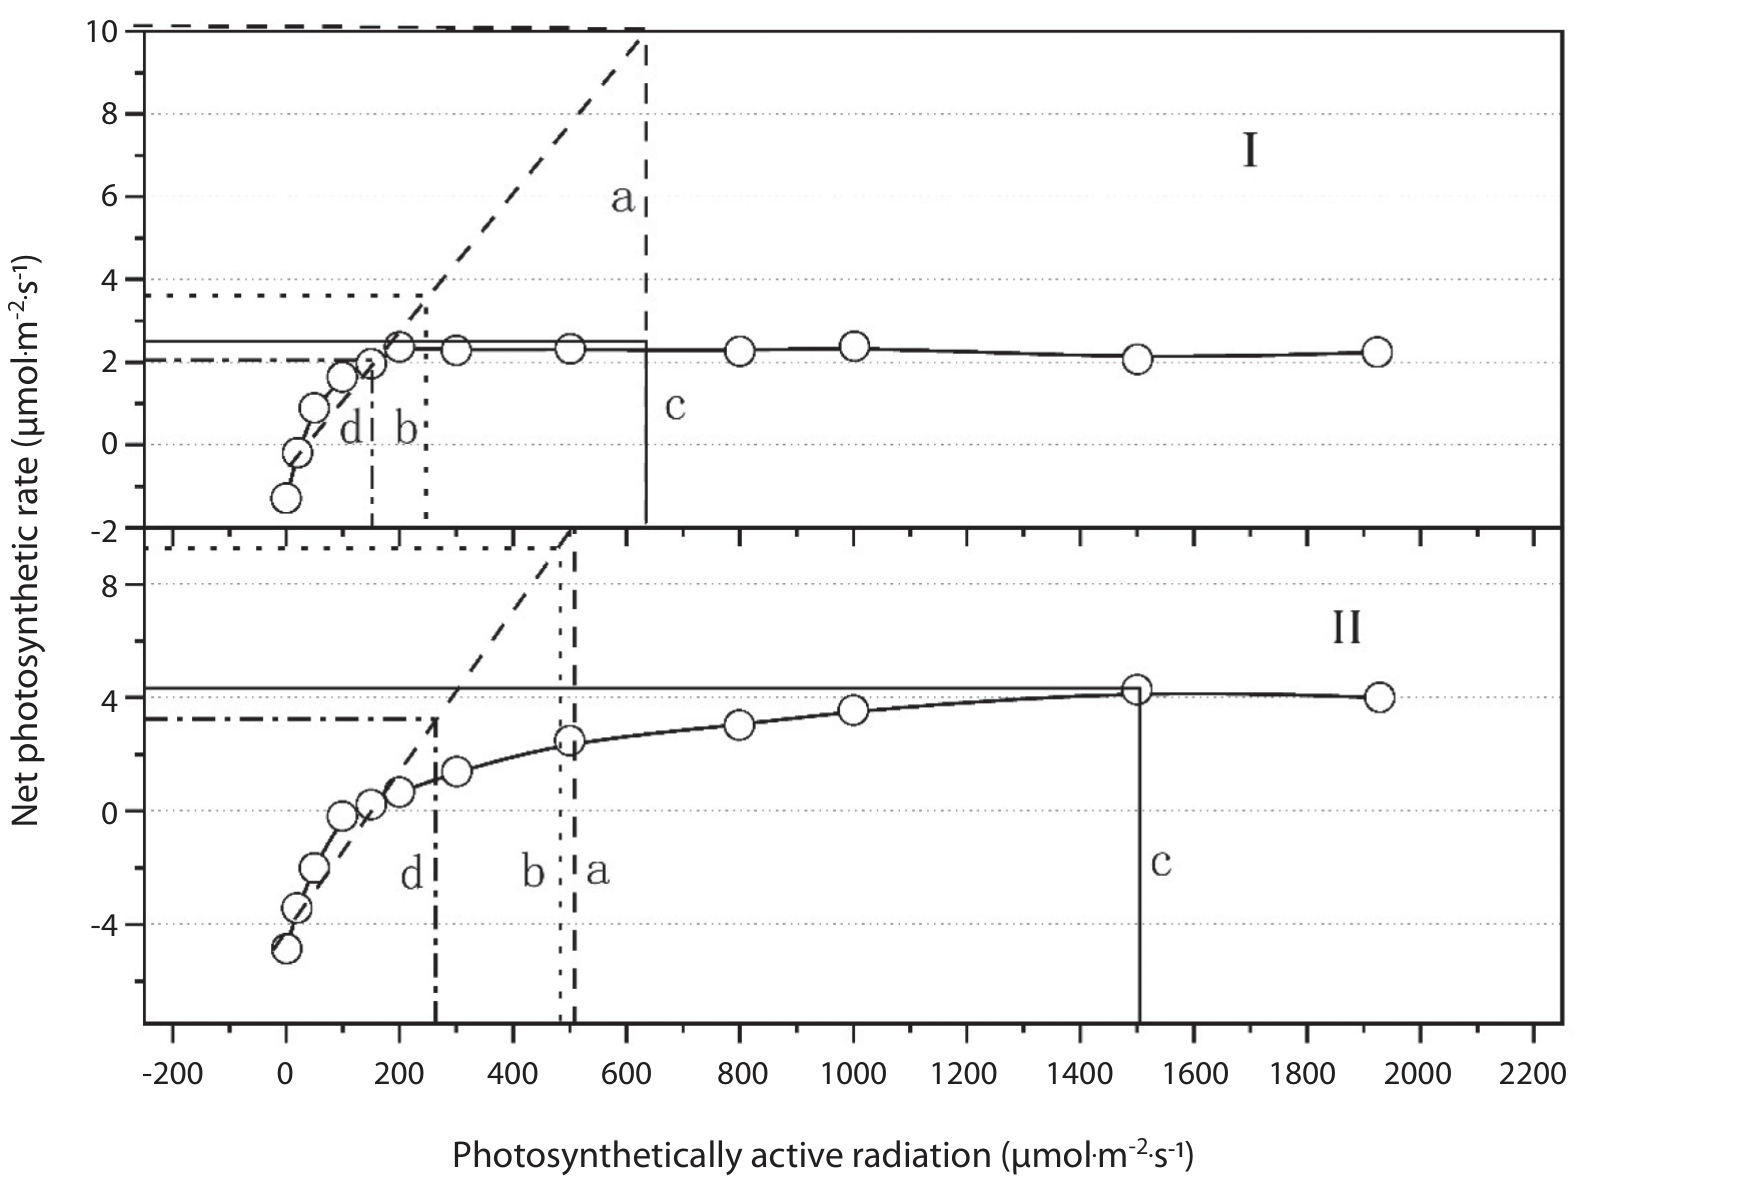
Similarly, the Isat obtained for P. lobata using the RHM, NRHM, and EM models were all notably lower than the measured values. In contrast, the Pn max fitted by the RHM and NRHM were significantly higher than the measured values. Only the RHMM had an Isat and Pn max close to the measured values (R2 = 0.99; MSE and MAE ≤ 0.21). Overall, the RHMM had the highest degree of goodness of fit. Therefore, when evaluating the goodness of fit of various photoresponse models, it is important to consider not only their fitting effects but also their accuracy in fitting the data.
Given the optimality of the RHMM model, the data were compared using this model. The Pn max of P. lobata was 48% higher than that of B. spectabilis (Table 1). Pn max represents the peak photosynthetic capacity of leaves, indicating the maximum assimilation capacity achievable under specific environmental conditions [22]. The AQE of B. spectabilis and P. lobata were 0.0167 and 0.0267, respectively, with 37% higher in P. lobata. The AQE reflects the photosynthetic capacity of plants under low light conditions [18]. Previous studies showed that the range of AQY is from 0.03 to 0.05 in common plants under optimal conditions [10]. The AQE values are similar to those observed in Mangifera indica (0.020– 0.024) [7] and slightly lower than those of Populus euphratica (0.036–0.044) [10], both under severe drought conditions.
For P. lobata, the Rd was 29% higher than that of B. spectabilis, while the Ic was 6.68 times higher and the Isat was 2.68 times higher than that of B. spectabilis. Overall, compared to B. spectabilis, P. lobata had a stronger ability to utilize both strong light and weak light. The B. spectabilis achieves organic compound preservation by minimizing dark respiration. Finally, P. lobata exhibits faster biomass growth under drought conditions and demonstrates a faster capability to cover exposed rocks on rocky slopes.
CO2 Response Model Goodness of Fit Evaluation and Photosynthetic Parameters
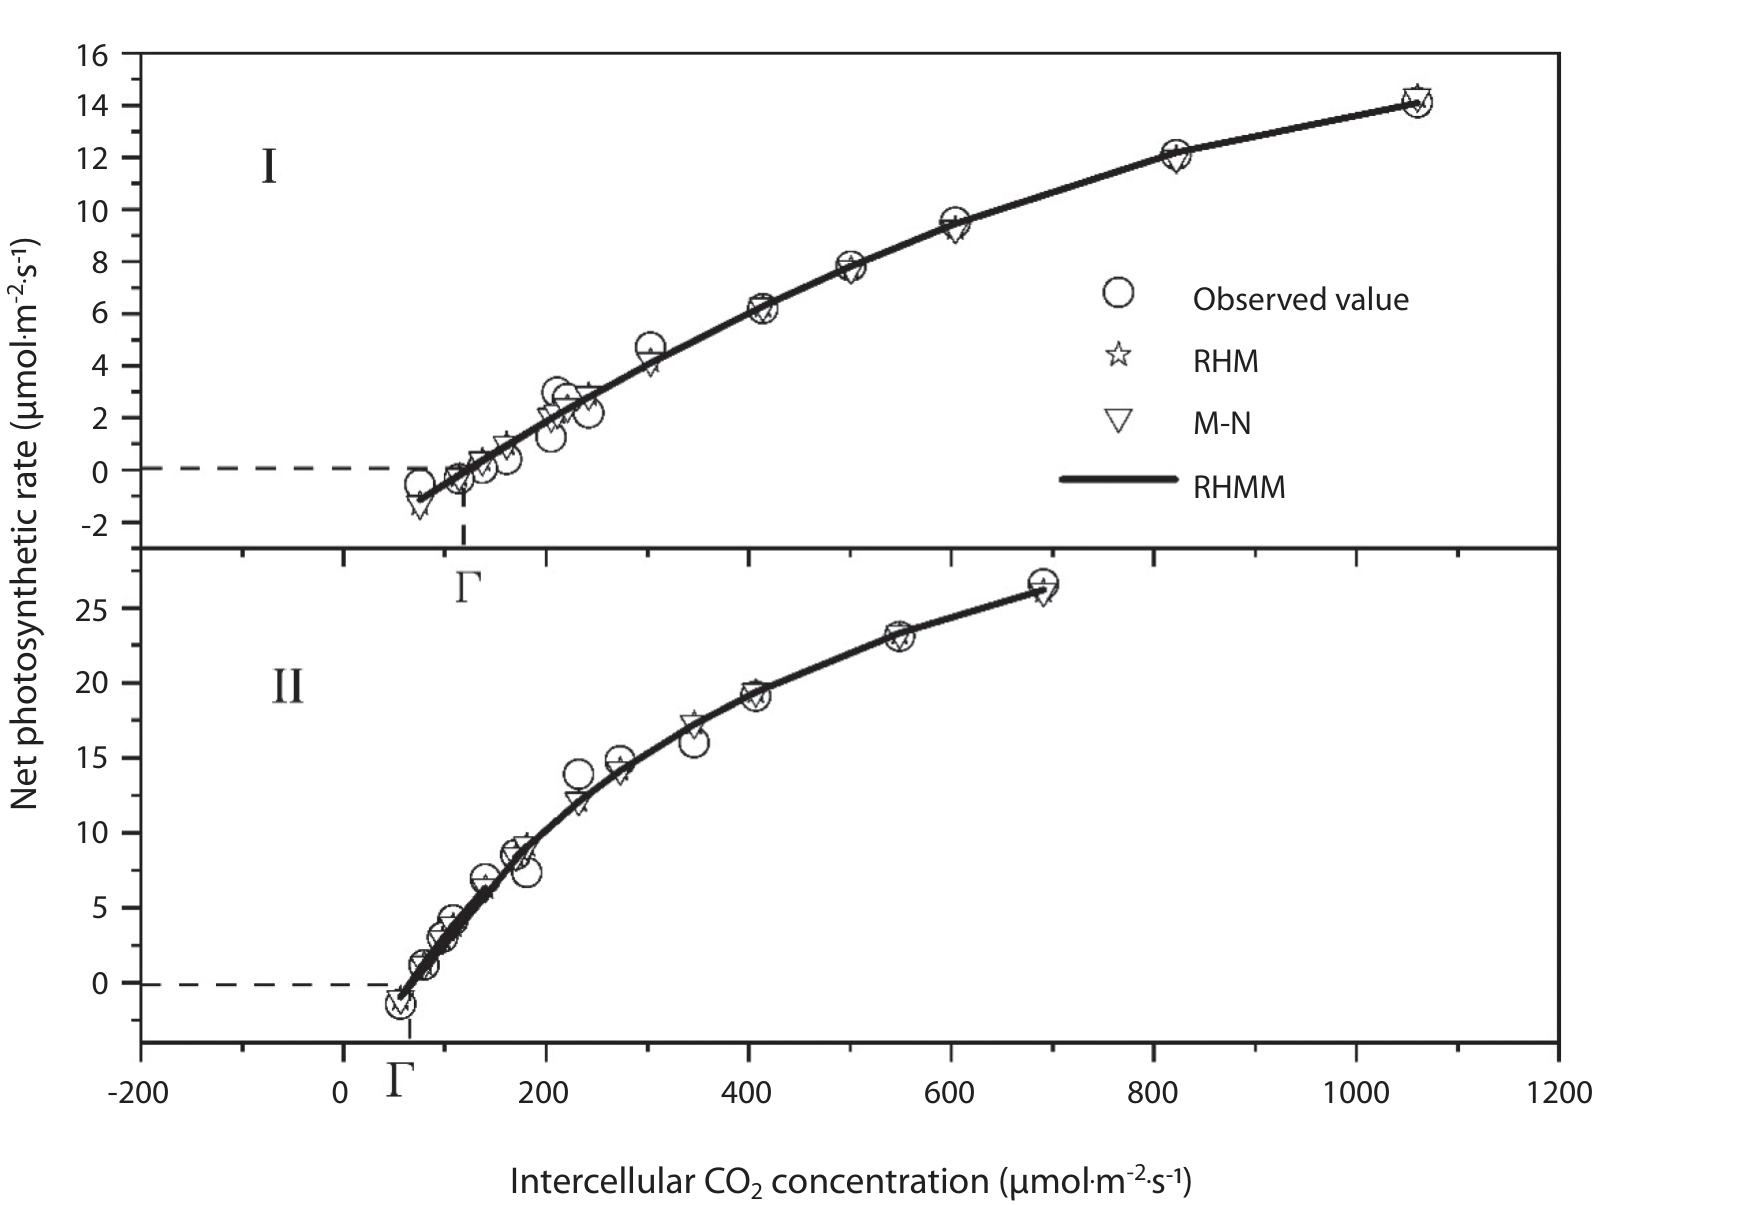
Fig. 4 shows the fitting results of the RHM, M-M, and RHMM models for the CO2 responses of both species. The fitting curves of both species using the three models demonstrated agreement with the measured values (R2 > 0.98). The Pn values simulated by the RHM and M-M were consistent, with the RHM essentially being equivalent to the M-M model. The MSE and SAE of the RHMM for B. spectabilis were the smallest. From Pn max, the simulated values of the B. spectabilis RHMM were closest to the measured values (Table 2), whereas the RHM and M-M were far higher than the measured values, indicating a deviation from actual photosynthesis. The RHMM exhibited the best goodness of fit.
The RHM/M-M for P. lobata had the smallest MSE and SAE. For Pn max, the results of the three models were considerably higher than the measured values, with the RHMM displaying the smallest deviation from the measured values. Nevertheless, the fitting curve revealed that the measured values did not reach their maximum. Both the measured and fitted values increased with rising CO2 concentration, and Pn did not exhibit a decreasing or stable pattern, indicating that the CO2 saturation point (Cisat) could not be identified.
The α value represents the slope of the line obtained by fitting the response data of Ci ≤ 200 with a linear equation, reflecting both the quantity and enzymatic activity of Rubisco [23]. The α values of B. spectabilis and P. lobata were 0.0168 and 0.0883, respectively, indicating that P. lobata had a higher cooperative ability under low CO2 conditions. The Pn max, Γ, and Rp of P. lobata were 1.89, 0.52, and 2.44 times higher than those of B. Spectabilis (Table 2), respectively. Pn max reflects the activity of photosynthetic electron transfer and phosphorylation in plant leaves [24]. The Γ reflects the CO2 concentration at which the rate of photosynthetic assimilation equals that of respiratory consumption in plant leaves [25]. This suggests that P. lobata had a stronger ability to utilize low and high CO2 concentrations compared to B. spectabilis. Both the Rp and the overall Pn of B. spectabilis were higher (Table 2). Overall, P. lobata has a greater potential for biomass accumulation during a continuous increase in atmospheric CO2 concentration.
Table 2.
Photosynthetic parameters values of CO2 response curves for two plant species on rocky desertification slope during the dry season.
The Cisat reflects the ability of plants to utilize high CO2 [26]. In contrast to previous studies, neither the measured nor simulated Ci of P. lobata reached saturation. Zhu et al. [21] found that under different nitrogen conditions, Pn gradually increased and eventually stabilized as the CO2 concentration increased. However, Arp [27] observed that two Chinese Liriodendron plants grown at high CO2 concentrations for an extended period did not reach saturation, resulting in significant changes in the Cisat of the plants grown under high CO2 concentrations. In this study, P. lobata lived under extreme drought conditions for an extended period, preventing it from reaching the Cisat; however, the rate of increase gradually decreased. Photosynthesis under light saturation is constrained by its carboxylation ability at low CO2 levels and by electron transfer and ribulose bisphosphate regeneration at high CO2 levels [25].
RHMM is the Best Fitting Model for the Light and CO2 Response Curves
Researchers have established various response models of photosynthesis, including common light response models such as RHM, NRHM, EM, and RHMM [28]. Previous studies [7, 10] found that the RHMM can better estimate Isat than other models. This model simulates functions with extreme values and high accuracy, resulting in a fitting effect closer to the actual values compared to other models, particularly applicable to arid desert habitats [10].
The RHMM was also the optimal model for the light and CO2 response curves in our results. Fitting the light-response curve offers two advantages: firstly, it can directly calculate the Isat and the Pn max of plants. Secondly, it allows for the fitting of light response curves of plants under two conditions: either no decrease in Pn after reaching Isat or decreased photosynthetic rate. The estimated Isat and Pn max were closest to the measured values [7, 10, 26].
Similarly, during the fitting of the CO2 response curve, neither the RHM nor the M-M models were able to fully capture the decline in Pn with increasing CO2, nor could they accurately estimate Pn max. The RHMM demonstrated a good fit with an R2 value and outperformed the other models in terms of fit. Its photosynthetic parameters, including α, the fitted Pn max values, and Cisat, closely approximated the true values and accurately reflected the actual situation.
Light Response and A/Ci Curves of Transpiration
Rate (Tr), WUE, Stomatal Conductance (Gs),
and Intercellular CO2 Concentration (Ci)
A positive linear relationship was observed between Tr, Gs, and photosynthetically active radiation (PAR). WUE rapidly increased from 0 to 250 μmol·m-2·s-1 of PAR and subsequently stabilized. Contrary to the Pn, Ci exhibited a rapid decline from 0 to 250 μmol·m-2·s-1 of PAR before stabilizing (Fig. 5). The Gs of B. spectabilis remained relatively stable, whereas WUE exhibited a slight decrease after reaching its peak value (Fig. 5). The rapid decline in Ci indicates a high demand for raw photosynthetic CO2 and high photosynthetic efficiency. Due to the small increase in Gs under low-light conditions, the increased photosynthetic rate rapidly increased CO2 consumption, leading to decreased CO2 levels [5].
Fig. 5.
Photosensitive curves of transpiration rate (Tr), water use efficiency (WUE), stomatal conductance (Gs), and intercellular CO2 concentration (Ci).
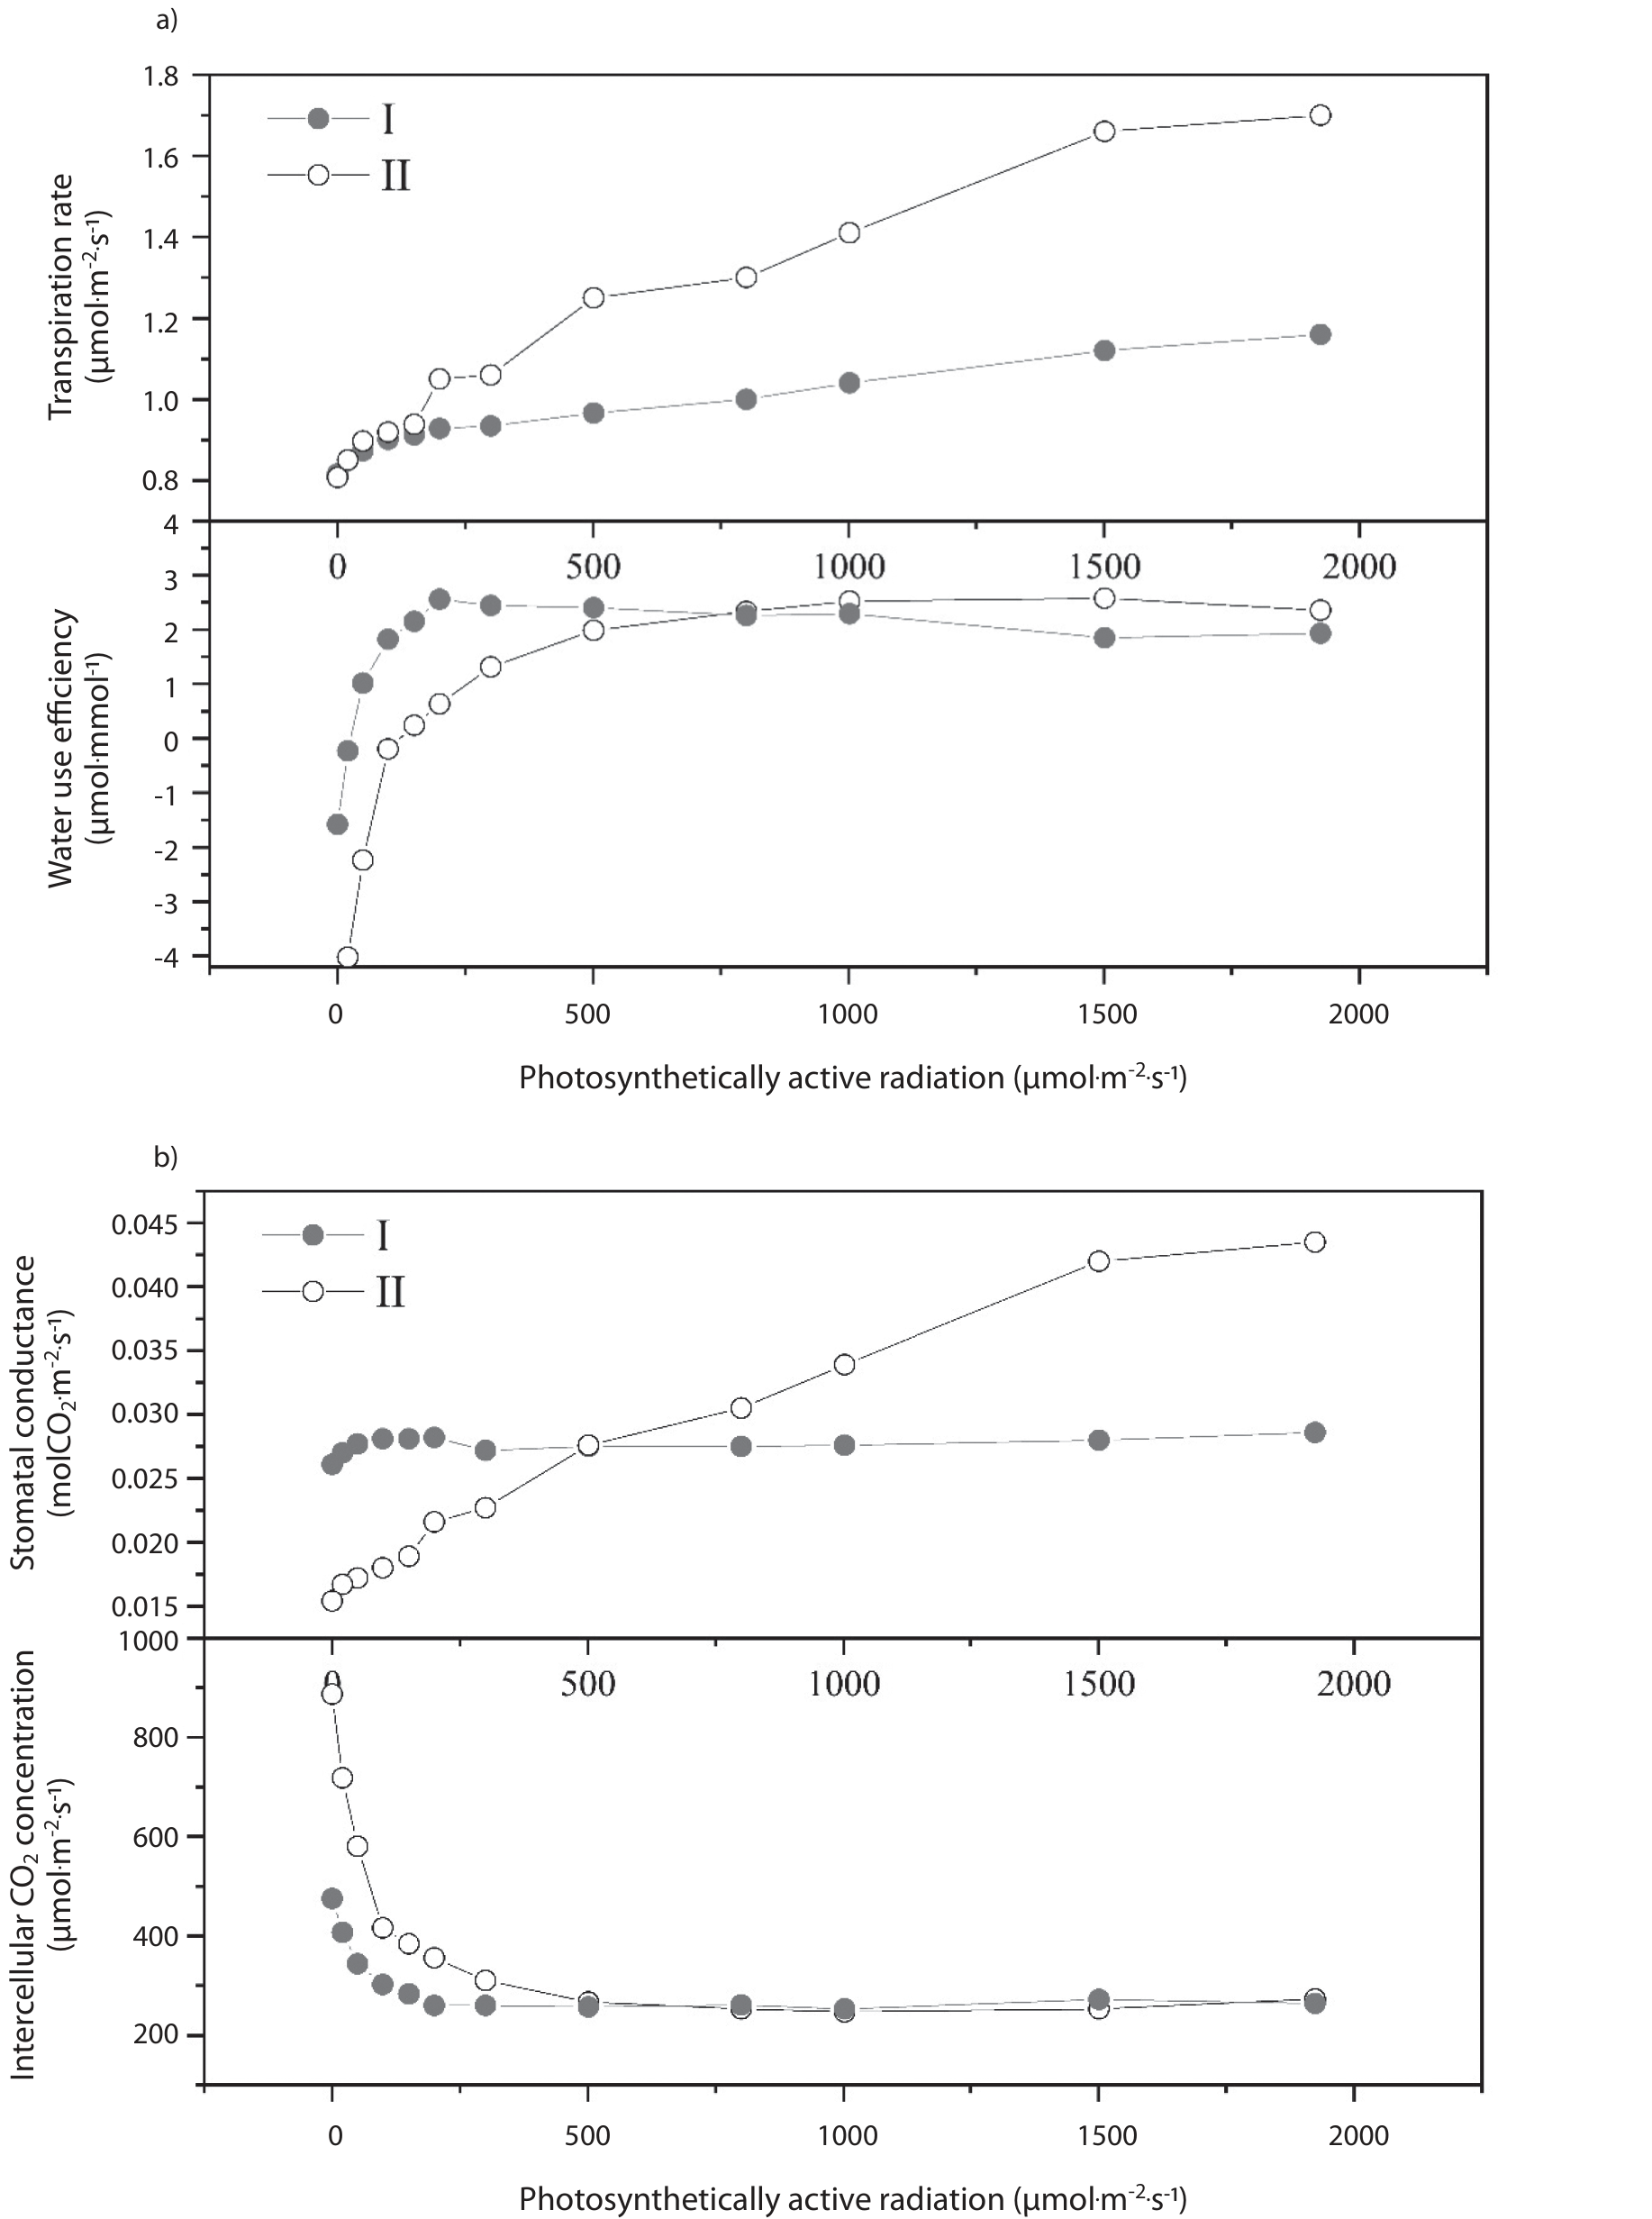
Under weak light conditions (0–250 μmol·m-2·s-1), B. spectabilis had higher WUE and Gs compared to P. lobata, resulting in a higher Pn and lower Ci (Fig. 4). As the PAR increased, the Tr, WUE, and Gs of P. lobata rapidly increased, whereas the corresponding rise in B. spectabilis was slower. Consequently, this resulted in a rapid increase in the Pn of P. lobata, surpassing that of B. spectabilis, and a rapid decrease in Ci (Fig. 5). Under drought conditions, the two species exhibit distinct adaptive strategies. B. spectabilis employs a lower organic matter decomposition rate (lower Rd) and maintains stable Gs to reduce organic matter consumption and excessive water transpiration. However, solely enhancing WUE leads to a slight increase in Pn. This can be compared to the strategy of deciduous plants shedding leaves to reduce transpiration and entering a dormant state throughout the entire drought period [29]. In contrast, The P. lobata responds actively to increased light levels by augmenting Gs, Tr, and WUE, thereby enhancing the rate of organic matter accumulation, and exhibiting a performance similar to non-water-stressed state [5].
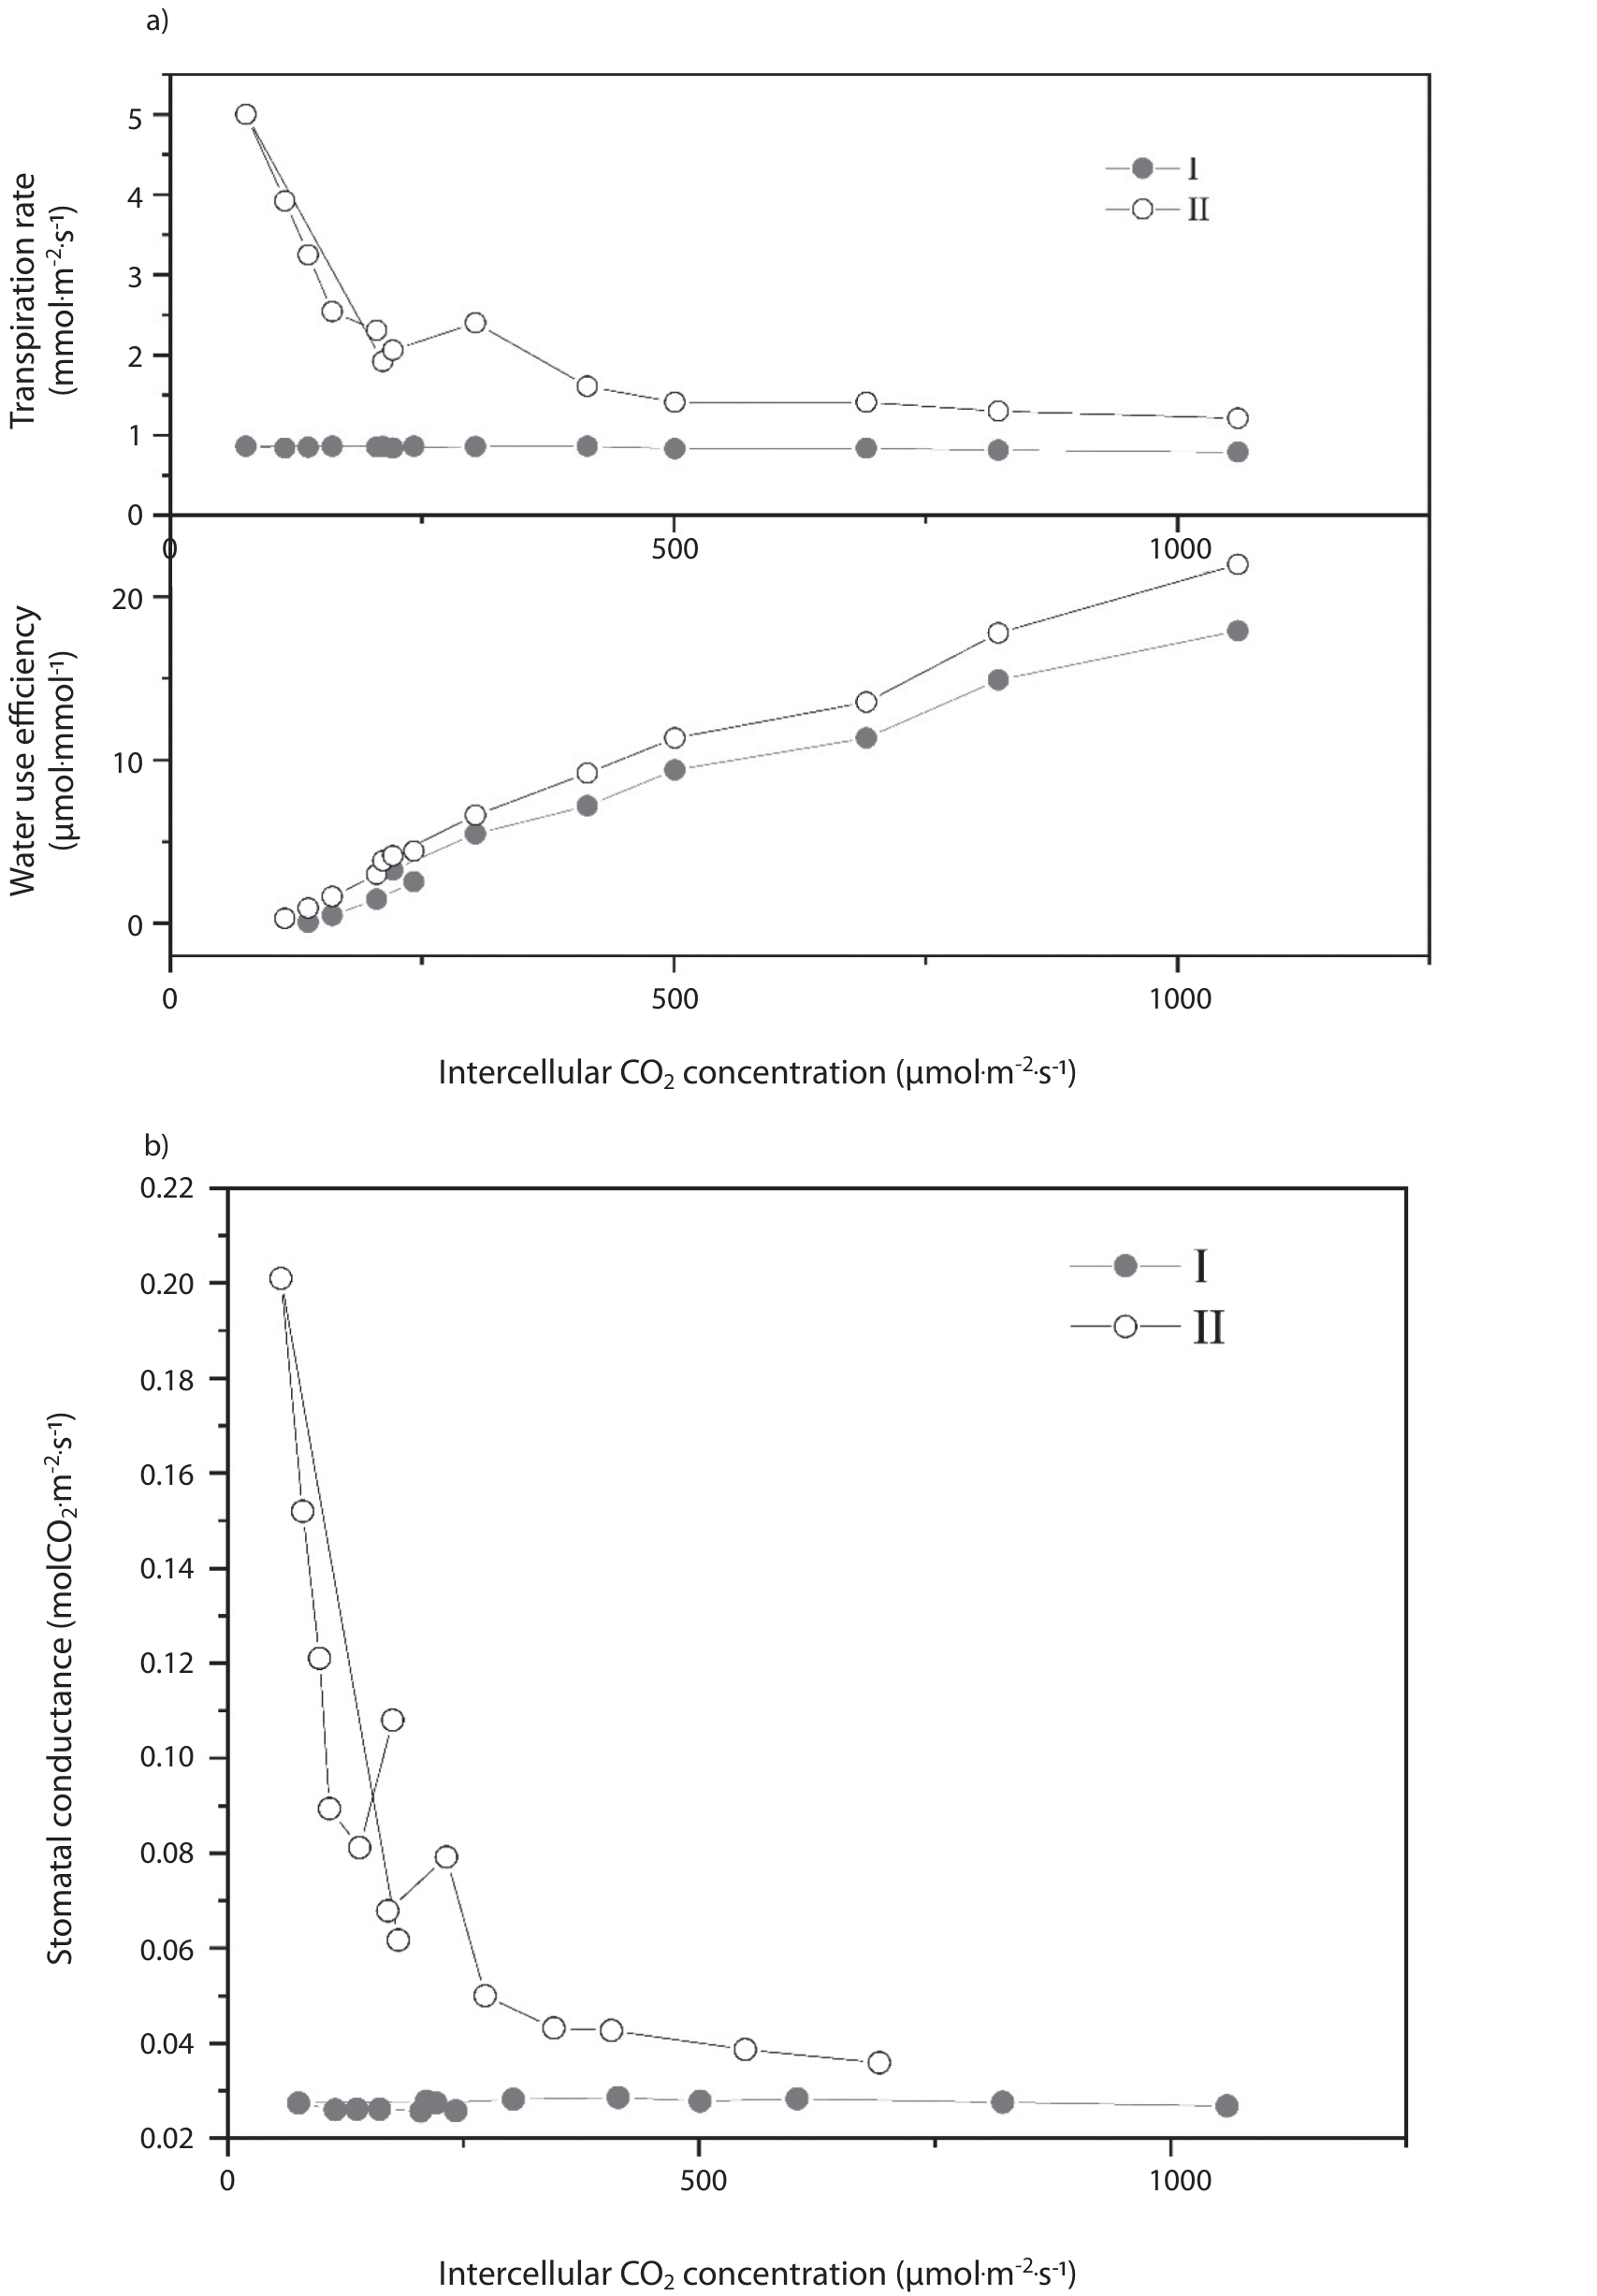
WUE in both B. spectabilis and P. lobata was positively correlated with Ci. The Tr and Gs of P. lobata rapidly decreased at Ci levels between 0–250 μmol·m-2·s-1, followed by a slower decline (Fig. 6). The higher concentration of CO2 enables plants to engage in photosynthesis more efficiently, thereby reducing the demand for stomatal opening. By reducing stomatal aperture, plants can effectively regulate water balance and decrease transpiration rates in environments with elevated CO2 concentrations [30]. Meanwhile, B. spectabilis consistently maintains lower Gs and Tr to minimize water consumption (Fig. 6).
Indicative Significance of P. lobata and B. spectabilis in Response to Environmental Changes
Research indicates that water stress significantly impacts the light response of Cucumis sativus leaves, leading to a reduction in their photosynthetic capacity [21]. Water stress not only reduced gas exchange parameters, such as Gs, Tr, and WUE of Bothriochloa ischaemum, but also reduced the parameters of the Pn-PAR curves, such as Pn, AQE, and Ic. Water serves as the primary limiting factor for photosynthesis in B. ischaemum, and appropriate nitrogen application can enhance its potential photosynthetic capacity under water-deficient conditions [31]. When the relative soil moisture content falls below the optimal range, Pn and plant growth decrease significantly by influencing various cellular and physiological processes [32, 33]. Therefore, under severe drought conditions, the Pn max of B. spectabilis (2.38 μmol·m-2·s-1) and P. lobata (4.14 μmol·m-2·s-1) in this study were lower compared to Bidens pilosa (6.5 μmol·m–2·s-1), P. euphratica (8.41– 12.60 μmol·m-2·s-1) [10] and Mangifera indica (3.45– 3.97 μmol·m-2·s-1) [7].
Under low irradiance, photosynthesis is limited by the electron transfer rate, while under high irradiance, photosynthesis is often limited by Rubisco activity [34]. Consequently, as the light intensity gradually increased, the Pn of B. spectabilis and P. lobata also increased gradually and then stabilized after reaching the Isat.
Generally, for species with C3 photosynthesis, elevated CO2 leads to a 50% increase in Pn [35], and a 157% increase in plant biomass and leaf area [36]. Free-air CO2 enrichment technology developed recently [37, 38] can increase the CO2 concentration by 150% under field conditions, resulting in a 31% increase in the photosynthesis rate and an approximately 18% increase in crop yield [25, 39–41]. Although short-term exposure to elevated atmospheric CO2 can lead to a significant increase in photosynthesis in many plants, long-term growth in elevated CO2 typically results in a smaller increase in photosynthesis owing to reduced photosynthetic capacity [37, 38].
In the face of future frequent, extreme droughts and continuously increasing CO2 concentrations, P. lobata is expected to exhibit better adaptation to changing water availability and atmospheric CO2 levels than B. spectabilis; it maintained a higher photosynthesis rate and faster biomass accumulation, rendering it a superior species choice for restoring rocky desertification slopes. However, B. spectabilis is capable of surviving and maintaining a lower growth rate under drought conditions by retaining lower Gs and transpiration rates, thus fulfilling the landscape requirements of highways. Integrating vine and shrub planting in vegetation configuration contributes to soil and water conservation on rocky desertification slopes and enhances ecosystem stability [42]. Measuring the photosynthetic response of plants is a rapid method for screening plants suitable for this purpose. It should be noted that the challenges associated with capturing the extreme arid climate conditions resulted in the small sample size, short study period, and lack of replication of this study at different sites. These limitations could be addressed in future studies by expanding the sample size and conducting studies across multiple sites with similar conditions or using indoor simulations.
Conclusions
(1) The RHMM is the most effective model for P. lobata and B. spectabilis light and CO2 response curves under severe water deficit conditions. It can simulate the stabilization or decline of the Pn after reaching the Isat, with simulated values closely approximating the true values compared to other models.
(2) Under drought conditions, P. lobata and B. spectabilis demonstrate distinct adaptive strategies. B. spectabilis enhances WUE, resulting in a slight increase in Pn response to elevated PAR and CO2. It maintains stable Gs and Tr to mitigate organic matter consumption and excessive water transpiration. In contrast, P. lobata responds actively to increased PAR by increasing Gs, Tr, and WUE. Meanwhile, B. spectabilis reduces Gs and Tr to minimize water consumption while enhancing WUE to promote a higher organic matter accumulation rate.
(3) P. lobata responded faster to light and CO2 changes and exhibited higher WUE. Therefore, it could better adapt to changes in water availability and atmospheric CO2 increases than B. spectabilis, making it a superior choice for restoring rocky desertification slopes. Consequently, simultaneous measurement of the photosynthetic response characteristics of plants provides a rapid and effective method for species selection in rocky desertification slope restoration.

