

Introduction
Globally, escalating environmental concerns have heightened public awareness of issues like climate change, air and water pollution, and biodiversity loss. This growing environmental consciousness has propelled corporate environmental responsibility (CER) to the forefront of corporate social responsibility. As corporate actions profoundly impact sustainable development, natural resources, and future generations’ well-being, public demand for increased environmental accountability from businesses is intensifying. Understanding how public environmental concern influences CER is thus crucial for fostering corporate sustainability and environmental challenges.
The rise of the Internet and information technology has empowered the public, expanding their influence on societal and economic dynamics [1]. Currently, there is considerable literature examining public environmental concerns. Some scholars investigated the public environmental concern as an independent variable, exploring its effects on corporate green total factor productivity [2], urban environmental pollution [3], corporate ESG performance [4], and operational efficiency [5]. Additionally, other scholars explored public environmental concern as a mediating variable, examining whether environmental regulations can influence air pollution through it [6]. However, there is currently no literature addressing whether and how public environmental awareness affects CER.
Corporate environmental responsibility encompasses a series of actions undertaken by companies to achieve environmental sustainability, actions that must comply with environmental ethics and legal regulations [7]. As ecological civilization construction progressed, stakeholders increasingly demanded more urgent and specific environmental responsibilities from companies. These demands, conveyed to companies in the form of legitimacy pressures, required increasing investment in environmental protection and active participation in environmental management. This was to address growing environmental challenges [8]. In recent years, many scholars have explored factors influencing CER. Some have analyzed corporate governance aspects such as board size [9], board diversity [10], board independence [9], gender diversity [10], board meeting frequency, CEO duality [11], and the existence of Corporate Social Responsibility committees’ impact [12] on CER. Others, drawing on the upper echelons theory [13], have examined the influence of senior management’s personal traits on environmental responsibility, such as managerial overconfidence [8] and commitment [14]. However, the literature in this field remains relatively scarce. In addition to analyzing the impact of internal stakeholders, scholars have explored external factors based on the stakeholder theory. These factors include government regulations [15], media attention [16], government subsidies [17], and policy implementation [18]. Overall, existing studies have explored the factors influencing CER from various theoretical and practical perspectives, which form the theoretical basis for this study. However, a unified framework analyzing these factors alongside public environmental concern and CER is rare. Does the influence of public environmental concern on CER depend on these theoretical factors, and if so, how do they impact it?
Addressing the research gap outlined above, this study elucidates the specific mechanisms through which public environmental concern affects CER. Utilizing data from Chinese A-share listed companies spanning from 2012 to 2022, various factors, including ownership concentration, executive environmental awareness, and environmental taxes and fees, are integrated into a unified analytical framework. The study embeds threshold models, mediation effects, and moderation effects to critically examine the impact of public environmental concern on CER. Furthermore, a heterogeneous analysis is conducted to explore how public environmental concern’s influence on CER varies across companies with different property rights, pollution levels, and geographical regions.
This study’s novelty and marginal contributions lie in several aspects.
Firstly, it integrates public environmental concern, equity concentration, executive environmental awareness, environmental taxes and fees, and CER into a cohesive analytical framework, thus broadening the perspective on public environmental concern and CER and providing rich insights into CER.
Secondly, from the perspective of corporate governance, this study employs a threshold model to investigate the single-threshold moderating effect of equity concentration on the relationship between public environmental concern and CER.
Thirdly, based on the upper echelons theory, this study introduces the novel factor of executive environmental awareness. It analyzes how public environmental concern influences CER through it. This not only extends the application paradigm of upper echelons theory but also enriches the literature on managerial traits in decision-making, thereby deepening the understanding of micro-level factors influencing CER.
Lastly, from the perspective of stakeholder theory, this study examines the moderating effect of environmental taxes and fees on the relationship between public environmental concern and CER, elucidating the role pathway of external stakeholders in corporate governance and innovating current literature on the influence of external stakeholders on corporate decision-making logic.
These findings not only contribute theoretically to the extension of upper echelons theory and stakeholder theory but also provide new insights and empirical evidence for developing countries with similar institutional and cultural backgrounds to better understand the relationship between public environmental concern and CER.
Material and Methods
Literature Review
Mechanisms for Influencing Corporate Environmental Responsibility
Stakeholder theory emphasizes the importance of considering the preferences of various stakeholders, including the public, for gaining broader support and legitimacy [19]. According to the 2019 Environmental Awareness Survey of Chinese Urban Residents Report by the Public Opinion Research Center of Shanghai Jiao Tong University, over 80% of respondents expressed clear support for policies such as waste sorting, vehicle number restrictions, and the prohibition of fireworks and firecrackers during the Spring Festival. This indicated the public’s willingness to actively contribute to environmental protection [20]. With rising public environmental concerns, companies faced increasing pressure to adopt environmentally responsible practices. The public, as a key stakeholder, demands higher environmental standards from businesses, pushing them towards improved environmental performance and transparency. To assuage public apprehensions, firms might proactively enhance their eco-friendly practices and provide increasingly effective ecological data, augmenting their environmental responsibility.
The upper echelons theory posited that top managers, as the main agents of corporate strategic decision-making, interpret organizational situations highly subjectively [21]. They adopted strategic behaviors with individual characteristics based on their cognition, values, and experiences, resulting in a noticeable “managerial effect” on corporate decisions [8]. Additionally, numerous perception-based studies suggested that personal attitudes, beliefs, and emotions do not directly influence behavior but guide behavioral decisions by shaping individuals’ awareness and stimulating their interest in corporate green initiatives [22]. Some scholars found that top executives, as senior managers, make behavioral decisions for the organization in response to external environmental influences [23]. Simultaneously, as leaders in the organization, their high commitment to environmental protection was believed to have a significant impact on the organization’s CER strategy [21]. These theories and studies laid a profound theoretical foundation for this research. Based on the aforementioned theories and studies, this paper assumed that top executives, as influential figures within the organization and the central hub of information processing, have a significant impact on the organization’s strategic decision-making.
Based on this premise, the study proposes the following hypotheses:
H1: Public environmental concern positively promotes CER.
H2: Executive environmental awareness mediates the effect of public environmental concerns on CER.
Public Environmental Concern, Equity Concentration, and Corporate Environmental Responsibility
Effective corporate governance is crucial for firms to act responsibly, especially concerning environmental issues. One key aspect of corporate governance is the structure of shareholdings, specifically the level of equity concentration. Equity concentration refers to the degree to which ownership of a company is concentrated in the hands of a few large shareholders. This concentration level can significantly influence how firms respond to public environmental concerns. Extant research demonstrated that varying levels of equity concentration yield differing impacts on monitoring mechanisms.
In firms with high equity concentration, a small group of major shareholders held significant power and influence. This structure fostered robust oversight of the executive team, reducing the risk of environmental misconduct or neglecting public concerns. However, it could also limit executives’ autonomy, hindering their ability to implement innovative and proactive environmental strategies. T. Wang & Cheng (2022) emphasized the importance of managerial independence as a corporate governance mechanism. It balanced the interests of large shareholders with the need for flexible decision-making that can benefit both firm value and environmental performance [24]. Conversely, in firms with widely dispersed shareholdings, individual shareholders had less power to monitor the executive team’s actions. This could lead to a lack of accountability and create opportunities for executives to prioritize short-term profits over long-term environmental sustainability. While dispersed ownership could foster greater executive autonomy, it also increased the risk of neglecting public environmental concerns due to weaker oversight mechanisms [25]. Guerrero-Villegas et al. (2018) argued that neither extreme - high or low equity concentration - consistently promoted responsible corporate behavior and enterprise development. Instead, maintaining a moderate level of equity concentration appeared to be the most effective approach to maximizing firm growth and responsiveness to environmental concerns [26]. Based on the above analyses, the following hypothesis is proposed:
H3: Equity concentration may play a nonlinear role in the effect of public environmental concern on corporate environmental responsibility.
Public Environmental Concern, Environmental Taxes and Fees, and Corporate Environmental Responsibility
While environmental taxes and fees laws aimed to incentivize pollution reduction and encouraged sustainable practices, several challenges hindered their effectiveness. Concerns regarding tax standards’ fairness and the potential economic burdens they imposed on businesses contributed to suboptimal responses from enterprises. Implementing environmental responsibility practices often requires significant investments, such as procuring specialized equipment for treating industrial wastewater and complying with environmental disclosure regulations. These additional costs could elevate overall production expenses, leading some companies to scale back environmental protection activities to minimize financial strain [27]. Furthermore, within industries lacking a strong environmental focus, enterprises might hesitate to take a proactive stance on environmental responsibility. They often adopt a cautious approach, fearing the increasing scrutiny and regulatory attention that could result from being at the forefront of such initiatives [28]. This reluctance was further fueled by the potential “spotlight effect” [29], where heightened environmental responsibility could lead to greater media coverage of any shortcomings, amplifying negative news and intensifying pressure from governments and stakeholders. Consequently, companies might worry that environmental incidents could damage their reputation, stock prices, and investor trust, ultimately reducing their commitment to environmental responsibility. In summary, hypothesis H4 is proposed:
H4: Environmental taxes and fees negatively moderate the impact of public environmental preoccupation on CER.
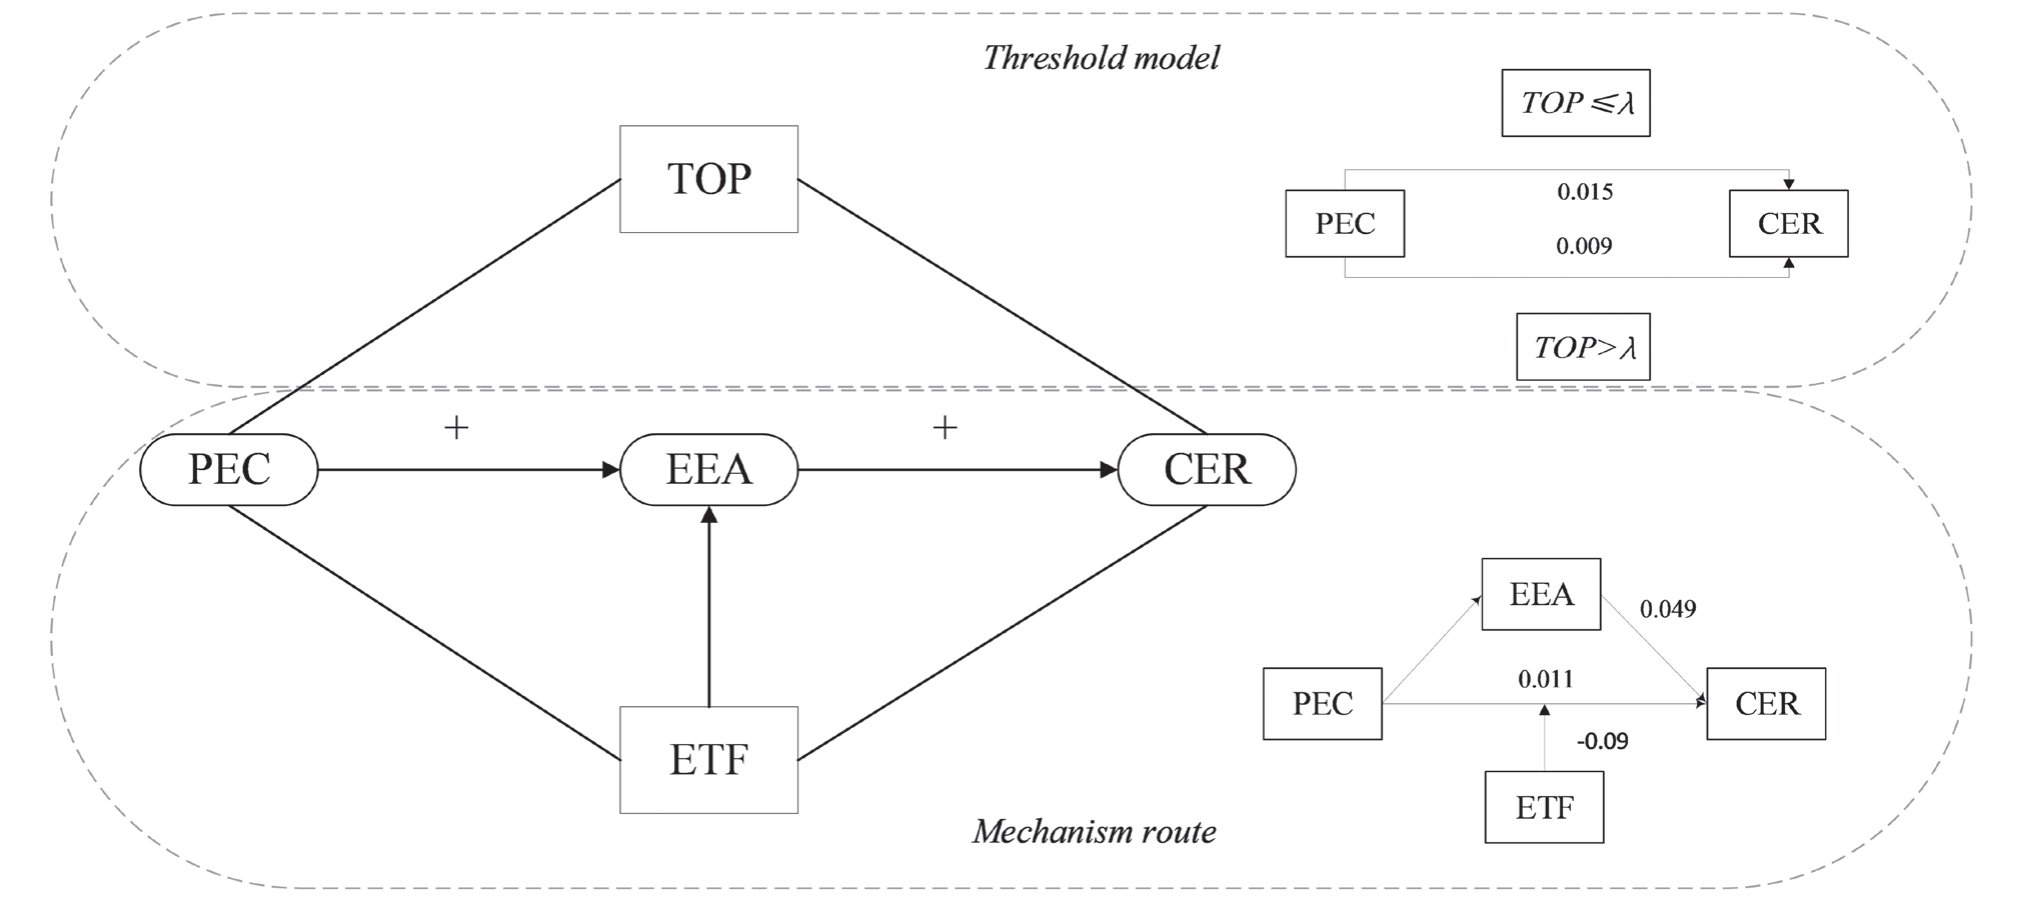
The theoretical mechanism of how public environmental concern affects corporate environmental concern is illustrated in Fig.1.
Model Construction
Basic Regression Model
To study the influence of public environmental concern on CER, this paper constructs the following basic regression model:
In formula (1), PEC represents the explanatory variable of public environmental concern, while CER represents the dependent variable of CER. ∑Year represents time fixed effects; ∑Ind represents individual fixed effects; εi represents the random disturbance term; α0 represents the intercept term; Controls denote a series of control variables, precisely firm size, firm gearing ratio, the net profit margin on total assets, number of directors, proportion of independent directors, two positions, Tobin’s Q value, firm’s years of existence, proportion of management’s shareholding, average age of management, and executive compensation.
Moderator Effects Model
To further explore how environmental taxes and fees influence the effect of public environmental concern on CER, this paper introduces the interaction term PEC×ETF between ETF and PEC based on model (1).
In model (2), the estimated coefficient of the interaction term PEC×ETF is the effect of public environmental concern on CER through the mechanism variable. If the estimated coefficient is positive, it indicates that ETF has a positive moderating effect on the relationship between public environmental concern and CER. It suggests that ETF has a negative moderating influence on the relationship between public environmental concern and CER.
Mediating Effect Model
In this paper, a stepwise regression method [30] is used to verify whether public environmental concern is related to CER through executives’ environmental awareness:
Among them, executive environmental awareness (EEA) is the mediating variable, and the rest of the variables are the same as in the baseline regression model. The specific testing procedures are as follows: The first step is to test the total effect of public environmental concern on CER and observe the coefficients α1 in the model (1). In the second step, the impact of public environmental concern on the mediating variable of executive environmental awareness is tested by observing the regression coefficients χ1 in the model (3). In the third step, the effects of public environmental concern and the mediating variable of executive environmental awareness on CER are tested simultaneously, observing the regression coefficients δ1 and δ2 in the model (4). Judgment of mediation effect: If the coefficient α1 is statistically significant, and the coefficient χ1 and δ2, are significant, then there is a mediation effect.
Threshold Effects Model
This paper adopts a threshold panel model to investigate whether there is a threshold effect between public environmental concern, equity concentration, and CER. To this end, a single-threshold regression model is set up with CER as the dependent variable, public environmental concern as the explanatory variable, and equity concentration as the threshold variable [31]. The model is as follows:
Variable Selection
Data Sources
This paper selects all companies disclosing environmental information from 2012 to 2022 as research objects. To ensure data reliability, we implement the following screening process: (1) exclusion of financial companies. (2) removal of samples with missing data.
(3) elimination of *ST, ST, and PT-designated companies. This rigorous curation resulted in 18,311 observations. The research data is primarily derived from CSMAR (China Stock Market & Accounting Research Database), Hexun.com scores, and the annual reports of the listed companies. Data processing is executed using statistical software Stata 17.0 and Microsoft Excel.
Variable Definitions
Table 1 explains the definitions and constructions of all variables.
(1) Dependent variable: Corporate environmental responsibility (CER). Existing measurements of CER have not been agreed upon, and most studies treated CER as a component of corporate social responsibility. This lacks an independent evaluation system. Given this, a seven-degree evaluation index system is constructed based on the measurement of key CER indicators [32]. We use the equal weight assignment method to sum up the scores of each indicator to measure CER fulfillment [33].
(2) Key explanatory variable: Public environmental concern (PEC). With the continuous development of the internet, we can utilize data based on internet search records to capture market participants’ attention towards specific events on time [34]. After referencing past research, we chose the Baidu smog search index as a measure of public environmental concern. This choice is primarily due to the following reasons:
Firstly, Baidu [35], as the most prominent search engine in China, possesses comprehensive coverage and high data availability. By analyzing the frequency and location statistics of searches, we can gain insights into data from every region in China. Secondly, compared to other environmental issues such as “environmental pollution”, smog possesses a relatively high level of environmental awareness. The public can perceive smog severity through air visibility. Therefore, the smog pollution-related index can effectively reflect the public environmental concern [36].
(3) Threshold variable: Equity Concentration (TOP). Drawing on previous scholars’ measures of equity concentration, indicators such as the proportion of shares held by the top shareholders and the H-index are usually used to measure equity concentration. This paper uses the proportion of shares held by the first largest shareholder to measure equity concentration [37].
(4) Moderator variable: Environmental Taxes and Fees (ETF). Environmental taxes and fees refer to a kind of tax levied or reduced on the practicing unit according to the degree of damage or protection. This is for acts such as protecting the environment and saving resources or destroying the environment and exploiting resources [38]. Environmental taxes and charges are distinguished in a broad and narrow sense. In the general sense, environmental taxes and fees cover a wide range of taxes related to environmental protection. The main classifications include ex-post intervention-type taxes, in which environmental protection taxes predominate; resource occupation-type taxes, which include resource taxes, arable land occupation taxes, and urban use taxes; and behavioral guidance-type taxes, which include consumption taxes, vehicle, vessel taxes, and vehicle purchase taxes. In the narrow sense, environmental protection taxes mainly refer to independent taxes related to environmental protection. The narrow environmental taxes and fees in China refer to the tax formally implemented in 2018. This is a restructuring of the sewage charge and the only green tax in China [39]. This paper adopts the criterion of narrow environmental protection tax to measure the impact of environmental protection tax.
Table 1.
Variable definition table.
(5) Mediating variable: Executive Environmental Awareness (EEA). Referring to Duriau, Reger, & Pfarrer (2007), we analyze the text of annual reports of listed companies. We select relevant keywords, perform word frequency statistics to construct the green cognition of listed company executives and measure the degree of green concern in corporate management decision-making [40]. Combining relevant regulations and corporate reports, “energy saving and emission reduction”, “environmental protection strategy”, “environmental protection concept”, “environmental protection management organization”, “environmental protection education”, “environmental protection training”, “environmental technology development”, “environmental audit”, “energy saving and environmental protection”, “environmental protection policy”, “environmental protection department”, “environmental protection inspector”, “low-carbon environmental protection”, “environmental protection”, “environmental protection work”, “environmental protection governance”, “environmental protection and environmental governance”, “environmental protection facilities”, “environmental protection related laws and regulations”, “environmental protection pollution control” – the 19 words reflect the importance of energy saving and environmental protection by managers. The frequency of these words in annual reports and social responsibility reports measures corporate executives’ awareness of energy saving and environmental protection. This awareness is expressed as EEA.
(6) Control variables: Based on other scholars’ research, variables that may impact CER are selected as control variables for this paper. Firm size (Size) is the natural logarithm of annual total assets. The gearing ratio (Lev) equals the ratio of year-end total liabilities to year-end total assets. Profitability of total assets (ROA) is equal to the ratio of profit before tax to total assets. The number of directors (Board) is equal to the natural logarithm of the number of boards of directors. The proportion of independent directors (Indep) is equal to the number of independent directors divided by the number of directors. The dual function (Dual) means that the chairman of the board of directors and the general manager of the same person are 1, otherwise, it is 0. Tobin Q (TobinQ) is equal to the (market value of the outstanding shares + the number of shares of the non-existent shares × net assets per share + the book value of liabilities) / Total Assets. Company Age is equal to ln(current year - year of incorporation + 1). Management shareholding ratio (Mshare) is equal to the number of shares held by directors and supervisors / total share capital. The average age of management (TMTAge) is the average age of directors and supervisors. Executive compensation (TPay1) is equal to the natural logarithm of the total compensation of the top three executives.
Results and Discussion
Table 2 summarizes descriptive statistics, such as mean, standard deviation, and range, for each variable.
Unit Root and Cointegration Tests
Before regression analysis, the panel time series model must be tested for unit root, a prerequisite to avoid pseudo-regression. We use the HT and IPS methods (methods for testing unit roots in panel data) to determine whether all the study’s variables have a unit root, respectively. Both ways test the original hypothesis that they contain a unit root. Table 3 shows the results of the panel unit root test. Table 3 shows that most of the variables reject the original hypothesis. However, the public environmental concern does not reject the original hypothesis, so we cannot reject the original hypothesis at the level value. After that, this paper repeatedly verifies the series after first-order differencing of all variables, which can be obtained as a smooth series. This result also suggests that there may be a long-term stable cointegration relationship between these variables, so it is necessary to verify whether there is a cointegration relationship. Considering the time trend of the sample, we select the Pedroni test [41] to test cointegration in this paper. In Table 3, three test statistics of Pedroni, whose corresponding p-values are all 0.0000, indicate that the original hypothesis of “no cointegration” is firmly rejected, i.e., a cointegration relationship exists. Therefore, this paper can use the original series for regression analysis.
Benchmark Regression Analysis
In this paper, we use the statistical analysis software Stata17.0 to estimate the regression of model (1). We test the effect of public environmental concerns on CER. Table 4 shows the results, where the explanatory variables in columns (1)-(4) are CER. Column (1) shows the regression results without control variables. The results show that the regression coefficient is 0.013 and is significantly positive at the 1% level. Columns (2), (3), and (4) are the regression results with control variables, moderating variables, and threshold variables, respectively. The results show that the coefficient of public environmental concern is still significantly positive at the 1% level. This indicates that public environmental concern has a significant promotion effect on CER. Table 4 shows that the statistical characteristics of public environmental concern do not change significantly regardless of whether the econometric regression model includes the control, moderating, and threshold variables. This stability of public environmental concern across different model specifications suggests that public environmental concern acts as a consistent and independent driver of CER. This supports our hypothesis that public environmental concern positively promotes CER. Therefore, H1 is confirmed.
Table 2.
Descriptive Statistics.
Table 3.
The stationarity test result of variable.
These results may be attributed to the following reasons: First, increasing public environmental concern enhances corporate transparency and environmental responsibility pressure. This external pressure may prompt companies to place an increased emphasis on environmental responsibility to maintain their reputation and legitimacy. Second, public environmental concerns may drive changes in policies and regulations, further influencing corporate behavior. Government and regulatory agencies may introduce stricter environmental laws and policies in response to public pressure, compelling companies to elevate their environmental standards and responsibilities. Additionally, corporate management’s attitudes and decisions may be affected by public environmental concerns. Executives may recognize the connection between environmental responsibility and the company’s long-term sustainability, leading them to support environmental measures and policies in their strategic decisions.
Analysis of the Moderating Effect
Table 5 shows the regression results of model (2). Column (1) shows the total regression results of the impact of public environmental concern and ETF on CER. Column (2) is the regression result of adding the interaction term of public environmental concern and ETF. Column (3) is centered on the independent variables and moderating variables based on column (2). Columns (2) and (3) show that both the interaction and the centered interaction terms are significantly negative at the 1% level, -0.005 and -0.009, respectively. In comparison, the coefficient of public environmental concern is always considerably positive at the 1% level. This indicates that the collection of ETFs in China will inhibit CER promotion to public environmental concerns. Therefore, H4 is proved.
Next, we discuss the reasons for this result from the following aspects: First, ETF collection may, to some extent, divert corporate attention from public environmental concerns. Companies might allocate more resources to complying with environmental taxes and fees rather than responding to public environmental demands. Therefore, although public environmental concerns itself positively promotes CER, environmental taxes and fees may weaken this effect. Second, environmental taxes and fees might lead companies to adopt more short-term cost-control measures rather than long-term environmental responsibility strategies. When faced with environmental taxes and fees, companies may prioritize reducing tax expenditures over increasing long-term investments in environmental protection. This short-term behavior could diminish the positive impact of public environmental concerns on CER. Additionally, corporate management, facing dual pressures of environmental taxes and public environmental concerns, may tend to adopt more conservative strategies. These strategies could limit innovation and investment in environmental responsibility, weakening public environmental concern.
In summary, the moderating effect of environmental taxes and fees on the relationship between public environmental concern and CER indicates that while public environmental concern can positively drive CER, this driving effect may be partially offset in the presence of environmental taxes and fees. This finding emphasizes the need to consider the interplay between different measures when formulating environmental policies to achieve optimal environmental management outcomes.
Table 4.
Benchmark regression results.
Analysis of the Intermediation Effect
Table 6 shows the regression results for models (4) and (5). Column (1) in Table 6 shows the total effect of public environmental concern on CER. The coefficient of public environmental concern is significantly positive at the 1% level at 0.009. Column (2) shows the regression results of public environmental concern on executives’ environmental awareness. This has a regression coefficient of 0.001, which is significantly positive at the 1% level. Finally, column (3) incorporates the independent variable and mediator variable into the model at the same time to study the impact on CER. The results show that the coefficients of both are positive and significant. The above analysis shows that public environmental concern has a significant positive impact on CER by promoting executives’ environmental awareness. Therefore, H4 is confirmed. From the theoretical analysis, we can see that as the public’s concern for the environment increases, corporate executives’ behavior is the first to be affected. For corporate interests, executives will increase their concern for the environment. The improvement of environmental protection behavior of corporate executives will also contribute to the enhancement of CER. Therefore, H2 is proved.
Table 5.
Regression results of regulatory effect.
Table 6.
Mediating effect test results.
First, public environmental concerns can significantly increase corporate executives’ environmental awareness. When the public’s attention to environmental issues increases, corporate executives feel pressure and expectations from external sources. This leads them to prioritize environmental responsibility in decision-making. This external pressure comes not only from consumers and investors but also from the media and public opinion. Second, executive environmental awareness may prompt companies to take more proactive environmental protection measures. Executives with high environmental awareness are more likely to drive the implementation of green technologies. They optimize production processes, and strengthen environmental management, thereby enhancing CER. This behavior not only improves the company’s environmental performance but also enhances its social image and competitiveness.
In summary, public environmental concern has a significant positive impact on CER by increasing executives’ environmental awareness. This finding supports our hypothesis, indicating that public environmental concerns can effectively drive CER fulfillment. Executives play a crucial role in this process, and their heightened environmental awareness is an important driving force behind CER enhancement.
Analysis of the Threshold Effect
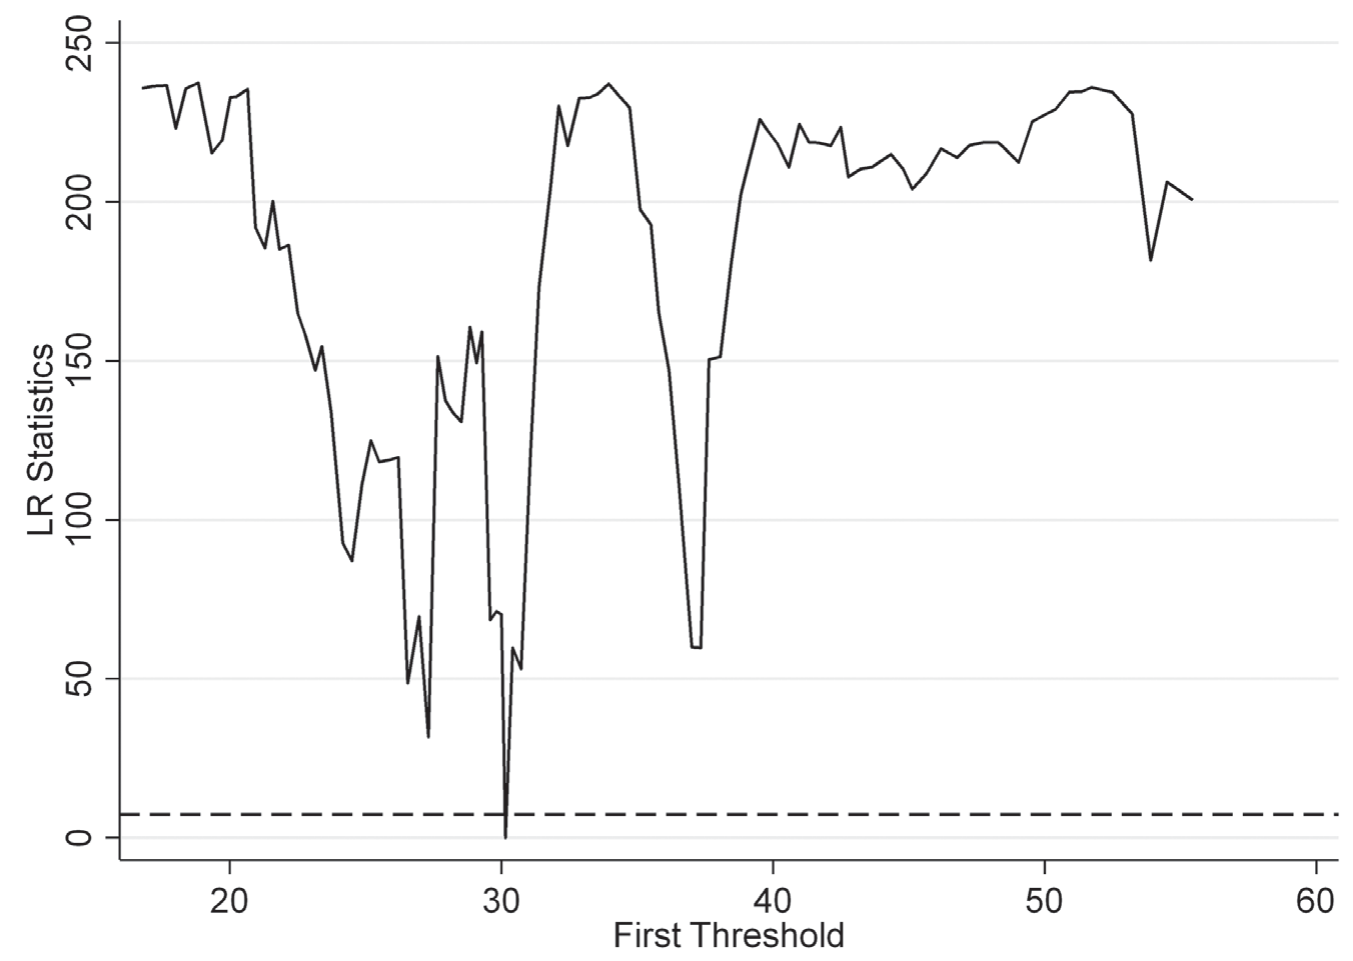
To further explore the mechanism of the moderating effect affecting CER, this paper adopts Hansen’s panel [42] regression method to conduct a threshold effect test. It uses public environmental concern as the dependent variable and equity concentration as the threshold variable. Table 7 and Fig. 3 show test results. Equity concentration passes the single threshold effect test at a 5% level, corresponding to a threshold effect value of 30.1446. At the same time, the double threshold effect test is used to verify the number of thresholds. The result rejects the original hypothesis, indicating that there is only a single threshold for equity concentration. Therefore, H3 is confirmed.
Table 8 shows regression results for fixed and threshold effects. Columns (1) and (2) show the significant positive contribution of public environmental concern to CER under fixed effects without and with control variables. Column (3) shows the size of the regression coefficient of public environmental concern on CER when equity concentration is around the threshold without control variables. We can see that the regression coefficient is 0.016 when the equity concentration is less than 30.1446, and the regression coefficient is 0.012 when the equity concentration is more significant than 30.1446. Column (3) represents the change in the regression coefficient of public environmental concern when control variables are added. The regression coefficients are 0.015 and 0.009, respectively. From this, we can see that the public environmental concern about CER has a significant facilitating effect when the firm’s equity concentration is less than 30.1446. However, it still has a significant facilitating effect when the firm’s equity concentration is more than 30.1446. Still, the facilitating effect is slightly reduced compared to equity concentration in the first stage. Table 8 reports the regression results with and without control variables. This illustrates the robustness of the regression results with fixed effects and threshold effects, further confirming H3.
Table 7.
Threshold effect test.
These results may stem from several reasons: Firstly, in companies with low equity concentration, where internal power is decentralized, executives are more likely to be influenced by external public environmental concerns and therefore adopt proactive environmental responsibility measures. This is because, in decentralized power structures, executives need to rely more on external reputation and social recognition to secure their positions, thus being inclined to respond to public environmental concerns. Secondly, for companies with high equity concentration, where executive decision-making power is more centralized, executives may still be influenced by public environmental concerns, but this influence may be weakened by relatively stronger internal power dynamics. From a practical perspective, when a company has a high equity concentration, it may be more inclined to address environmental issues through internal governance structures and direct decision-making by management rather than solely relying on external public attention. Therefore, the effectiveness of this internal decision-making mechanism may reduce public environmental concern’s influence on CER to some extent.
Table 8.
Threshold effect regression results.
Robustness Test
To ensure the robustness of the above findings, this paper verifies them through the following four methods in Table 9. The first step is to replace the dependent variable. The explanatory variables in column (1) are replaced with Corporate Social Responsibility (CSR) for CER for the robustness test, and the regression coefficients remain consistent in direction and significance. The next step is to replace the explanatory variable. Column (2) is a change in the measurement of public environmental concern by replacing the original total index with the mobile end index, and the results are robust. The third is to lag the explanatory variable. Column (3) is a dynamic regression by lagging the explanatory variable by one period to generate LPEC. This has a regression coefficient of 0.007 and is significant at the 1% level. The fourth step is to test the threshold effect model. Column (4) is the threshold model robustness test. The approach is to conduct another regression by changing the control variables of the model. Its results are consistent with the findings above in direction and significance. Overall, this paper’s findings are robust and have not changed substantially.
Endogeneity Test
To assess the model’s robustness, this study acknowledges the potential endogeneity issue, which may stem from measurement errors and omitted variables. This study’s key explanatory and dependent variables comprise composite indicators with varying dimensions, potentially introducing endogeneity due to measurement inaccuracies. Moreover, despite controlling for variables such as firm size, gearing ratio, net profit margin of total assets, proportion of independent directors, Tobin’s Q value, management’s shareholding proportion, and average management age, there could be other unaccounted factors influencing firms’ environmental responsibility.
Table 9.
Robustness test.
To recognize the potential endogeneity problem, the study employs the panel instrumental variable method to address it. The lagged order of the core variable, widely accepted as an instrumental variable by most scholars, is adopted here. This is done using the lagged two orders of public environmental concern as the instrumental variable. Table 10 contains two-stage least squares regression analyses. Columns (1) and (2) in Table 10 present the results of the first and second-stage regressions, respectively.
The first-stage regression coefficients of the instrumental variables exhibit a positive correlation with public environmental concern at the 1% significance level, confirming the logical selection of instrumental variables. In the second stage, the instrumental variables regression results indicate a positive correlation at the 5% significance level between public environmental concern and CER. This suggests that heightened public environmental concern promotes CER enhancement.
The results remain consistent with the previous findings after conducting regression analyses using instrumental variables. Additionally, the F value from the weak identification test of instrumental variables significantly exceeds 10, rejecting the initial hypothesis and affirming the validity of instrumental variable selection. Even after robustness and endogeneity tests, the paper’s conclusion remains valid, reaffirming H1’s validation.
Heterogeneous Analysis
Heterogeneous Analysis of Property Rights
Column (1) in Table 11 represents the regression results of the state-owned enterprise sample, and column (2) represents the private enterprise results [43]. The regression results in the table below show that the coefficient of public environmental concern in column (1) is significantly positive at the 1% level. In contrast, the regression coefficient of public environmental concersn in column (2) is not significant. This shows that public environmental concern has a more significant impact on state-owned enterprises’ environmental responsibility than private enterprises. State-owned enterprises will pay more attention to improving their CER in the face of increased public environmental concern. In contrast, private enterprises have no significant effect on public environmental concern change. State-owned enterprises may be subject to more public supervision and government regulation and, therefore, more susceptible to public concern’s influence.
Heterogeneous Analysis of Pollution Levels
Columns (3) and (4) in Table 11 indicate the effect of public environmental concern on CER for firms with different pollution levels. Column (3) denotes heavily polluted firms, and column (4) denotes non-heavily polluted firms. The regression results in the table show that in non-heavily polluted firms, the regression coefficient of public environmental concern is significantly positive at the 0.010 and 1% levels. In contrast, the regression coefficient for heavily polluted firms is not significant. We can see that for heavy-polluting enterprises, the increase or decrease of public environmental concern does not significantly increase the environmental responsibility of the enterprises themselves.
Table 10.
IV-2SLS Test.
Table 11.
Heterogeneity regression results 1.
Firstly, non-heavy-polluting enterprises typically face less environmental regulation and social pressure, making them more responsive to public environmental concerns. For these enterprises, public environmental concerns can serve as a driving force for improving environmental responsibility and enhancing their image. Therefore, public environmental concern promotes the CER of these enterprises. Secondly, heavy-polluting enterprises, due to their production nature and industry characteristics, often face stricter environmental regulations and greater environmental pressure. These enterprises may have already implemented relatively comprehensive measures in environmental governance, resulting in a smaller marginal impact of public environmental concern. Additionally, heavy-polluting enterprises may rely more on internal governance mechanisms and legal regulations rather than public opinion pressure, leading to the insignificant impact of public environmental concern on these enterprises. Furthermore, heavy-polluting enterprises typically have significant investments in environmental governance and already possess certain infrastructure and management systems. Therefore, changes in public environmental concern may not significantly affect their CER. This may also explain why the regression coefficient of public environmental concern is not significant in heavy-polluting enterprises.
Heterogeneous Analysis of Regions
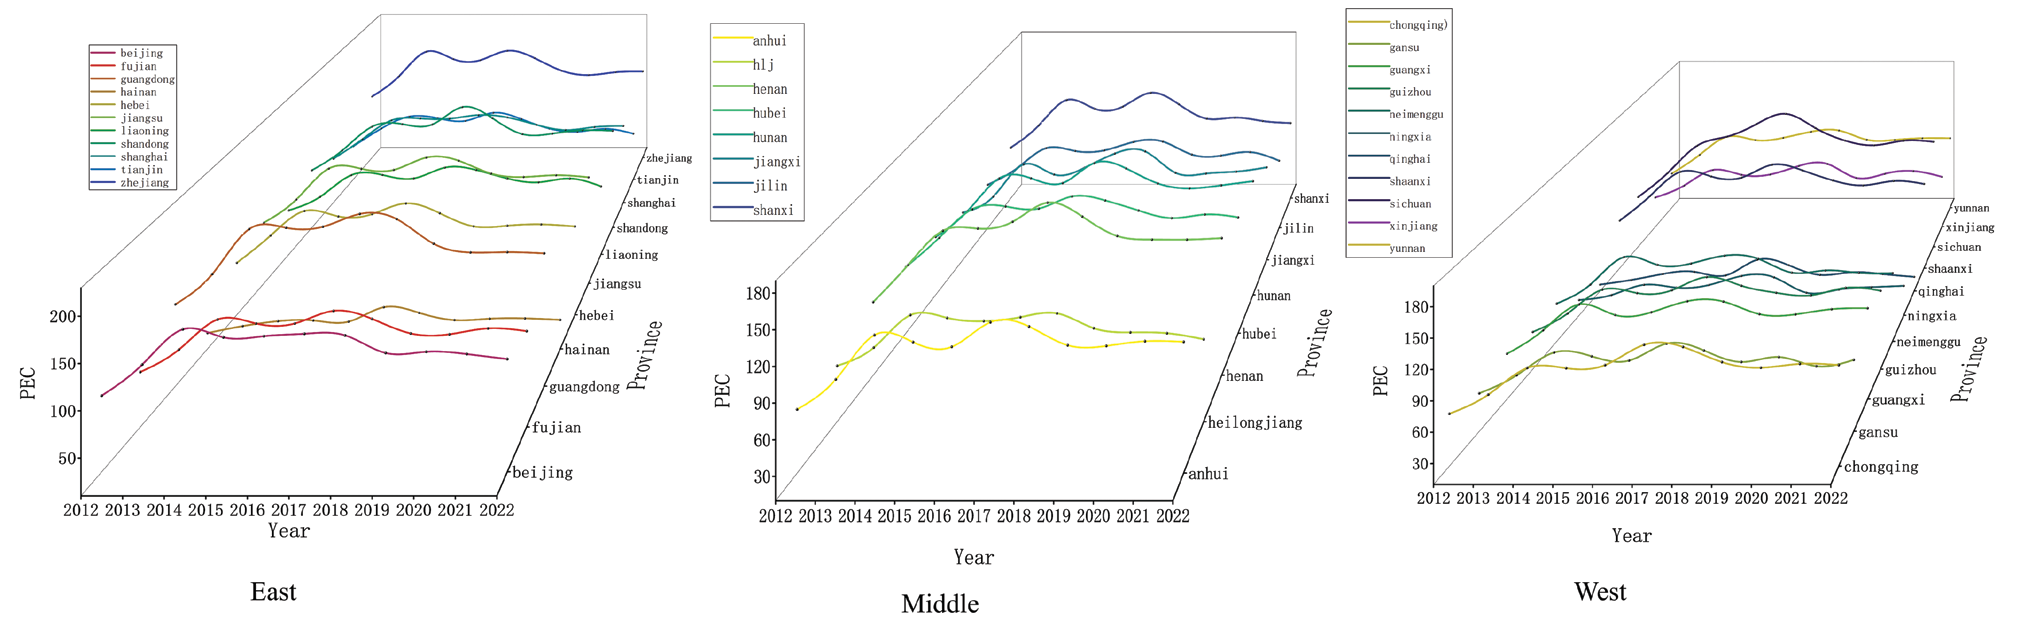
Fig. 3 and Fig. 4 below show that the regional economic development in China is unbalanced, and different provinces have different levels of public environmental concern. Table 12 shows the panel regression results for three regions: east, west, and central. Overall, public environmental concern significantly enhances CER, but there are significant differences among the three major regions in China [44]. Columns (1), (2), and (3) in Table 12 denote the regression results of three regional samples in the east, west, and central regions, respectively. The results indicate that public environmental concern affects CER significantly only in the eastern region. This result may be because the eastern region is more economically developed, has more universities and research institutes, and enterprises pay more attention to green environmental responsibility. The relatively higher level of social development and environmental awareness in the eastern region leads the public to pay more attention to enterprises’ environmental responsibility. In contrast, in the central and western regions, due to the scarcity of the economy and resources and the fact that most enterprises are heavily polluting enterprises, enterprises do not pay much attention to the public’s concern for the environment and do not actively undertake environmental responsibility for enterprises’ environmental responsibility. environmental responsibility.
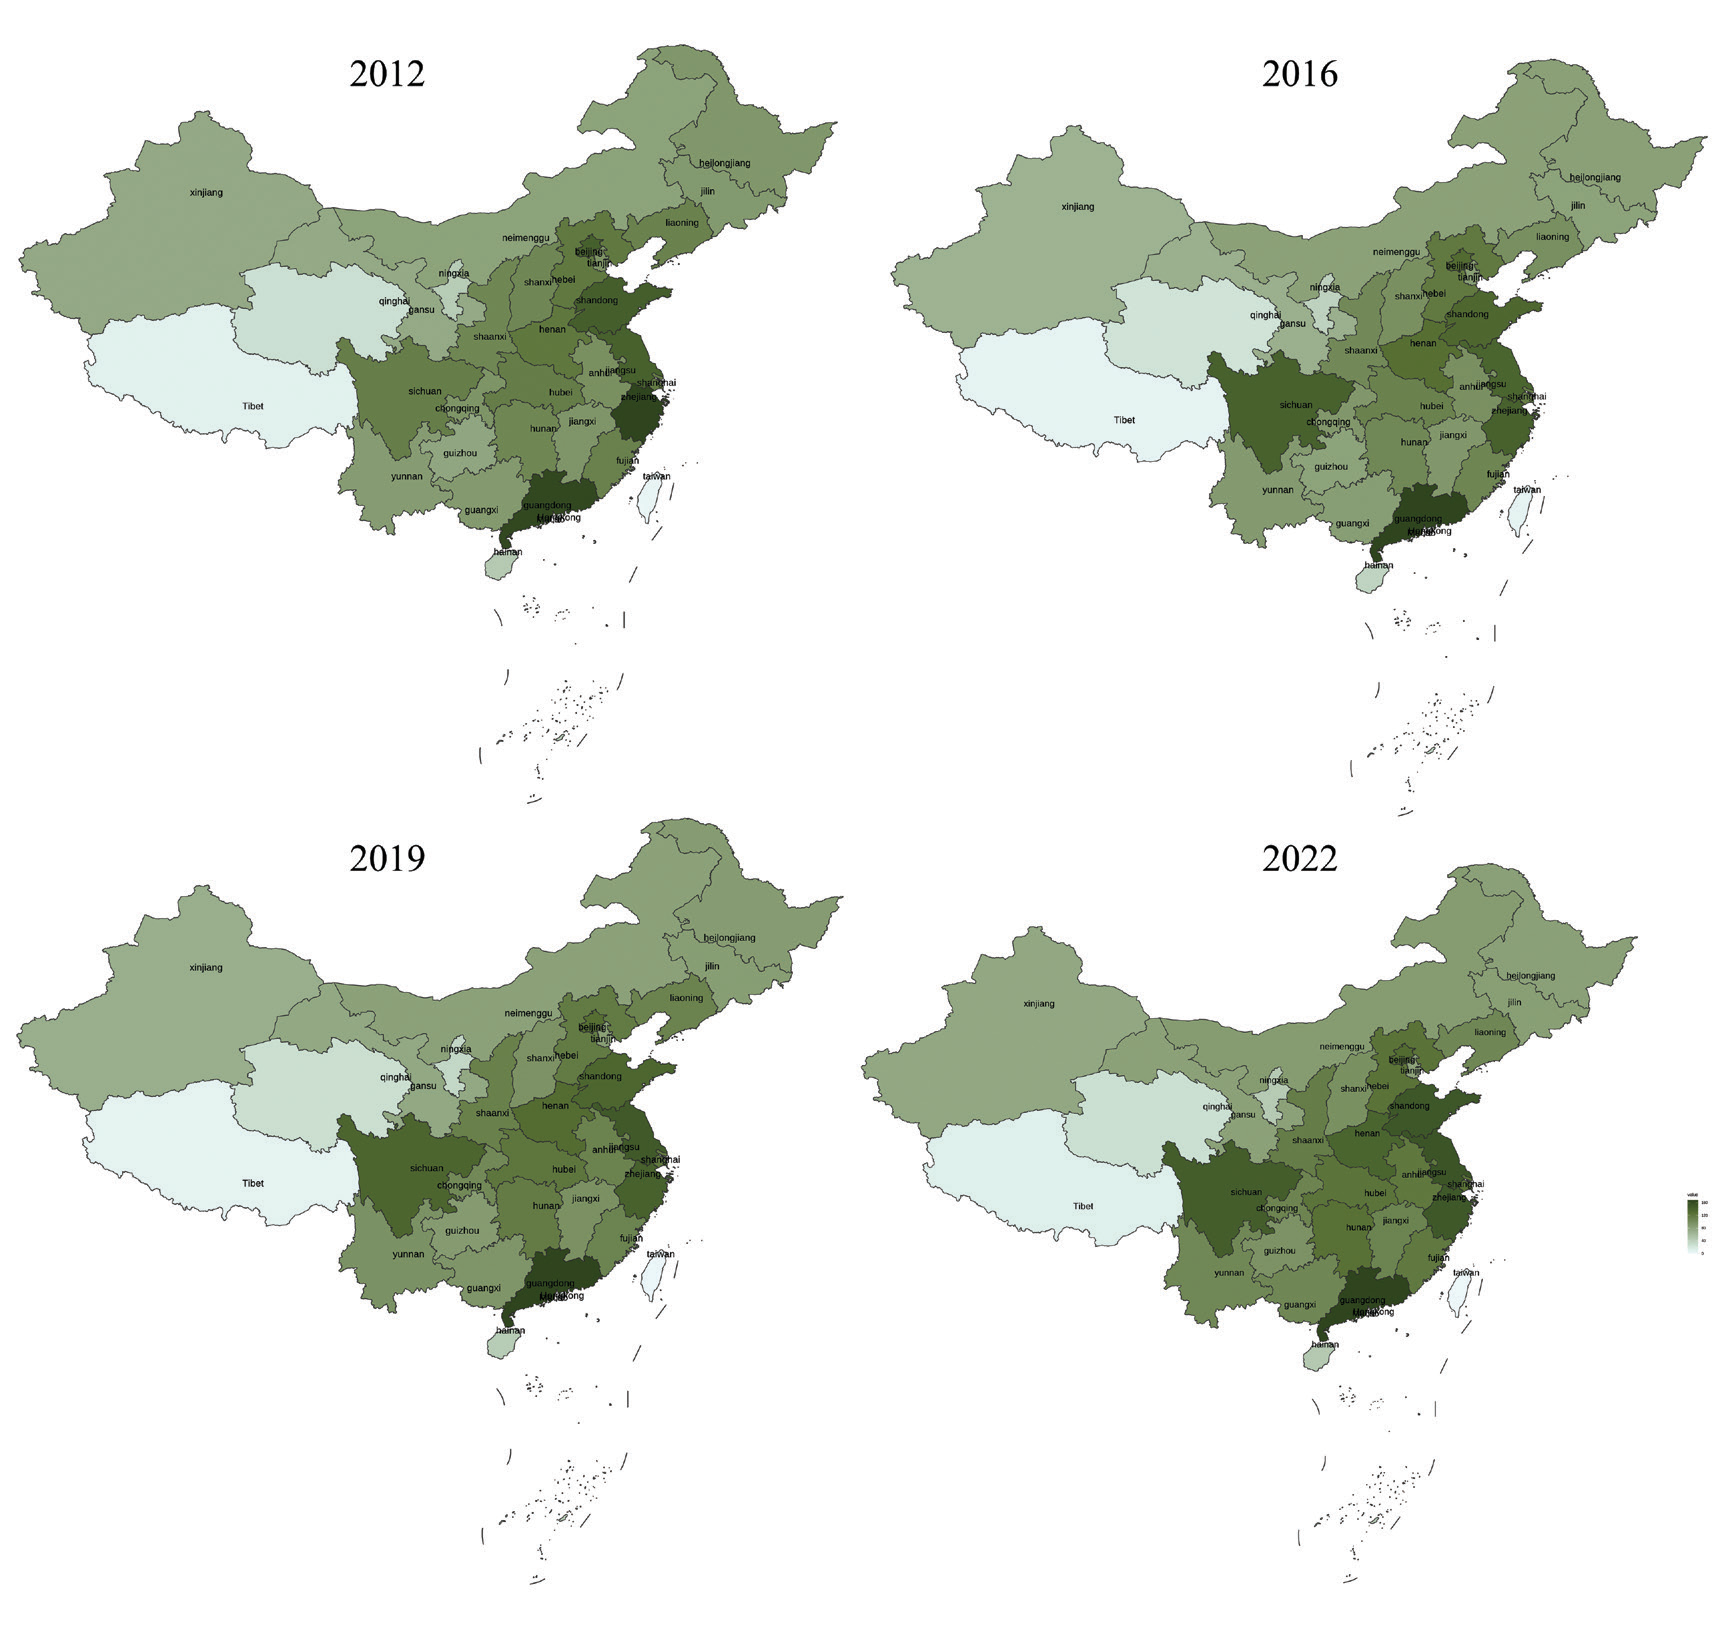
Table 12.
Heterogeneity regression results 2.
Conclusions
This study integrates upper echelons theory and stakeholder theory to examine whether and how public environmental concern affects CER within a unified framework. The discussion indicates that public environmental concern positively influences CER. From a corporate governance perspective, public environmental concern actively promotes CER below a certain threshold. However, its influence weakens when equity concentration exceeds this threshold. At the micro-level, executives, as crucial links between internal and external factors, mediate the positive impact of public environmental concern on CER. Analyzing from the perspective of external institutional pressure, environmental taxes, and fees diminish the positive effect of public environmental concern on CER. These findings highlight the importance of public pressure in promoting CER and elucidate the complex interactions among various factors affecting CER. This study expands the application of upper echelons and stakeholder theories in CER, offering both practical and theoretical insights.
This research provides several practical recommendations for enhancing CER:
Executive Education: Executives should strengthen their knowledge of green practices and enhance their environmental awareness. They should cultivate a spirit of innovation, expand their understanding of ecological opportunities, and increase their proactive environmental consciousness. Additionally, they should focus on addressing societal issues like social entrepreneurship and public crises to enhance their responsible environmental awareness. This will accelerate ecological innovation in small and medium-sized enterprises.
Diversified Shareholding: Companies should reduce equity concentration by introducing more diverse shareholders. This would encourage executives to place greater importance on external public environmental concerns and social recognition, thereby adopting more proactive environmental responsibility measures.
Government Policies: Governments should enact and enforce strict environmental regulations and policies to ensure companies adhere to environmental standards and enhance their environmental responsibility. When formulating environmental tax policies, governments should consider their potential impact on CER, ensuring that taxes incentivize environmental measures without excessively burdening companies economically.

