

Introduction
Water is a vital element for the existence and sustainability of all living forms on Earth, making it a significant environmental component. As a result, the need for water is growing due to various anthropogenic influences, rapid rates of population expansion, and growing urbanization [1]. Tunceli is located on the Anatolian diagonal in the eastern region of Turkey. Tunceli is in a mountainous region with peaks ranging between 1500 and 3000 m in altitude, characterized by deep valleys, plateaus, and almost no plains. Valleys between the mountains carry wide or narrow streams of water at varying flow rates depending on the geography and the water basin capacity. These streams of water have been home to numerous civilizations. With the advent of civilizations, these potable water sources have become strategic sources for cleaning, irrigation, and energy. With growing environmental change, these freshwater sources have become more critical strategic sources of economic development than ever.
Freshwater sources are vital; thus, they need to be controlled regularly with respect to quality parameters [2]. The World Health Organization (WHO) has declared that only 12% of the rural population can reach healthy water resources in 90 developing countries [3]. A water source is defined as potable if it is colorless, odorless, and clear; free from pathogens, corrosive and toxic substances, and hardness minerals; plentiful in renewable quantity; and can be obtained at a reasonable cost.
The physical, chemical, and microbiological quality of freshwater sources is vital to the health of sustainable human communities [4]. Water vapor in the atmosphere is naturally clean; however, during precipitation, it absorbs dust, gasses, fumes, microorganisms, and radioactive fallout in the atmospheric waters [5-7]. After precipitation, water is integrated into flowing streams or underground water basins through the geological structure, absorbing organic wastes, sewage, agricultural, nuclear, and industrial contaminants [8- 10]. Minerals in water are due to geological structure [11, 12]; however, other contaminants are indicators of water pollution expected to affect public health and ecological balance. Nitrogenous, phosphoric [13], and sodium-containing exogenous materials, surplus of metallic content, coliforms [14, 15], and other pathogens [16], viruses, detergents, and a variety of radioactive isotopes are among well-known water contaminants [17]. Manganese and iron minerals are considered the least poisonous heavy metal ions found in water, but they contribute to the flavor and aroma of water [18, 19]; thus, they can easily be detected by the consumer.
When water contains alkaline salts and calcium bicarbonate, its pH is >7, whereas when water contains excessive amounts of carbon dioxide, its pH is <7 due to acid reactions. Spring water is expected to be neutral or slightly alkaline (7.0<pH<8.5). Excessive alkaline behavior indicates the presence of deterioration products, while acidic pH causes corrosion in the distribution pipelines [6]. The temperature of freshwater spring sources affects the metabolism of aquatic organisms, including digestion, nutrient consumption, respiration, and nutrient absorption [20, 21]. The temperature of potable water sources is required to be between 12 and 25ºC according to the Turkish Standard 266 [22], WHO, and EC standards.
The electric conductivity of freshwater sources is an indication of total soluble solids content. These soluble solids are due to inorganic salts that ionize in water, forming calcium, magnesium, potassium, bicarbonate, chloride, sulfate ions, and ionizable organic matter. These soluble solids can be natural due to the geomorphological structure of the water basin or due to sewage, industrial wastewater, and chemicals from wastewater treatment [23-27]. Spring water sources carry soluble calcium due to the rocky structure surrounding the water basin. Non-silicate minerals such as calcite, aragonite, and gypsum, and silicate minerals such as anorthite, piroxene, and amphibol contain soluble calcium [28]. Magnesium is naturally integrated into the spring water sources due to the rocks surrounding the water basin. Rocks made of limestone and dolomite minerals containing magnesium carbonate due to serpentinization are the sources of soluble magnesium content in spring waters [28, 29]. Alkaline earth minerals, especially calcium and magnesium, found in the rocky structure surrounding these water basins, disintegrate and dissolve in water, causing hardness [30]. Freshwater sources are classified according to the French hardness value as follows: 0-7 ºFs extremely soft water, 7-14 ºFs soft water, 14-22 ºFs lightly hard water, 22-32 ºFs hard water, 32-54 ºFs extremely hard water. Sulfates can be naturally integrated into spring water sources due to the high solubility (up to 200 mg/L in cold water) of the gypsum mineral in the rocks surrounding the water basin. Oxidation of pyridine minerals also causes sulfate formation. Sulfates can also be integrated into freshwater sources externally through contaminants such as pesticides and insecticides, fertilizers, and oxidation of sulfurous wastes [31, 32].
Ammonia is found in water as either absorbed ammonia, ammonium salts, or as a result of microbiological activity. Ammonia concentrations above 0.5 mg/L are considered contaminated water [33]. Once immersed in water, ammonia undergoes a chemo-autotropic conversion reaction, forming nitrite as the intermediate product, which further oxidizes into nitrate. The undesired nitrate conversion is supported by bacteria and sunlight [34]. Phosphate ions in freshwater sources are found in ortho-, meta-, and poly-forms, with abundant soluble ortho-phosphate. The main source of phosphate ions in water is the utilization of phosphate-based fertilizers used in agriculture, and the uncontrolled disposal of animal husbandry wastes [35]. Iron concentration in freshwater sources depends on the pH, redox potential, bicarbonate concentration, and the presence of other ions [29]. Chloride is one of the important water quality indicators and is widely found in nature in the form of salts of sodium (NaCl), potassium (KCl), and calcium (CaCl2). Numerous natural and anthropogenic factors contribute to chloride levels in groundwater, including geological weathering, leaching from rocks, domestic effluent, irrigation discharge, and agricultural use [36].
Coliforms in water (total coliform and fecal coliform) indicate fecal pollution, and their molecular identification is used as a sign of fecal contamination during water quality analysis [37-39]. Microbiological properties of freshwater sources are determined according to total mesophilic bacteria count (TMBC), and pathogens are investigated based on the coliform count [6]. No coliforms should be present in 100 ml of potable water, and TMBC should not exceed 500 [40].
The present study aims to investigate water quality in Tunceli, Turkey. The region’s geography is very well-known; however, the geomorphological structure is practically unknown. The quality parameters chosen were temperature and pH; magnesium, calcium, and sulfate contents as precursors of water hardness; ammonia, nitrite, nitrate, phosphate, and chloride contents; and TMBC and coliform counts as indicators of anthropomorphic interactions. Sample collection was performed during the heavy precipitation and snowmelt season when the spring water wells are replenished. Results obtained were compared with what is required by the Institute of Turkish Standards (TS-266), the World Health Organization (WHO), and the European Community Standards (EC) to assess water quality. This study is one of the rare studies performed in Tunceli, Turkiye, that relates the regional geomorphological structure to the water quality.
Materials and Methods
Weekly spring water samples from 8 springs located in the Tunceli region (Fig. 1) were taken for a period of seven weeks, and thus 56 samples were analyzed. Samples (2 L) were collected from each freshwater spring in brown bottles according to the official regulations dictated by governmental agencies [41] during the period 22.02.2014 - 06.04.2014. This period of time corresponds to the season with the highest precipitation level in the form of snow, followed by rain and melting snow. Therefore, this is the season during which spring water sources are replenished, leaching all possible contaminants and integrating them into freshwater springs. The freshwater springs are located in Tunceli Central, Ovacik, Pertek, Hozat, Pülümür, Çemişgezek, and Nazimiye (Fig. 1 and Table 1).
Temperature, pH (Crison, pH 25, Barcelona, Spain), and electric conductivity (Crison, CM 35, Barcelona, Spain) of the samples were measured on-site during sampling. Calcium [42], magnesium [42], and chloride [43] contents, as well as total hardness [44], were determined by titrimetric methods. The samples were first filtered using Whatmann filter paper, 1:11 µm. Ammonium, nitrate, nitrite, sulfate, and phosphate concentrations were measured spectrophotometrically (Shimadzu, UV-1800, Kyoto, Japan), according to the methodology described in [44]. Iron content was determined by atomic absorption spectroscopy (Perkin Elmer, Analyst-800, Chicago, Illinois, U.S.A.) according to [45].
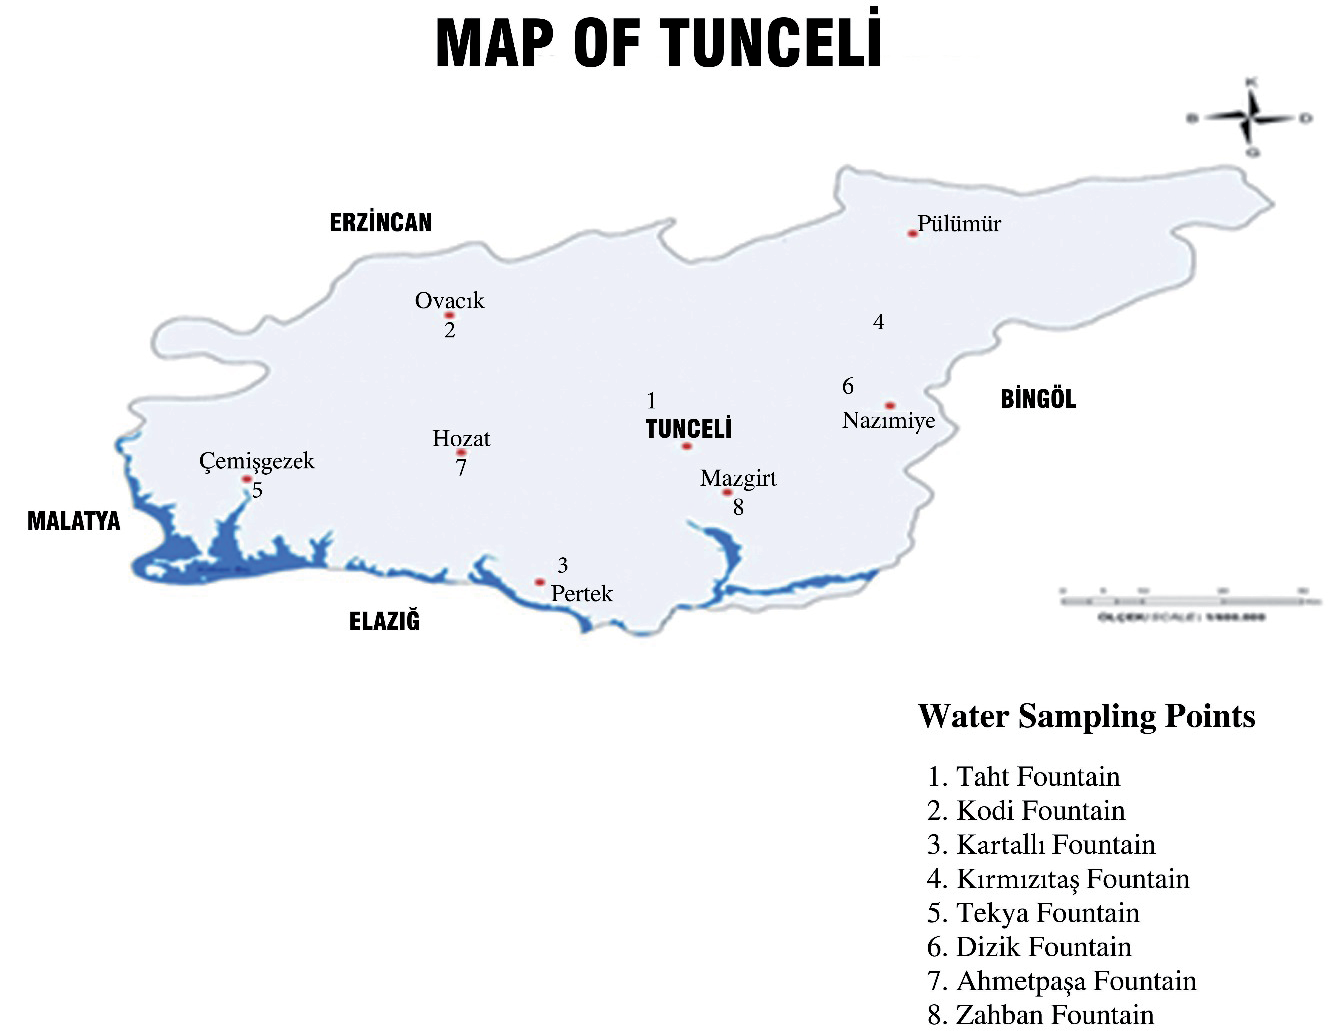
Table 1.
Sampling locations.
Total mesophilic bacteria count was performed according to [46] on Plate Count Agar (PCA, Merck, Catalog No: 1.05463, Rahway, New Jersey, U.S.A.) after 48±2 h incubation at 35ºC. Total coliform count was performed according to [47] on Violet Red Bile Agar (VRBA, Merck, Catalog No: 1.01406, Rahway, New Jersey, U.S.A.) after 18 h incubation at 35ºC.
Statistical Analysis
Samples were compared using one-way MANOVA tests (SPSS 15.00, Armonk, New York, U.S.A.). A one-way MANOVA test was used for statistical analysis. One-way MANOVA allows grouping with respect to one independent variable and enables comparison of the means of more than one dependent variable. Then, a “post-hoc” multiple Duncan comparison test allows for assessing groups significantly different from each other [48].
Results and Discussion
The present study aims to investigate the water quality of spring water sources in Tunceli, Turkey, that lie close to settlements, unlike previous studies on the hydrography of springs that feed the Munzur River [49] or on the water quality of hot water, cold water, and mineral water sources in the broader region related to the Nazımiye fault [50]. Neither of these studies included the cold water springs near Tunceli Central, Ovacik, Pertek, Hozat, Pülümür, Çemişgezek, and Nazımiye settlements investigated in the present study.
Selected physical property quality parameters were pH, electric conductivity, and temperature. Temperature is the parameter that defines whether the freshwater spring is hot or cold. Characteristics of hot and cold water springs are different, and a potable water spring has to be a cold water spring. Electric conductivity is a measure of ionic content related to the geomorphology of the well and anthropomorphic factors. Acidic pH is an indication of anthropomorphic activities.
The chemical quality parameters were selected for total hardness, calcium, magnesium, ammonium, nitrite, nitrate, sulfate, phosphate, and chloride contents. Total hardness, magnesium, calcium, and sulfate are water hardness parameters related to the geomorphology of the well besides anthropomorphic activities. Ammonium, nitrite, and nitrate contents are indicators of the nitrate cycle and anthropomorphic activities.
Microbiological quality parameters selected were the total mesophilic bacteria count (TMBC) and the coliform count. Phosphate, chloride, and microbial content are directly related to anthropomorphic activities. The region’s geography is very well-known; however, the geomorphologic structure is practically unknown. Therefore, this study is one of the rare studies that relates the regional geological structure to the water quality.
pH refers to the degree of acidity or alkalinity of a solution or water. pH is a crucial indicator that can be used to assess water quality and the degree of contamination in water bodies. The pH of the spring water sources in the Tunceli region was found to be 7.22<pH<8.36 (Table 2). Therefore, the pH of the spring waters investigated conforms to the WHO standards that require the pH of water for human consumption to be 6.5<pH<8.5 [51], while the Turkish and EC standards require 6.5<pH<9.5. The light, alkaline nature of the spring water sources investigated can be attributed to the presence of calcium-rich rocks surrounding the water basin [52-56]. Although the direct effect of pH levels on human health is not well-known, light alkaline water sources are thought to have positive effects in treating various diseases [57]. Statistical comparison of the means of seven measurements (p<0.05) from each freshwater spring (Table 2) showed that Stations 1 and 7 and Stations 3 and 4 (Fig. 1 and Table 1) were similar in terms of pH. This is probably due to changes in the micro morphologic structure of the rocks surrounding the water basins. These values aligned with the findings of other researchers [36, 58], who reported that the pH of water sources in the area is characterized by a shift toward the alkaline side of neutrality; this might be due to the geological composition of the region, which consists largely of calcium carbonate (CaCO3) [58]. Comparison of the mean pH values obtained from the eight locations was compared on a weekly basis; no significant differences (p<0.05) (Table 3) were encountered, indicating that no external acidic or basic materials are integrated into the spring water sources under investigation.
The temperature of the spring water sources investigated was between 2.9 and 12.7ºC (Table 2). Temperatures of the spring waters investigated were lower than indicated by the WHO, EC, and Turkish (TSE-266) standards that require the temperature of spring water sources on site to be between 12 and 25ºC [51]. This is likely because the measurements were performed in winter and early spring, during which the water basins are fed by melting snow. This conclusion is supported by the fact that the lowest temperature (2.9ºC) was measured at Station 7 with the highest altitude in week 1 (February). Statistical comparison of the means of seven measurements (p<0.05) from each freshwater spring (Table 2) showed that Stations 1 and 2, Stations 3, 4, and 6, and Stations 5 and 8 (Fig. 1 and Table 1) were similar in terms of temperature. This may be attributed to variations in the depth of the water basin. Comparison of the mean pH values obtained from the eight locations was compared on a weekly basis; no significant differences (p<0.05) (Table 3) were encountered.
Calcium and magnesium are also important parameters for assessing drinking water quality because of their direct relationship with the development of water hardness. The concentrations of these two elements in natural water depend upon the type of rocks. They are both essential to human health in limited amounts [59]. Hardness is mainly determined by the presence of Ca2+ and Mg2+ ions in water. Hardness is not a pollution indicator parameter; it only indicates water quality [60]. The abundance of Ca2+ and Mg2+ ions causes hardness because they tend to precipitate in the form of sulfates and carbonates in water pipelines, causing scaling. Scaling by crystallization followed by precipitation causes a driving force for more crystallization. Pressure drops in the pipeline increase, resulting in a decrease in water flow rate and finally clogging the water pipeline. The hardness values of the investigated spring water sources were between 8.44 and 39.16 ºFs (Table 2). Statistical comparison of the means of seven measurements (p<0.05) from each freshwater spring (Table 2) showed that Stations 1, 5, and 8 (Fig. 1 and Table 1) were similar in terms of hardness and classified as hard water according to the French hardness scale. These springs show the characteristics of deep wells surrounded by rocks predominantly rich in calcites, dolomites, and gypsum [61].
The electric conductivity of the spring water sources investigated was between 165.8 and 760 μS/cm (Table 2). The electric conductivity of the spring water sources investigated conforms to the WHO, EC, and Turkish [22] standards that require the electric conductivity of spring waters on site to be less than 2500 μS/cm [51]. Statistical comparison of the means of seven measurements (p<0.05) from each freshwater spring (Table 2) showed that all spring water sources were significantly different in terms of electric conductivity. Similar to pH values, the soluble solids content is also expected to be influenced by the micro morphological structure of the water basin. Similarly, a comparison of the mean electric conductivity values obtained from eight locations on a weekly basis showed no significant differences (p<0.05) (Table 3), indicating that there was no contamination by external soluble solids. Calcium and magnesium are also important parameters for assessing water quality because of their direct relationship with the development of water hardness.
The calcium content of the spring water sources investigated was between 22.44 and 102.6 mg/L (Table 2). The calcium content of the spring water sources investigated conforms to the Turkish [22] standards that require the calcium content of spring waters on site to be less than 200 mg/L. WHO and EC standards require the calcium content to be less than 100 mg/L. All the spring water sources except for the one measured at Station 4 in week 3 (102.6 mg/L) conformed to the WHO and EC standards; however, the mean calcium content over seven weeks was 70.77 mg/L (Table 3). The micro morphological structure of the rocks surrounding the water basin at Station 4 is likely to be abundant in calcium-rich minerals. Statistical comparison of the means of seven measurements (p<0.05) from each freshwater spring (Table 2) showed that all spring water sources except for Station 4 (Fig. 1 and Table 1) were similar in terms of calcium content. The weekly basis analysis from eight locations conforms with the pH, electric conductivity, calcium, and magnesium content measurements, indicating no external integration of contaminants (Table 3).
The magnesium content of the spring water sources investigated was between 1.94 and 70.04 mg/L (Table 2). The magnesium content of the spring water sources investigated conforms to the Turkish [22] standards that require the magnesium content of spring waters on site to be less than 150 mg/L. WHO and EC standards require the calcium content to be less than 50 mg/L. All the spring water sources except for Station 4 conformed to WHO and EC standards. Similarly, the calcium content of the spring water at Station 4 was found to be significantly different (p<0.05) from the other sources, confirming the abundance of calcites, dolomites, and gypsum surrounding the water basin. Statistical comparison of the means of seven measurements (p<0.05) from each freshwater spring (Table 2) showed that Stations 2 and 7, Stations 1, 5, 6, and 8 (Fig. 1 and Table 1) were similar in terms of magnesium content. The weekly basis analysis from eight locations conforms with the pH, electric conductivity, and calcium content measurements, indicating no external magnesium integration (Table 3).
Sulfate (SO42−) is another important chemical parameter for water quality and influences the taste and odor of drinking water [60]. The sulfate content of the spring water sources investigated was between 6.9545 and 40.534 mg/L (Table 2). The sulfate content of the spring water sources investigated is well below the Turkish [22] and EC standards that require the sulfate content of spring waters on site to be less than 250 mg/L. Statistical comparison of the means of eight measurements (p<0.05) from each freshwater spring (Table 2) showed that Stations 1, 2, 3, 6, and 7 and Stations 5 and 8 (Fig. 1 and Table 1) were similar in terms of sulfate content. This result parallels calcium and magnesium contents characteristic of deep wells surrounded by calcites, dolomites, and gypsum [61]. The weekly basis analysis from eight locations conforms with the pH, electric conductivity, calcium, and magnesium content measurements, indicating no external integration of contaminants (Table 3).
One-way MANOVA results were used to determine whether measured quality parameters correlate. A one-to-one correlation existed between total hardness and electric conductivity (Fig. 2) and total hardness and calcium content (Fig. 3). Also, total hardness and magnesium content (Fig. 4) and total hardness and sulfate content (Fig. 5) were highly correlated. In accordance with these results, Station 4 (Fig. 1 and Table 1), which had the highest calcium and magnesium contents, also had the highest hardness value, and Station 5, which had the lowest calcium and magnesium contents, had the lowest hardness value (Table 2).
Ammonium content at all stations (Table 2) was below 0.5 mg/L according to the Turkish standards [22] and the EC standards. Statistical comparison of the means of seven measurements (p<0.05) from each freshwater spring (Table 2) showed that all spring water sources were similar in terms of ammonium content. Ammonium and ammonia are integrated into spring water due to the leaching and fixation of nitrogen by soil bacteria. Nitrogen can be leached from natural sources such as igneous nitrous rocks, atmospheric deposition, and symbiosis between plant material and the cyanobacteria and some heterotrophs [62]. Nitrogen can also be integrated into spring water externally due to anthropogenic factors such as agricultural activities and the discharge of domestic effluent and septic tank effluent [36, 63]. Although the spring water sources were similar in ammonium content, significant differences in weekly basis analysis from eight locations may be due to different levels of animal husbandry and agricultural activities in the vicinity of the freshwater springs under investigation. Nitrite content of the spring water sources investigated (Table 2) was well below Turkish [22] and EC standards that allow 0.5 mg/L and the WHO standards that require 3 mg/L. Statistical comparison of the means of seven measurements (p<0.05) from each freshwater spring (Table 2) showed that all spring water sources were similar in terms of nitrite content, as in the case of ammonium content. Significant differences in the weekly basis analysis from eight locations may also be due to different levels of animal husbandry and agricultural activities in the vicinity of the freshwater springs under investigation. The nitrate content of the spring water sources investigated was between 0.0162 and 10.010 mg/L (Table 2). The nitrate content of the spring water sources investigated (Table 2) was well below the EC and the WHO standards that allow 50 mg/L. Statistical comparison of the means of seven measurements (p<0.05) from each freshwater spring (Table 2) showed that the nitrate content among the 8 stations was significantly different from each other, unlike the ammonium and nitrite contents. However, no significant differences in the weekly basis analysis from the eight locations were encountered (Table 3). This is likely because nitrate is the final conversion product of ammonium. The correlation between ammonium and nitrite-nitrate contents indicates ongoing conversion reactions (Fig. 6). Ammonia, nitrite, and nitrate are the products of the nitrate cycle, whether from natural or anthropomorphic sources. In the natural nitrate cycle, nitrogen leached and fixed by soil bacteria undergoes ammonification, forming ammonia, which is converted into nitrites and then further oxidized to nitrates. Similarly, anthropomorphic sources undergo ammonification and are sequentially converted to nitrites and nitrates [62].
The phosphate content of the spring water sources investigated was between 0.679 and 1.111 mg/L (Table 2). The phosphate content of the investigated spring water sources (Table 2) is below the Turkish standards [22], which allow 1.5 mg/L. Statistical comparison of the means of seven measurements (p<0.05) from each freshwater spring (Table 2) showed that all spring water sources were similar in terms of phosphate content, except for Station 8 (Fig. 1 and Table 1). Station 8 is located in close proximity to the Mazgirt settlement (1 km), indicating intense agricultural activity and uncontrolled disposal of animal husbandry wastes. Differences in weekly basis analysis from eight locations showed that agricultural and animal husbandry levels influence phosphate content to a great extent (Table 3).
The chloride content of the spring water sources investigated was between 0.9997 and 10.996 mg/L (Table 2). The chloride content of the investigated spring water sources (Table 2) is well below the Turkish and EC standards [22] that allow 250 mg/L. Statistical comparison of the means of seven measurements (p<0.05) from each freshwater spring (Table 2) showed that all spring water sources except for Station 8 were similar in terms of chloride content. Weekly basis analysis from eight locations showed that there were no significant differences (p<0.05) in terms of chloride content over the period of observation (Table 3).
The iron content of the investigated spring water sources was below the detection level. This shows that the geomorphologic structure surrounding the water basins in the region does not contain ferritic structures [56, 64].
Total mesophilic bacteria count (TMBC) and coliform count were chosen for microbiological analysis because TMBC includes all heterotrophs, including aerobic and facultative anaerobic pathogens, while coliforms refer to fecal contamination. TMBC of the spring water sources investigated was between 3×101 and 4.8×10² colonies/mL (Table 2). Statistical comparison of the means of seven measurements (p<0.05) from each freshwater spring (Table 2) showed that all spring water sources were similar in terms of TMBC. Weekly basis analysis from eight locations showed that there were no significant differences (p<0.05) in terms of TMBC over the period of observation (Table 3). Fecal contamination in drinking water is a primary concern in terms of health because it might cause various diseases and pose a risk to public health [65-68]. Coliforms were encountered in only three samples among 56 (Table 2); 94.65% were free from coliforms. Statistical comparison of the means of seven measurements (p<0.05) from each freshwater spring (Table 2) showed that all spring water sources were similar in terms of coliform counts. Weekly basis analysis from eight locations showed that there were no significant differences (p<0.05) in terms of coliforms over the period of observation (Table 3).
Fig. 2.
Correlations between quality parameters relationship between total hardness and electric conductivity.
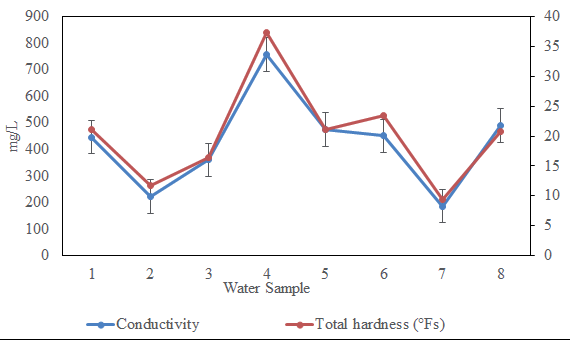
Fig. 3.
Correlations between quality parameters relationship between total hardness and calcium content.
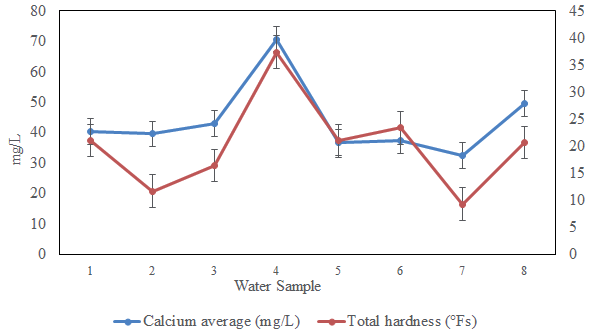
Fig. 4.
Correlations between quality parameters relationship between total hardness and magnesium content.
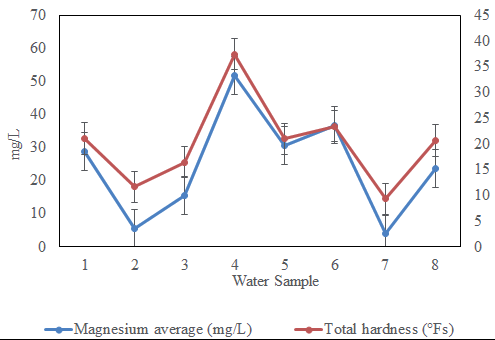
Fig. 5.
Correlations between quality parameters relationship between total hardness and sulfate content.
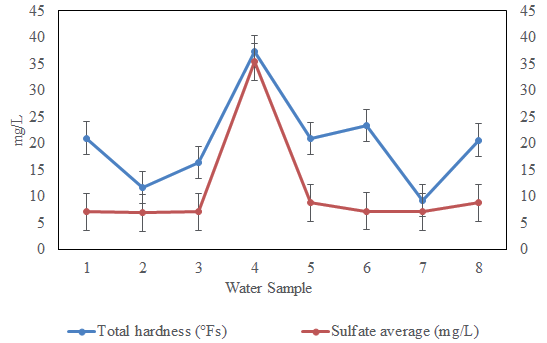
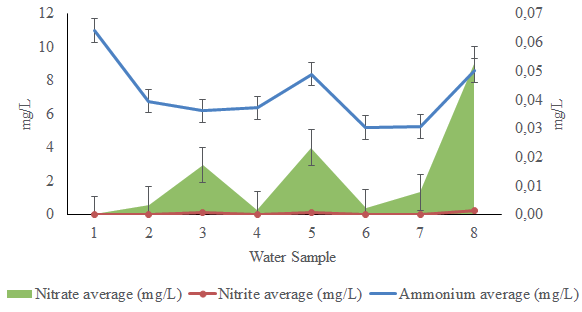
Table 2.
Comparison of spring water sources with respect to quality parameters.
Table 3.
Variation of the means of quality parameters from eight locations on a weekly basis.
Conclusions
The current study has been conducted to evaluate the quality of some spring water based on several physicochemical parameters in the Tunceli area in Turkey. The physical and chemical properties of the spring water sources were found to conform to the available Turkish (TSE-266), EC, and WHO standards. Microbiological properties were within the range dictated in the literature. The quality of the spring water sources is acceptable for domestic purposes and potable water. Low levels of ammonium, nitrate, nitrate phosphate, and sulfate are due to animal husbandry and agricultural activity, which needs to be better controlled.

