

Introduction
Water is an indispensable natural resource for the survival of all living organisms. Its quality can directly and/or indirectly affect the ecological environment and even cause disease in human beings. In general, the water bodies on the earth can be mainly divided into groundwater, surface water, and oceans, respectively. Wherein surface water includes swamps, lakes, rivers, reservoirs, glaciers, etc. Among these surface water bodies, only the reservoir is an artificial construction project, and the others are all natural water bodies.
The goals of the reservoir construction were to:
(1) Control the flood. Along with the continuous rainfall, the rise of upstream water volume over the allowable range of the watercourse will enhance the occurrence of floods. The reservoirs can reduce the frequency of floods. So, it plays an important role in weakening the flood flow downstream and reducing the loss caused by the flood [1]; (2) Retain the water. Utilizing the terrain advantages, viz., the reservoir is surrounded by mountains on three sides, the dam formed by soil or concrete can block the flow of rainfall and surface water along the slop of the mountains, resulting in the water converge in the low-lying terrain of the reservoir;
(3) Power generation. During reservoir drainage, the height difference generated from upstream and downstream can transform the gravitational potential energy of the flowing water into kinetic energy and finally electrical energy [2]; (4) Develop aquaculture. Due to the abundant nutrition and the enclosed topographic conditions, the reservoirs are suitable for aquaculture. (5) Manage the surface water resource. In order to satisfy water-use sectors’ demand, the reservoir water can be used as the surface water resource for drinking and irrigation [3]. However, the utilization of reservoirs can also have some unfavorable influences, including: (1) Increasing the frequency of disasters. Accompanied by the rainfall, soaking the rock mass of the reservoirs in mountainous areas for a long time will lead to landslides and debris flows; (2) Retaining water in reservoirs will induce the occurrence of earthquakes;
(3) Emerging the soil salinization. Overusing the reservoir water for irrigation can lead to soil salinization.
Plenty of researchers and scholars have invested lots of time and efforts in studying the heavy metals in different water bodies. Especially in recent years, with the development of industrialization, agriculture, building, etc., heavy metal pollution in reservoirs has occurred frequently [4-6]. To study these water bodies, researchers have mainly focused on the hydrogeochemistry and environmental geochemistry, including conventional ions (K+, Na+, Ca2+, Mg2+, CO32-, HCO3-, Cl-, and SO42- ), isotopes (2H and 18O), and heavy metals (Mn, Zn, Co, As, Cd, Cu, Cr, and Ni, etc). The characteristics of the conventional ions were mainly analyzed by using the Piper diagram, Gibbs diagram, and mathematical statistics. Contrasting the global meteoric water line (GMWL) and the regional meteoric water line, the study of isotopic tracer technique can be conducted for mastering the origin of different water bodies. For heavy metals research, the research methods of heavy metal risk assessment include the heavy metal pollution index (HPI), heavy metal assessment index (HEI), the potential ecological risk index method, the single-factor pollution index method, and Nemerow index method, etc. [7-12]. The health risk assessment model (AHP model) recommended by the United States Environmental Protection Agency (USEPA) can be employed to evaluate the human health risks of adults and children [13]. Meanwhile, Principal Component Analysis (PCA), Positive Matrix Factorization (PMF), Weighted Alternating Least Squares (MCR-WALS), correlation analysis, cluster analysis, and Unmix analysis can be applied to identify the sources of heavy metals [14, 15].
In this study region, research on hydrochemistry and environmental geochemistry has been reported, involving rivers, lakes, subsidence pools, and groundwater. However, the hydrochemical and environmental geochemistry research about the reservoirs is relatively deficient. So, in light of the above research status, this study focuses on 14 surface water samples collected from 7 reservoirs, and the objectives of this study are as follows: 1) to depict the content characteristics of the heavy metals, including Mn, Zn, As, Ni, Cr, Cu, Co, and Cd; 2) to evaluate the pollution levels by using the single-factor pollution index method, the Nemerow comprehensive pollution index; 3) to appraise the human health risks of adults and children through the health risk assessment model (AHP model); and 4) to identify the source of the heavy metals by using the correlation analysis and the principal component analysis.
Materials and Methods
Research Area
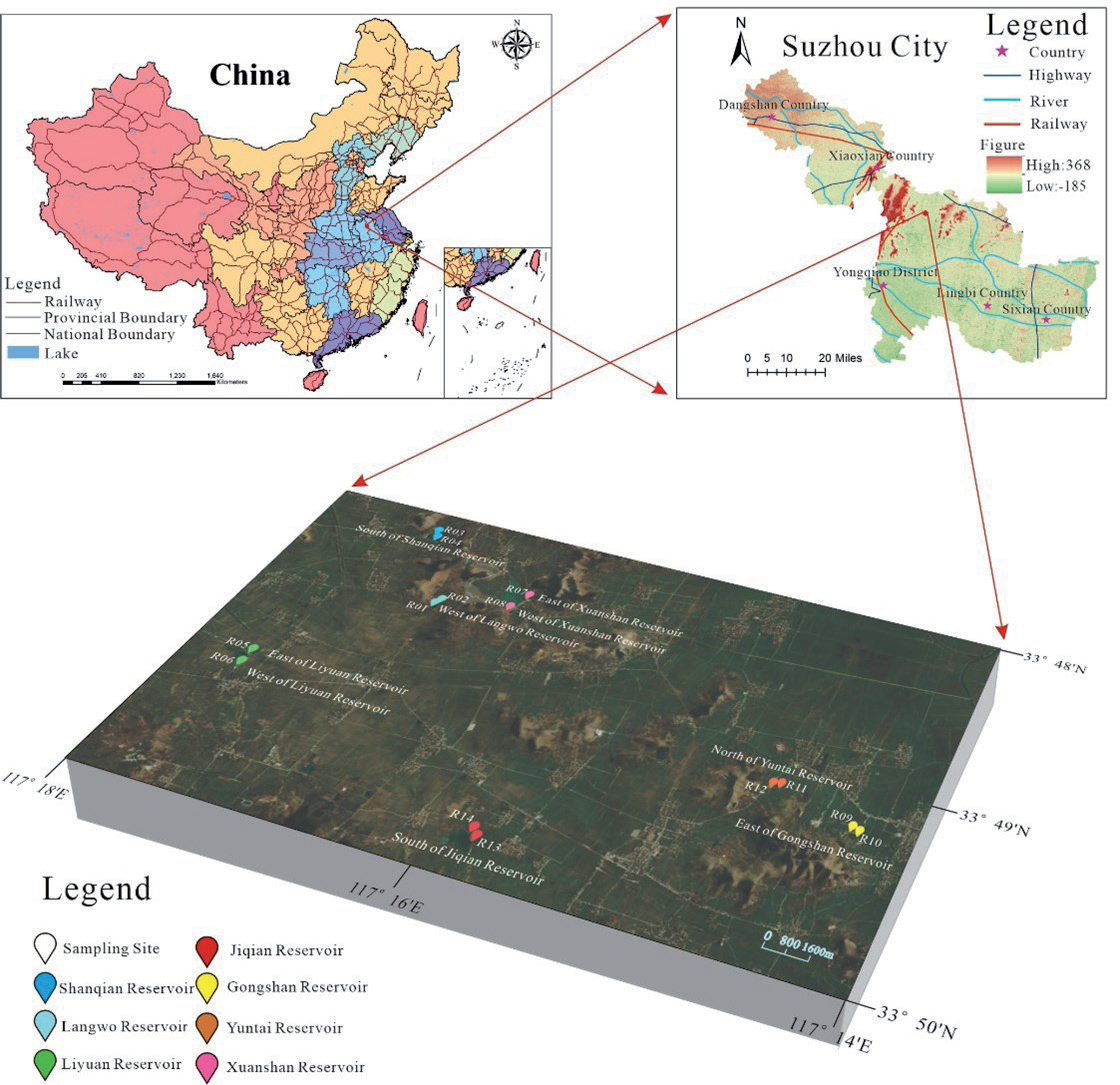
The study region is located in Langan-xieji town, Yongqiao District, Suzhou City, Northern Anhui Province (Fig. 1). It is between 116 °09’-118 °10’E and 33°18’-34°38’N, with a total area of 9787 square kilometers. Suzhou City is composed of Yongqiao District, Dangshan County, Xiaoxian County, Lingbi County, and Sixian County. The Langan-Xieji area is situated in the north of Yongqiao District. The local climate belongs to a semi-humid climate, with an annual average temperature of 15.7ºC. The average annual rainfall is 1000 mm, and the precipitation is concentrated between June and August. Most of the landforms in the study area are plains, and there are mountainous areas to a certain extent. The outcrop of the rock is almost scattered in hills, and the lithology is mainly shale, sandstone, and quartzite. The minerals proved by exploitation contain marble, coal, and coalbed methane, and so on. The study region is located in the Xu-su Arc Nappe belt, and the Subei Fault is the controlling fault in this area, which divides this region into two districts from north to south. From the old to the new, the loose lays revealeddisclosing by numerous drillings contain Ordovician, Carboniferous, Permian, Paleogene, Neogene, and Quaternary, respectively.
Sample Collection and Testing
Seven reservoirs were selected as the object of this research. In each reservoir, two samples were collected on both sides, and the sampling sites can be seen in Fig. 1. Before sample collection, polyethylene bottles were rinsed three times with the prepared sampling water. And then these collected samples will be saved and sent to the Key Laboratory of Mine Water Resource Utilization of Anhui Higher Education Institutes, Suzhou City, China for further processing. In the laboratory, the samples were filtered by applying 0.22 μm filter membrane. In order to guarantee the stability and measurement precision of the heavy metals, 97 g of sampling water, 2 g concentrated nitric acid, and 1 g internal standard were prepared to measure the contents of the eight heavy metals, containing Mn, Zn, As, Ni, Cr, Cu, Co, and Cd. The concentrations of the heavy metals were analyzed by ICP/MS, Thermo Fisher Element Ⅱ. The standard curve is prepared using standard substances provided by the National Standards Center, which was diluted to 0 ng/L, 10 ng/L, 100 ng/L, 500 ng/L, 1000 ng/L, and 5000 ng/L, respectively. In order to improve the accuracy of the data, 1 blank sample and 3 parallel samples were also set, and the error was controlled within 10%.
Analysis Methods
The Single-Factor Pollution Index
The single-factor pollution index method can be used for water quality evaluation. It compares the tested value of a single factor with water quality standard, and selects the worst calculated value as the result of every heavy metal [16].
Pi is the pollution index of the i-th heavy metal, and Ci is the tested concentration of the i-th heavy metal element in the collected water sample, and its unit is ug/L, and C0 is the water quality standard referenced by the Environmental Quality Standards for Surface Water, China (GB3838-2002) of the i-th heavy metal element, and its unit is ug/L.
The evaluation classification is graded as follows: no pollution, when Pi<1; light pollution, when 1≤Pi<2; moderate pollution, when 2≤Pi<3; and severe pollution, when 3≤Pi.
The Nemerow Composite Pollution Index
The Nemerow composite pollution index can be employed to appraise heavy metal pollution, and the maximum and average values of the single-factor pollution index are simultaneously applied for the calculation of the Nemerow composite pollution index [16].
PI is the Nemerow composite pollution index, Pimax is the maximum value of the single factor pollution index, and Pa is the average value of the single factor pollution index.
The evaluation categorization is graded as follows: when PI<0.6, there is no pollution; when 0.6≤PI<2.2, it is slight pollution; when 2.2≤PI<8, it is heavy pollution; when PI≥8, it is heavily polluted.
The Health Risk Assessment (AHP Model)
When the human body acquires the heavy metal elements through drinking water and/or skin infiltration, it will bring more than 90% of the pollutants to the human body, and the health risk assessment model (AHP model) recommended by USEPA is always used to evaluate the health risk of adults (male and female) and children exposed to heavy metal pollution. So, in this study area, the heavy metal elements in the reservoirs can be divided into two categories; one is a chemically carcinogenic heavy metal element, containing As, Cd, and Cr, and the other category is a chemically non-carcinogenic heavy metal element, concluding Mn, Co, Cu, Ni, and Zn. The calculation methods of the two pathways are different, and the calculation procedures are as follows [17]: Firstly, for the drinking water pathway:
Rci is the annual carcinogenic risk caused by drinking water, the calculation formula is as follows:
Rni is the annual non-carcinogenic risk caused by drinking water, the calculation formula is as follow:
ADDi is the average daily exposure dose per unit body weight produced by drinking water. The formula is as follow:
Secondly, for the skin infiltration pathway:
The health risk assessment of dermal contact was calculated based on the calculation model proposed by Strenge et al. [18].
Formula (6) can be used for calculating the annual carcinogenic risk through the skin penetration pathway Rpd:
The risk of chemical non-carcinogens to human health through dermal contact was calculated according to formula 7:
ADDd is the average daily exposure dose per unit weight of heavy metal d under the shower water dermal contact route, and its unit is mg/(kg*d), which can be formulated as formula 8:
Id is the amount of heavy metal element d adsorbed through the skin during one shower event per unit area of skin contact, and its unit is mg/(cm2*times), which can be determined according to formula 9:
The relevant parameter values of the above formulas are detailed in Table 1 [19-22].
The non-carcinogenic reference dose and carcinogenic intensity coefficient are listed in Table 2 [23, 24].
The AHP model quantitatively describes the health risks caused by various environmental pollutants to the human body by establishing the relationship between the human body and environmental pollutants. Table 3 shows the maximum acceptable risk level and negligible risk level recommended by relevant research institutions [25].
According to Table 3, it can be concluded that the maximum acceptable risk level of some institutions is between 1x10⁻⁶ and 1x10⁻⁴.
Principal Component Analysis
Principal component analysis is a commonly used multivariate statistical method for assessing river water quality. In a set of data, the principal component analysis can ensure the completeness of the main information and avoid the repetition of variables. Under this premise, it can explain the reasons for the change of variables. Most researchers use linear transformations to convert multiple pollution sources into several major pollution sources, and the reasons for the final impact can be confirmed by analyzing the high proportion of metal elements in several major pollution sources [26-28]. institutions.
Table 1.
The practical significance, reference values, and units of each symbol in the formula.
Correlation Analysis
Correlation analysis is a statistical method that uses mathematical thinking. The relationship between phenomena and variables can be obtained by quantitatively processing multiple related variables. Correlation analysis is generally used to analyze the correlation between heavy metal elements. The data with * in the table always indicates that there is a significant correlation between the two heavy metal elements. If the data in the table is positive in value, it indicates a positive correlation between heavy metal elements, and if the data is negative in value, it indicates a negative correlation. Usually, only the data in the range of 0.6~1 will be used as the basis for analyzing the relationship between heavy metals [29].
Results and Discussion
Descriptive Statistics
A total of 14 samples from 7 reservoirs have been collected in Langan-Xieji town, Northern Anhui Province. All of the analytical results are synthesized in Table 4. As can be seen from Table 4, the mean concentration order of reservoirs’ water samples was as follows: Mn (25.48 ug/L)>Zn (3.55 ug/L)>As (2.34 ug/L)>Ni (1.43 ug/L)>Cr (1.23 ug/L)>Cu (0.68 ug/L)>Co (0.34 ug/L)>Cd (0.0079 ug/L). Meanwhile, with reference to environmental quality standards for surface water (GB3838-2002) [30], the concentrations of most samples were within the background value of the standards. Among these samples, only one‘s Mn exceeded the standard limit, which indicated that the water quality of these reservoirs’ samples was in good condition.
Table 3.
The maximum acceptable risk level and negligible risk level recommended by some relevant research institutions.
Table 4.
Statistics of heavy metals concentration (ug/L) for reservoirs’ samples.
The coefficient of variation (CV) can reflect the contribution degree of anthropogenic activities [31, 32]. The greater the coefficient of variation, the higher the anthropogenic activities. In this study, the coefficients of variation of Cr (2.45) and Mn (1.71) were larger than 0.9, indicating the high degree of anthropogenic activities. The remaining heavy metals of Co, Zn, Cu, As, Cd, and Ni were between 0.1 and 0.9, indicating that the source of these heavy metals was relatively stable.
Pollution Assessment
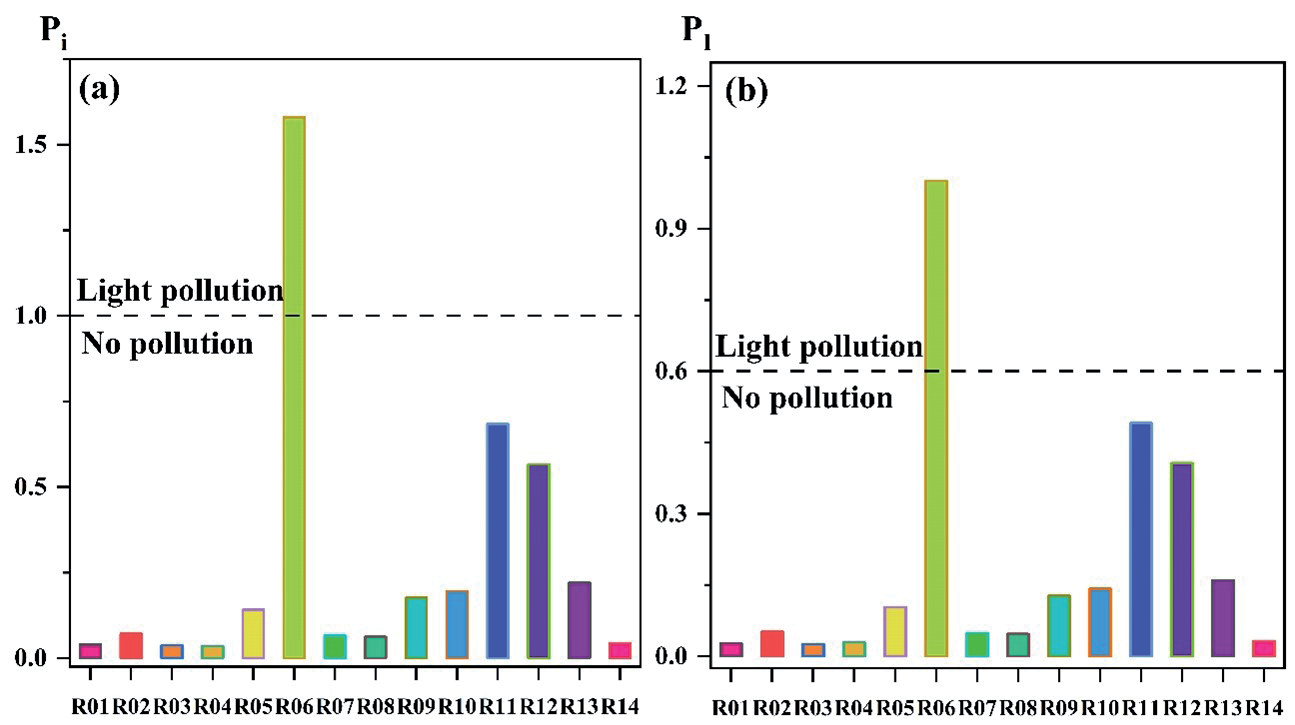
First of all, this study conducted the single factor pollution index to assess the water quality of 14 samples from 7 reservoirs. As can be seen from Fig. 2a), the single factor pollution results of 13 samples were within the cleaning standard, however, only one sample collected from sampling site R06 was slightly polluted.
Since the single-factor pollution index method can only select one evaluation index to analyze the pollution degree, it cannot reflect the comprehensive water quality of the reservoirs, so Nemerow’s pollution index (PI) was proposed for evaluating heavy metal pollution. As shown in Fig. 2b), the range of the Nemerow comprehensive pollution index in the study area was between 0.01 and 1.13. The descending order of the PI values was: R06 (1.128)> R01 (0.491)> R12 (0.406)> R13 (0.160)> R10 (0.142)> R09 (0.128)> R05 (0.103)> R02 (0.052)> R07 (0.049)> R08 (0.047)> R14 (0.032)> R01 (0.030)> R03 (0.028)> R04 (0.026). The PI value of sampling site R06 was between 0.6 and 2.2, which implied that the water quality of this sample was slightly polluted, and the remaining 13 sampling points were free-pollution. So, combined with the in-situ investigation, the slight pollution of sampling site R06 may be related to the utilization of chemical fertilizer and pesticides [33].
Health Risk Assessment
The calculation results of health risk values for drinking water infiltration were listed in Table 5, and the risk levels published by relevant institutions were summarized in Table 3. It can be concluded that the average annual health risk values of five non-carcinogenic heavy metal elements containing Ni, Mn, Co, Cu, and Zn were lower than the negligible risk level issued by related institutions, with a difference of 2-4 orders of magnitude. Thus, the risk values can be ignored. Among the three carcinogenic elements, viz., Cd, As, and Cr, the health risk values of Cd were far lower than the negligible risk value of 1x10⁻⁸, there is no risk of cancer. However, As and Cr elements were lower than the maximum acceptable risk level issued by USEPA, but higher than the maximum acceptable risk level issued by related organizations. Even more, some points of the Cr element were greater than 1x10⁻⁴, which can cause a certain carcinogenic risk. So, before using the water from these reservoirs, the surface water needed to be treated for As and Cr.
Meanwhile, the calculation results through the skin contact infiltration pathway using the AHP model are summarized in Table 6. It can be known that the annual average health risks caused by five non-carcinogenic heavy metal elements containing Ni, Mn, Co, Cu, and Zn were less than 1x10⁻⁸, which can be ignored. In terms of carcinogenic risk, the health risks caused by heavy metals As and Cr under the skin contact route were higher than Cd. The average annual health risk value effected by Cd was lower than the maximum acceptable risk level of 1x10⁻⁶ proclaimed by related organizations.
It was worth noting that the risk values of Cr were greater than 1x10⁻⁴ in some sampling sites, indicating there was a risk of cancer. Although the health risk caused by As through dermal contact was all less than 1x10⁻⁴, some points were greater than 1x10⁻⁶, so it also needed attention.
From the above research results, it can be seen that the health risk value of the Cr element at some points exceeded the maximum acceptable risk level. It may be related to human factors, such as the automobile exhaust emissions around the study area. According to the contents of the eight heavy metals, it can be known that the descending order of the health risks is as follows: As>Cr>Cd>Mn>Cu>Zn>Co>Ni. The health risks induced by the skin contact of each element were greater than the drinking water infiltration. In the study area, the average annual health risk value of children caused by heavy metal elements was greater than that of adults (Fig. 3). Compared with adults, children faced a higher risk of cancer, which may be related to incomplete development of organs and body systems, low immunity, and sensitivity to heavy metal elements [34]. Therefore, it is necessary to strictly control children‘s drinking water and contact environments.
Correlation Analysis
As shown in Table 7, the correlation coefficients between Mn-Co, Co-Ni, As-Cd and Cr-Ni were 0.792,0.589,0.658 and 0.852, respectively, implying that there was a significant positive correlation between them, which could be considered to have the same source. The correlation ratio between other elements is less than 0.3, and the correlation between them was weak, suggesting that they may come from different pollution sources.
Table 5.
Annual average health risk caused by heavy metals through drinking water infiltration.
Table 6.
Annual average health risk caused by heavy metals through skin contact infiltration.
Principal Component Analysis
As can be seen from Table 8, three possible sources were achieved after rotation, and the cumulative contribution rates of the three principal components were 84.12%, and the contribution rates of the three principal components were 30.07%, 27.15%, and 26.90%, respectively. The first component showed that the closely related elements contained As (0.74) and Cd (0.95), which implied that the first principal component may be related to the discharge of domestic wastewater from surrounding residential areas [35, 36]. The contribution rate of the second principal component was 27.15%; the main related elements included Zn (0.66), Cr (0.95), and Ni (0.84), which illustrated that the pollution source may be automobile exhaust emissions [37, 38]. The contribution rate of the third principal component was 26.90%, the main related elements were Mn and Co, and the weight coefficients were 0.90 and 0.90, respectively. The third principal component may represent the use of pesticides and fertilizers [33, 39].
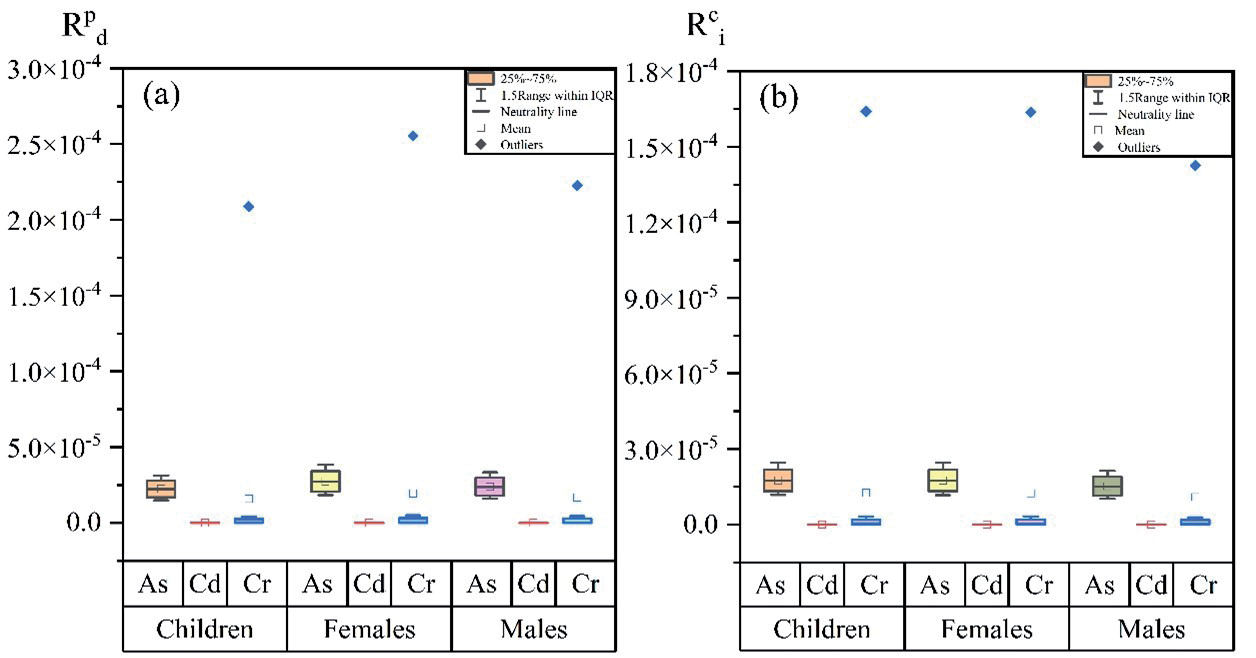
Table 7.
Correlation analysis of heavy metals.
Table 8.
Principal component analysis of heavy metals.
Conclusions
The present study analyzes the pollution status, the health risk, and the source of the eight heavy metals, viz., Mn, Zn, As, Ni, Cr, Cu, Co, and Cd. The following findings have been obtained: The mean concentration order of reservoir water samples is as follows: Mn (25.48 ug/L)>Zn (3.55 ug/L)>As (2.34 ug/L)> Ni (1.43 ug/L)>Cr (1.23 ug/L)>Cu (0.68 ug/L)> Co (0.34 ug/L)>Cd (0.0079 ug/L). The coefficients of variation of Cr (2.45) and Mn (1.71) were larger than 0.9, indicating the high degree of anthropogenic activities, and the remaining heavy metals of Co, Zn, Cu, As, Cd, and Ni were between 0.1 and 0.9, which implied that the source of these heavy metals was relatively stable. The single factor pollution index and Nemerow’s pollution index consistently showed that only sampling site R06 was slightly polluted, and the remaining 13 sampling points were free-pollution. The results of the health risk assessment showed that the annual average health risk value of chemical carcinogens was far greater than that of chemical non-carcinogens. Children were more sensitive to heavy metal elements. Therefore, it was necessary to strictly control children’s drinking water safety and contact environment. Meanwhile, there was a carcinogenic risk of Cr at some sampling sites. The correlation analysis and principal component analysis indicated that three principal components may be related to the discharge of domestic wastewater, automobile exhaust emissions, and pesticides and fertilizers, respectively.

