

Introduction
Groundwater is one of the most important water resources for nature and human societies [1-5] and is facing a serious challenge of deterioration in quality due to the impacts of climate change and human activities [6-8]. Groundwater quality evaluation, as an effective means of water body pollution assessment, can quantitatively and qualitatively assess the pollution status of groundwater bodies and is also an important basic task for groundwater environmental risk analysis, pollution source determination, and water resource protection [9]. For the evaluation of groundwater quality, scholars at home and abroad have explored various methods: Liang et al. [10] established a fuzzy comprehensive evaluation model of groundwater quality based on Geographic Information System (GIS) technology by combining GIS technology with the improved fuzzy comprehensive evaluation model; Li et al. [11] evaluated the quality of deeply buried groundwater in Kaifeng City using genetic algorithm– BP neural network method; Egbueri et al. [12] used groundwater pollution index (PIG), ecological risk index (ERI), and hierarchical clustering algorithm to evaluate groundwater quality in the study area; Su et al. [13] used a set-pair analysis (SPA)-Markov chain model to evaluate groundwater quality in Xi'an city.
Although the above studies have explored the groundwater quality evaluation methods from different perspectives and achieved many useful results, there are some limitations: the evaluation results of the fuzzy mathematical method are more in line with the actual situation, but the determination of the relevant parameters such as weights and affiliation degrees mainly depends on the subjective experience of the human being [14]; the evaluation results of the evaluation methods, such as neural networks, are not intuitive enough and the construction of the model and the calculation process are relatively complicated [15]. In recent years, with the development of machine learning models, the Random Forest method has been widely used due to its simple operation, high prediction accuracy, and ability to identify the importance of evaluation indicators [16, 17]. In the field of hydrogeology, [18] used the Random Forest method to analyze the change in groundwater burial depth and its causes in the middle reaches of the Heihe River; Band et al. [19] compared the performance of 4 artificial intelligence models in simulating nitrate concentration of groundwater: cubic regression, support vector machine, Random Forest, and Bayesian artificial neural network; and Zhang Ying et al. used the Random Forest classification method to evaluate the water quality of Chaohu Lake [20].
Currently, studies based on the Random Forest method and evaluating health risks in human beings, although there are some results, are still relatively few, especially in this study area. Chu et al. [21] conducted a health risk assessment and groundwater quality classification of arsenic in the Salt Lake area based on Random Forest and found that 33% of the groundwater samples had HQ values >1, and all groundwater had CR values >1.00×10⁻⁶ for children. which implies a serious health risk. 21% of groundwater samples had a health risk for adults. Muhammad et al. [22] and Sultana et al. [23] evaluated the health risk of arsenic (As) in Pakistan and found that more than 85% of drinking water had Hazard Quotient (HQ) values >1, indicating a significant health risk. In the semi-arid region of northwestern China, Li et al. [24] revealed the impact of groundwater contaminants on human health, stating that women and children face higher non-carcinogenic risks than men due to industrial and agricultural activities. In addition, other scholars have conducted health risk assessments of drinking water to check the adverse effects of groundwater contaminants on human health in certain areas.
Therefore, this study adopts the Random Forest method combined with health risk assessment to conduct a systematic study of shallow groundwater in Luannan County. The core objective of the study is to accurately identify the most influential indicators on groundwater quality in Luannan County from the 9 selected indicators using the Random Forest algorithm. Based on this, the health risk assessment methodology was further applied to scientifically and systematically assess the health risks of the screened key indicators. Through this innovative research methodology, the study aims to provide scientific evidence and technical support for the management and protection of groundwater quality in Luannan County.
Materials and Methods
Study Area
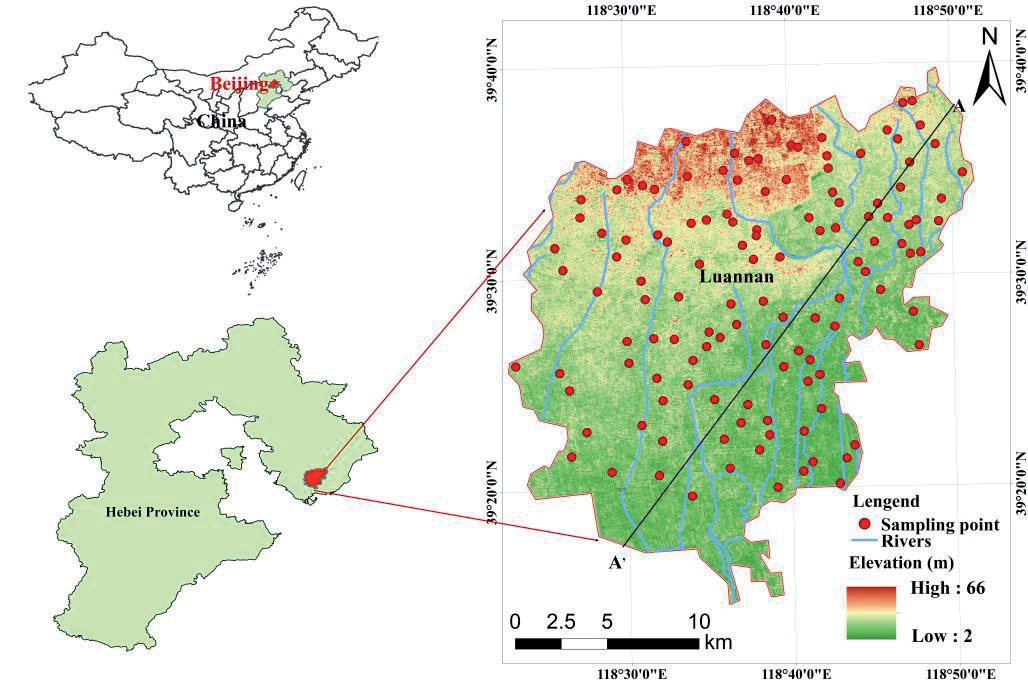
Luannan County is located in the eastern part of Hebei Province, on the Jidong Plain, and covers a total land area of 117,000 km2 (see Fig. 1). The Quaternary loose accumulations in Luannan County are vertically divided into four aquifer groups, from top to bottom [25]. The Ⅰ and Ⅱ aquifer groups are subsurface water-bearing strata, located in the surface and shallow zones. They receive recharge from atmospheric precipitation and discharge through evaporation. Water circulation in this zone is active, making it a vertically strong circulation alternation zone. The Ⅲ and Ⅳ aquifer groups are deep water-bearing strata characterized by pressurized conditions, limited runoff, and weak circulation [26].
Vertically, each aquifer group is separated by layers of powdery clay or clay thicker than 5 m, with no obvious hydraulic connection. However, macro-scale analysis shows that between the Ⅰ and Ⅱ aquifer groups, as well as the Ⅱ and Ⅲ groups, particularly across the freshwater zones, mixed use of aquifers and varying extraction well depths have led to long-term interconnection due to exploitation, resulting in different degrees of hydraulic connectivity [27].
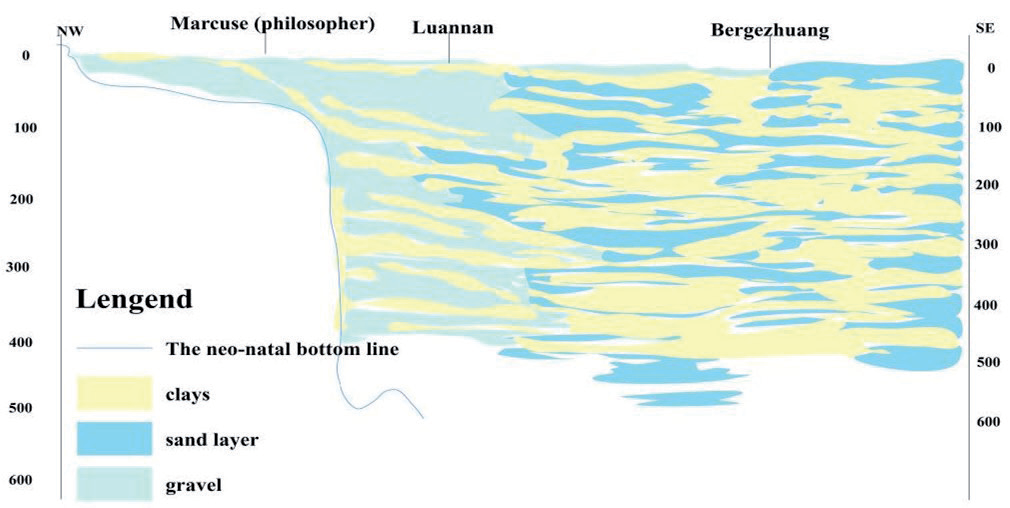
The lithology of each aquifer group is dominated by gravel pebbles and sand-bearing gravel pebbles (see Fig. 2), and their distribution ranges from old to new, with a tendency to decrease gradually. The thickness of a single layer of aquifer is 15-20 m, and the maximum thickness is more than 40 m [28].
Groundwater Sample Collection and Analysis
In this study, a total of 134 shallow groundwater samples were collected from 2015 to 2023, and a total of nine indicators, pH, total dissolved solids (TDS), total hardness (TH), SO42-, NO₃-, F-, CI-, chemical oxygen demand (COD), and Mn2+, which mainly affect the local water quality, were selected as evaluation factors. The specific distribution is shown in Fig. 1. Groundwater samples were collected in accordance with the Technical Specification for Groundwater Environmental Monitoring (HJ164-2020), and the determination was carried out by the Experimental Centre for Water Environment Monitoring of Hebei Province.
Inductively coupled plasma mass spectrometry for the determination of 65 elements in water quality (HJ700-2014) was used to determine the concentration of dissolved divalent manganese (Mn²⁺) in the samples, and ion chromatography for the determination of inorganic anions in water quality (F⁻, Cl⁻, NO₂⁻, Br⁻, NO₃⁻, PO₄³⁻, SO₃²⁻, SO₄²⁻) (HJ84-2016) was used for the determination of SO₄²⁻, NO₃⁻, F⁻, and Cl⁻ content in groundwater; TH was determined by EDTA titration, TDS by gravimetric method, and pH by glass electrode method.
Random Forest Approach
Random Forest Modelling
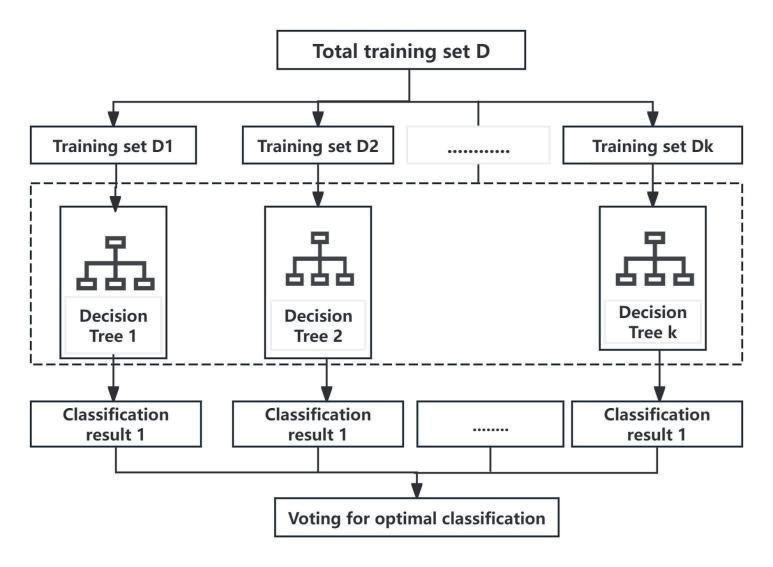
The Random Forest algorithm consists of a series of decision tree single learners, which individually vote on the input samples and judge their classification; the results of each single learner are then pooled to arrive at the final result of the Random Forest [29]. The flow of the Random Forest algorithm is shown in Fig. 3.
The training samples directly determine the accuracy of the Random Forest algorithm for groundwater quality evaluation. This study used the EWQI evaluation method to generate training samples. The 134 groups of water quality samples in the study area were classified into groundwater quality classes using the EWQI evaluation method. The entropy-weighted water quality index (EWQI) is a method proposed by [30] for the comprehensive evaluation of groundwater quality. The calculation process of the entropy weight method is similar to other comprehensive index methods, and the calculation steps are as follows:
(1) Step 1: Establish the initial matrix. Assume that there are m (i=1, 2, ... , m) water samples, each water sample contains n (j=1, 2, ... , n) water quality parameters, then the initial matrix X is as follows:
(2) Step 2: Normalize the initial matrix. The matrix X is standardized to eliminate the effect of dimensionality through Equation (2), where minj(xij) and maxj(xij) are the minimum and maximum values of the j th indicator in the matrix X, respectively. yij is the normalized value. Then, the standardized assessment matrix is written as Y = (yij)(m×n)
(3) Step 3: Calculate the information entropy of each indicator by Equation (4). The ratio of the value of the j-th indicator in the i-th sample is represented by Equation (3) and 10‒4 is a correction parameter used to make sense of the Equation when yij is zero.
(4) Step 4: According to Equation (5), the entropy weight (wj) can be calculated:
(5) Step 5: The EWQI value for each sample is calculated by Equations (6) and (7).
where qj is the concentration ratio of indicator j in each sample, Cj is the measured concentration (mg/L) in each sample, and Sj is the standard limit value of Class III water according to the Chinese groundwater quality standard in mg/L [31].
The accuracy and stability of the Random Forest water quality classification model were examined by randomly selecting 70% (93 groups) of the 134 sets of water quality samples as the training dataset and the remaining 30% (40 groups) as the test dataset. During the model training process, nine water quality evaluation factors, pH, TDS, TH, SO₄²⁻, NO₃⁻, F⁻, Cl⁻, COD, and Mn2+, were used as independent variables, and the EWQI water quality evaluation classification results were used as dependent variables. By continuously adjusting and optimizing the model parameters, the simulated values of water quality classification of the model and the classification results of EWQI water quality evaluation were matched as much as possible to complete the training and optimization of the Random Forest classification model.
Hyperparametric Optimization of Random Forest Models
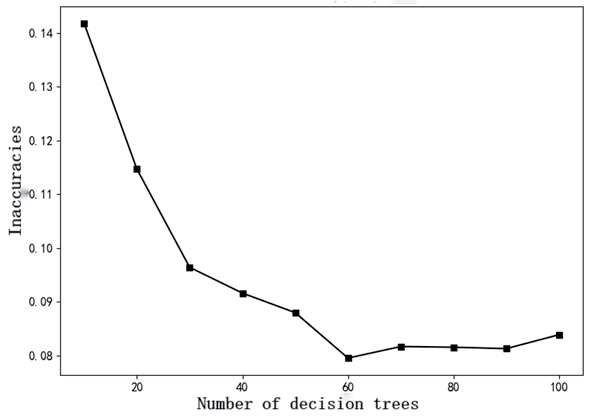
In order to prevent the random selection of hyperparameters and overfitting in the decision tree construction process of the Random Forest model, this study first uses the lattice search algorithm in the sklearn machine learning library to optimize the parameters of relevant hyperparameters (the number of decision trees, the maximum depth of the decision tree, and the maximum number of features, etc.) of the model as a means to improve the classification accuracy and efficiency of the Random Forest model. The lattice search algorithm is a model hyperparameter optimization technique that optimizes model performance by traversing a given combination of parameters. The number of decision trees in the Random Forest algorithm is usually the more the better, but if the number of decision trees is too large, it will bring a larger computational burden, and the computation time will increase accordingly; at the same time, when the number of decision trees reaches a critical value, further increasing the number of trees will not significantly improve the model’s classification performance. The optimization result of the grid search algorithm for the number of decision trees is shown in Fig. 4.
Random Forest Classification Indicator Importance Assessment
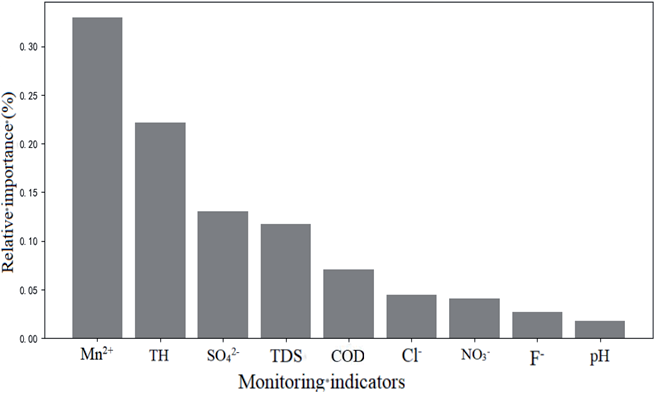
The groundwater quality evaluation can identify the groundwater pollution status in the study area, but it cannot reveal the relative importance between different evaluation indicators. One obvious advantage of the Random Forest model is that the importance of each indicator to the water quality classification results can be assessed by the Gini index, and the larger the Gini index, the higher the relative importance of the evaluation indicators. The relative importance of the evaluation indicators of groundwater quality in the study area is shown in Fig. 5.
Health Risk Assessment
Health risk assessment helps to clarify priorities for pollution control and integrated groundwater quality assessment [32]. According to the International Agency for Research on Cancer (IARC), Mn2+ is a non-carcinogenic pollutant. Therefore, this paper used the model recommended by the Ministry of Environmental Protection of the People's Republic of China (2014) to estimate the non-carcinogenic health risk caused by Mn2+ [33]. Drinking and dermal contact are two common modes of exposure to contaminated water affecting people's health [34], and the non-carcinogenic risk calculations through drinking and dermal exposure were calculated by the following equations [35, 36]. In the present study, the non-carcinogenic risk through alcohol consumption (oral route) and dermal intake was estimated with the following formula [37-39]. The meaning of each parameter is presented in Table 1.
The hazard quotient (HQ) of the non-carcinogenic risk of Mn2+ through consumption (HQoral) and dermal contact (HQdermal) can be expressed as at least one of the Equations (11) and (12). See Table 1 for parameter values.
The total non-carcinogenic risk in this study was quantified by the hazard index (HI), which can be calculated by Equation (13). HQ and HI values less than 1 indicate acceptable non-carcinogenic risk, and vice versa when HQ and HI are greater than 1.
Results and Discussion
Web Search Optimization
It can be seen from Fig. 4 that with the increase in the number of decision trees, the error decreases. When the number of decision trees reaches 60, the error stabilizes, and this point also corresponds to the lowest error.
The other hyperparameters are further optimized using the grid search algorithm, and the optimization results are shown in Table 2.
Relative Importance
The relative importance of groundwater quality evaluation indicators in the study area is shown in Fig. 5. From Fig. 5, it can be seen that the order of importance of groundwater quality evaluation indicators in the study area is Mn²⁺ > TH > SO₄²⁻ > TDS > COD > Cl⁻ > NO₃⁻ > F⁻ > pH. Among these indicators, the importance of Mn²⁺ and TH is more prominent, and both of them have Gini indexes exceeding 20%, which makes them the main controlling factors for groundwater quality in the study area. The Gini indexes of NO₃⁻, F⁻, and pH were less than 5%, indicating that they were of low importance, while the Gini index of Mn²⁺ was more than 30%, making it the most important.
Table 1.
Parameter values for different exposure pathways in the health risk model.
The reason for this may be that, on the one hand, there are some industrial enterprises in Luannan County. The wastewater discharged by these industrial enterprises contains Mn²⁺ and other pollutants, and this wastewater is discharged directly without effective treatment. It then penetrates into the underground aquifer through soil pore spaces and other pathways, leading to elevated Mn²⁺ levels in the groundwater. For example, Sijiaying Iron Ore Mine South and Macheng Iron Ore Mine are important iron ore resources in Luannan County. Sijiaying Iron Ore Mine South is a super-large-scale low-grade iron ore deposit in China, with B+C+D grade iron ore resource reserves amounting to 14.50×10⁸ t, while Macheng Iron Ore Mine is the largest single iron ore deposit discovered in China since the 1980s, with total reserves of 10.44×10⁸ t. Iron ore mining activities can lead to an increase in the Mn²⁺ content of groundwater through a combination of acidic wastewater formation, leaching of waste rock and tailings, mine drainage, and the regional geological background.
Table 2.
Random Forest hyperparameter optimization results.
On the other hand, Luannan County has a large amount of agricultural land, where farmers may overuse fertilizers and pesticides. These substances seep into the underground aquifer with irrigation water or rainwater, and the Mn²⁺ they contain gradually accumulates, resulting in increased Mn²⁺ concentrations in the groundwater [40].
Water Quality Assessment
The 134 groups of water quality samples in the study area were classified into groundwater quality classes using the EWQI evaluation method, and the results of the classification are shown in Table 3. It shows that there is no Class I in the study area, and the numbers of Class II, Class III, Class IV, and Class V water quality are 25, 95, 13, and 1 groups, respectively, with Class III water accounting for the highest percentage. This indicates that the groundwater quality in the study area is better as a whole.
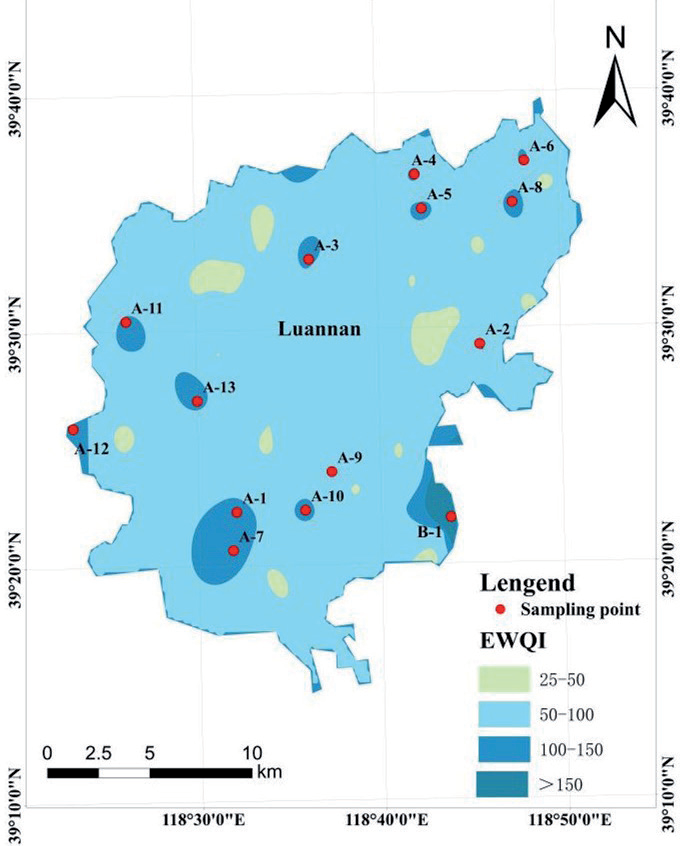
As can be seen from Fig. 6, the proportion of Class II water is 19%, Class III water is 71%, Class IV water and Class V water is 10%, and the poorer water quality areas are mainly concentrated in the southwest and north. Meanwhile, the better water quality areas are distributed in the center and the east, and on the whole, the water quality in Luannan County is better. The points with numbers in the figure indicate poor water quality. The poor water quality in the northern region may be influenced by mine pit drainage, while the poor water quality in the southern region is mainly due to the fact that it is predominantly agricultural land. This suggests that the southern region’s groundwater deterioration is primarily caused by the excessive use of pesticides and chemical fertilizers, which leads to declining groundwater quality [41]. According to statistics, the amount of fertilizer applied in Luannan County is much higher than the safety limit of 225 kg/hm2 set by developed countries to prevent fertilizer pollution, and the impact of agricultural surface pollution on river water quality and groundwater can no longer be ignored [42].
The rapid development of the agricultural economy in Luannan County has put forward higher requirements for groundwater extraction and development. Changes in land use types can reflect changes in human activities and are often used to study human activities. The population growth rate in the area is also a reflection of human activities. The increase in pollution puts a lot of pressure on groundwater, and the type of land use affects the groundwater cycle [43, 44].
Health Risk Assessment
In the evaluation of groundwater quality, the spatial distribution of physico-chemical parameters is crucial for understanding the water quality conditions. Fig. 7 shows that the spatial distribution of physicochemical parameters within the study area shows some similarity, with high concentration values concentrated in the southwest and northern regions. This distribution pattern is consistent with the overall groundwater quality map (Fig. 4), further confirming that these regions may be high-risk areas for groundwater contamination. In particular, the distribution map of Mn2+ ions showed that all points with high concentration values exceeded the standard of Class III water, which verified that Mn2+ ions are one of the most important indicators affecting the quality of groundwater, which is consistent with the previous results obtained through the Random Forest method.
Mn2+ is an important non-carcinogenic factor affecting human health. Therefore, Mn2+ was selected for non-carcinogenic health risk assessment in this study. Non-carcinogenic risk assessment was performed separately for men, women, and children [45-47], and the results are shown in Table 4.
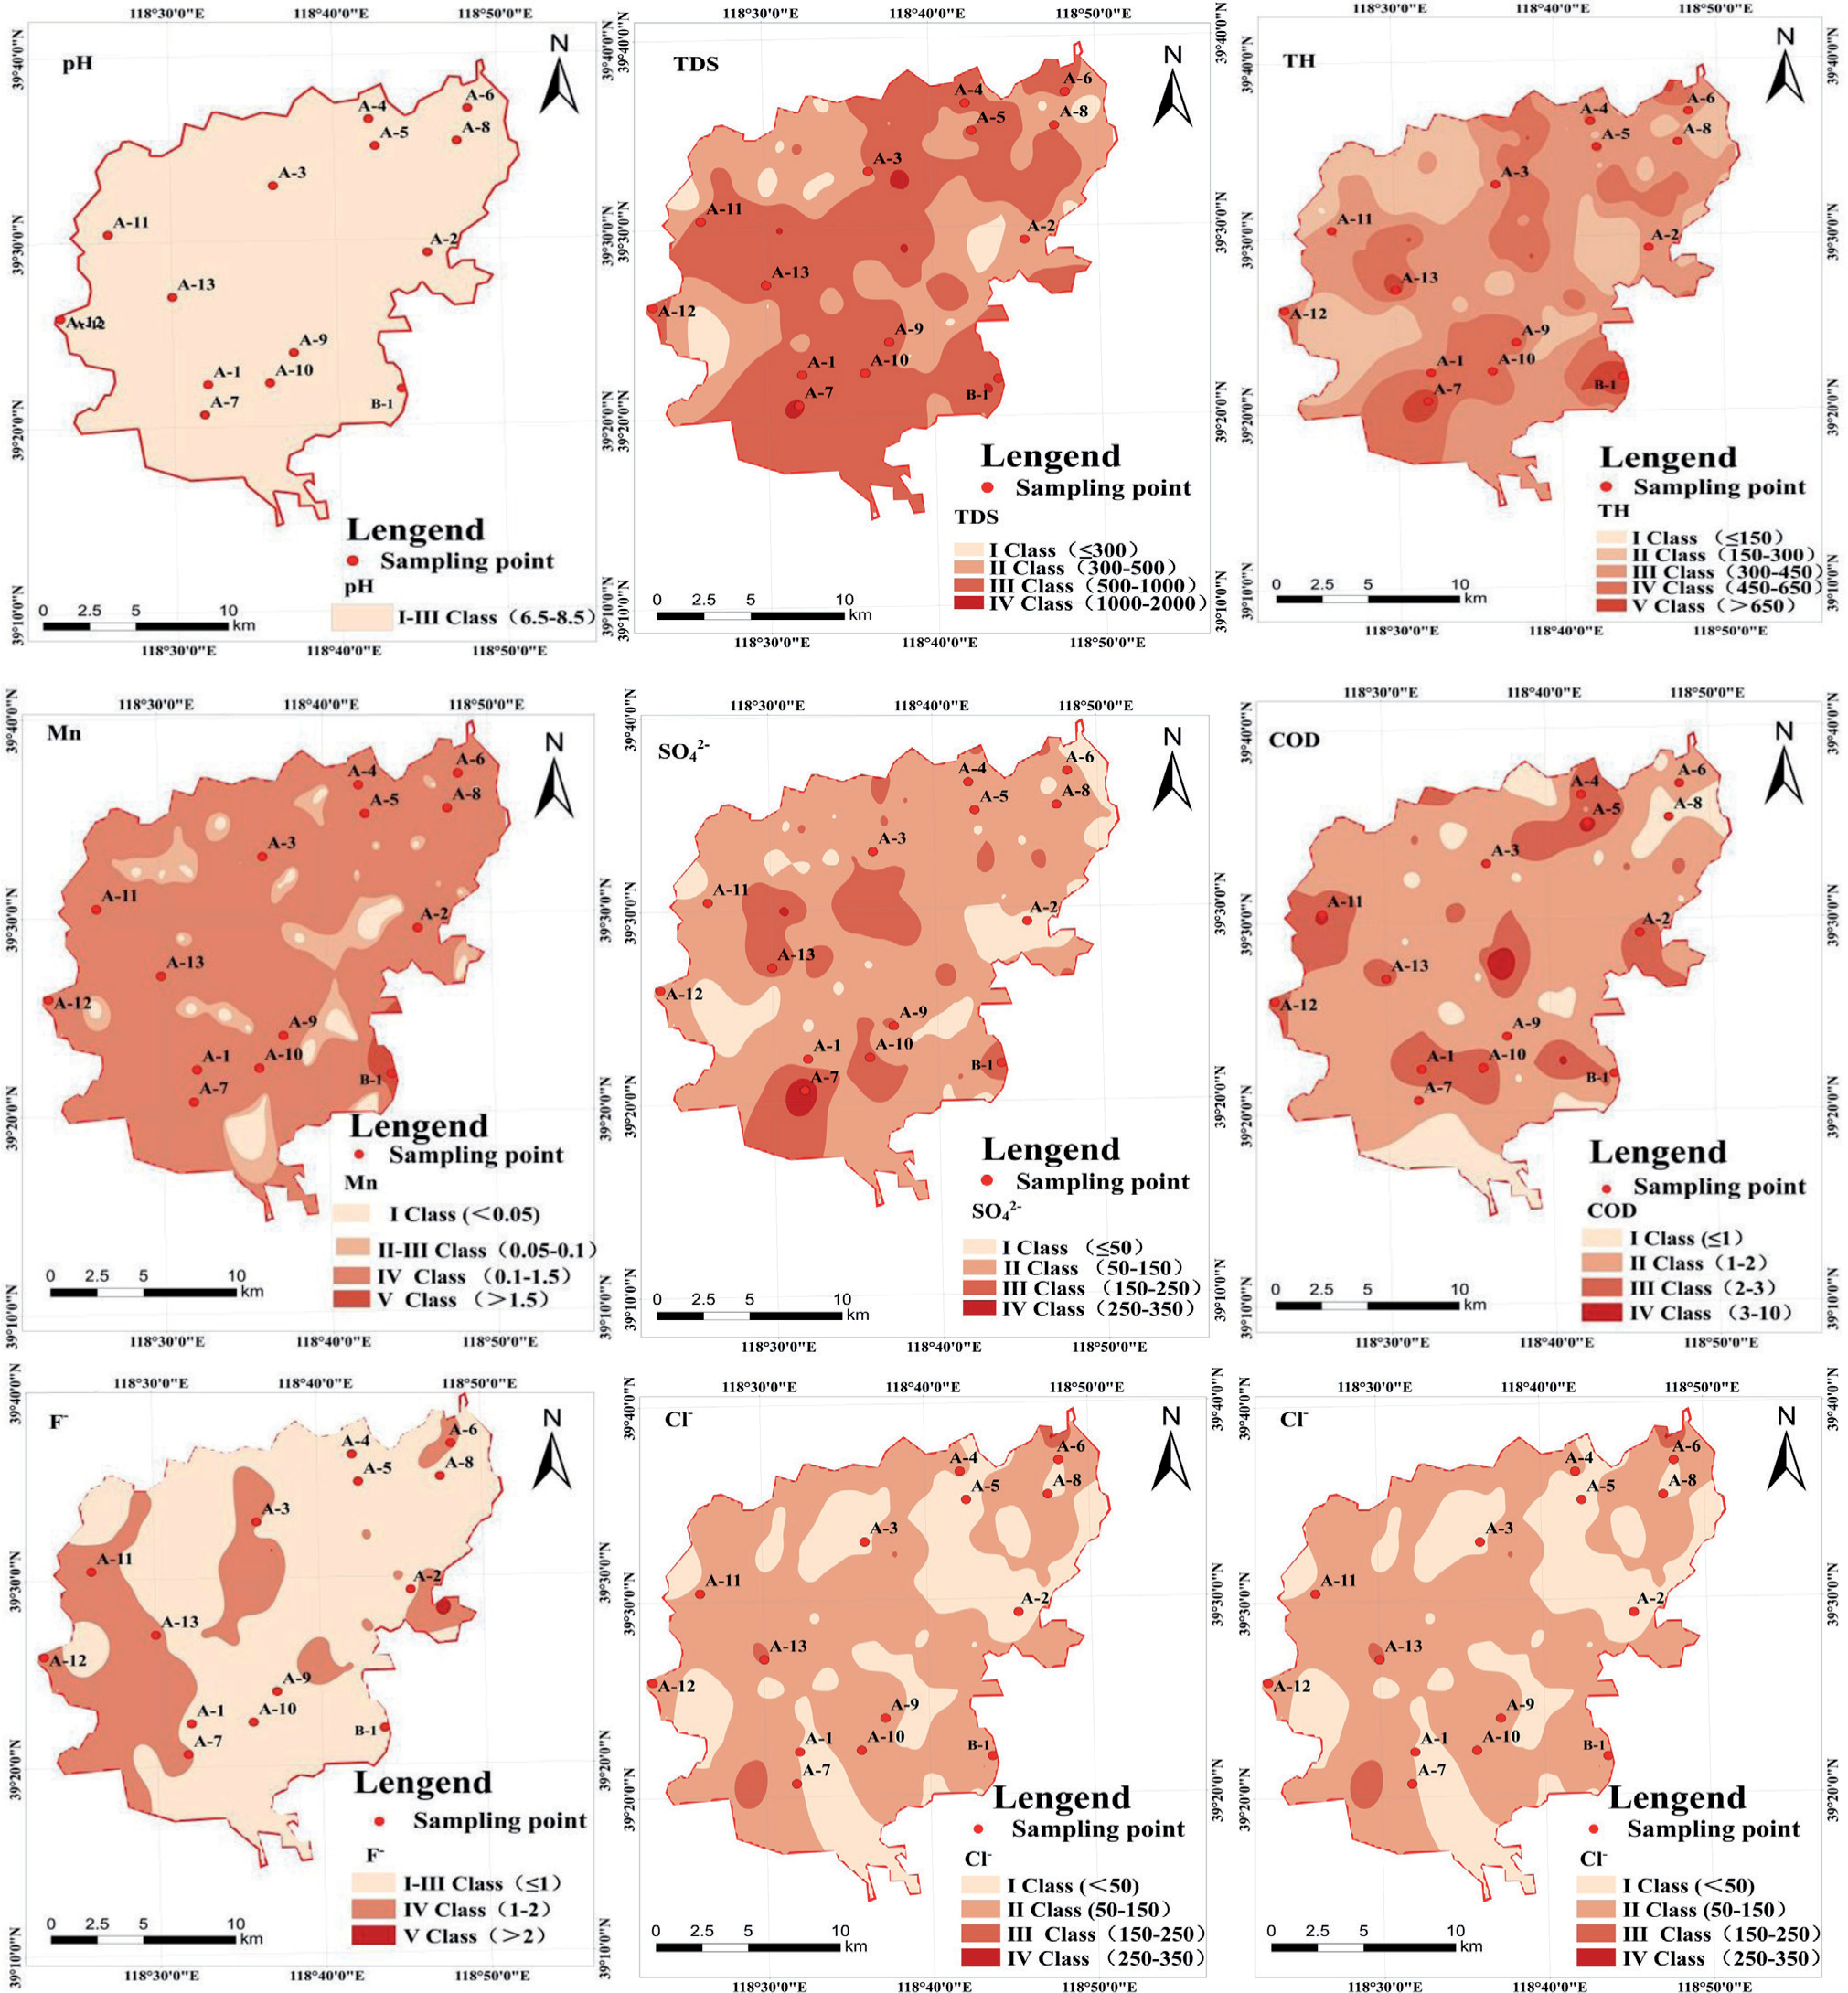
Table 4 shows that the HQoral for children ranged from 0.43 to 6.51 with a mean value of 1.33. 43% of the samples had HQoral greater than 1, whereas the HQdermal for children were all less than 1, suggesting a lower risk due to dermal exposure. For adults, the maximum risk due to dermal exposure (HQdermal) was 2.99 and 3.81 for males and females, respectively, while the maximum risk due to oral ingestion exposure (HQoral) was 3.36 and 4.21 for males and females, respectively, suggesting that the risk due to oral ingestion is greater than that due to dermal exposure.
As for the total risk (HItotal), 64%, 1%, and 1% of the samples had a HItotal greater than 1 for children, females, and males, respectively. The results suggest that children are the most vulnerable population because of their lower body weight [48, 49].
In this study, a deterministic approach was used for human risk assessment, and the values of BW, AT, and H are the results of statistical investigations. They represent only the average level, and the results of the study can provide general risk information for decision makers. Based on the results of the water quality assessment, policymakers are recommended to take the following measures to protect and improve water quality: First, residents' awareness of safe drinking water should be raised, as many residents do not have sufficient knowledge of safe and healthy drinking water and are not fully aware of the possible health risks associated with drinking contaminated groundwater. Therefore, managers need to urge villagers to change their habit of drinking groundwater directly, which can be achieved through education and publicity campaigns. Secondly, the water supply sector needs to strengthen the construction of centralized water supply systems to ensure the quantity and quality of water supply, so as to provide basic protection for residents' daily use of water and to reduce the direct access of residents to poor-quality groundwater. In addition, local authorities need to strengthen groundwater monitoring to ensure the health of the groundwater environment, which can also ensure the safety of residents using groundwater. Through these measures, groundwater quality can be effectively protected and improved to ensure the safety of residents' drinking water.
Table 4.
Non-Carcinogenic Risks through Drinking Water Intake and Dermal Exposure in Different Populations.
Conclusions
In this paper, a Random Forest classification model for conducting groundwater quality assessment was constructed, and 70% (93 groups) of the 134 groups of groundwater quality samples in Luannan County were randomly selected as the training dataset. The remaining 30% (40 groups) of data were used as the test dataset; the hyperparameters of the Random Forest model were optimized using the grid search algorithm, and the following conclusions were drawn:
(1) The overall groundwater quality condition in the study area is good, and the indicators of exceeding Class III water only account for 10%. The areas with poor water quality are mainly concentrated in the southwest and north, while the areas with good water quality are distributed in the center and east. Evaluation of the importance of categorical indicators of Random Forests shows that the most important influence indicator of groundwater quality in the study area is Mn2+. Among them, the main sources of Mn2+ are mine pit drainage and excessive use of pesticides and fertilizers.
(2) In this study, Mn2+ was selected for non-carcinogenic risk assessment for men, women, and children, respectively. The results showed that the risk due to oral intake was greater than that due to dermal contact, and the percentage of samples with HItotal >1 was 1% for both men and women, while the percentage of samples with HItotal >1 for children was 64%. This indicates that children are the most vulnerable group, and Mn2+ poses a health risk to human beings. Certain measures, such as controlling pollution and reducing Mn2+ levels in groundwater, must be taken to minimize health risks.

