

Introduction
As a heavy metal, chromium (Cr) is widely used in a large variety of industries, such as textile mills, electroplating plants, wood mills, and tanneries [1, 2]. Take the chromium-rich tannery wastewater as an example, the concentration of Cr varies greatly due to the different processes and the amount of chemicals used, which are mostly distributed in the range of 0.2 - 247 mg/L based on previous studies [3-7]. Maximum permissible limits of total Cr for drinking water are 0.1 mg/L and 0.05 mg/L according to the United States Environmental Protection Agency (USEPA) and World Health Organization (WHO), respectively [8]. As the dominating existing form of Cr, Cr(Ⅵ) in the wastewater discharged from the industries can cause substantial harm to aquatic creatures and human health due to its carcinogenic, teratogenic, and mutagenic nature [9]. As a result, Cr(VI)-bearing wastewater must be purified before being discharged into the environment.
Various techniques, including adsorption [10], membrane filtration [11], electrocoagulation [12], ion exchange [13], and other approaches have been investigated for Cr(VI)-bearing wastewater purification [14]. Among the techniques listed above, adsorption has attracted particular attention because of its merits, including low cost, easy operation, and high performance, etc. [15].
According to previous studies, biochars generated from diverse raw materials have been applied for Cr(VI) removal successfully due to their merits of a wide range of raw materials, easy preparation, and effective Cr(VI) removal performance [16-19]. Several strategies have been used to alter biochar in order to increase its Cr(VI) removal. For instance, Wang et al. prepared sludge-based biochar (SBC), KOH-activated SBC (SBC-KOH), and nano-zero-valent iron-supported SBC-KOH (nZVI@SBC-KOH). The Cr(VI) removal rates of the three materials were 34.83%, 61.58%, and 99.36%, respectively [20]. Shi et al. modified the biochar derived from glue residue with HCl, ZnCl2, and KOH, and the research showed that all the three modified biochars performed better than the raw biochar for Cr(VI) removal [21]. Amino compounds [22] have received a lot of attention among the modifiers because they can greatly increase the Cr(VI) removal of biochar by strong electrostatic attraction between the Cr(VI) oxyanion and the protonated amine, formation of chelate between Cr(VI) and basic amine groups and reduction of Cr(VI) to Cr(III) with lower toxicity by amine groups [23, 24]. Deng et al. modified Camellia oleifera shell-based biochar with acrylamide and dimethyldiallyl ammonium chloride to significantly increase its Cr(VI) removal from 36.4 to 394.0 mg/g [25].
The growing urbanization in China generates a tremendous amount of GW. Currently, GW is mostly disposed of through incineration, landfill and biodegradation, all of which need a lot of space, cost a lot of money, and harm the environment [26]. GW has been shown to be an excellent feedstock for the production of biochar. Zhang et al. found that biochars made from six different types of garden waste had Cr(VI) adsorption values ranging from 32.7 to 51.4 mg/g [27].
In this study, we prepared a garden waste biochar (GWBC) and modified it with polyethyleneimine (PEI) to get PGWBC [28]. The prepared composite was used as an adsorbent to conducted both static and dynamic tests to explore its Cr(Ⅵ) adsorption performance.
Materials and Methods
Adsorbent Preparation
The GW used in this study was gathered from the community for a university’s teaching faculty in Zhengzhou, China. The GW is primarily composed of grass (Lolium perenne L.) and the leaves of osmanthus (Osmanthus fragrans (Thunb.) Lour.). The GW was dried in the open air for days and at 105°C for 2 h before being crushed and processed through 0.15 mm mesh. We prepared the GWBC by Pyrolysis, 15 g of GW powder was placed in a tube furnace and heated to 500- 1000°C (GWBC500-GWBC1000) at a rising gradient of 15°C/min for 2-6 h, respectively. By adding N2 to the furnace at a rate of 20 mL/min, an atmosphere free of oxygen was formed. After cooling, the black particles were broken up and put through a 0.18 mm screen to create GW biochar (GWBC).
20 mL of the PEI and methanol combination (m:m = 1:100, 1:20, and 1:10) with the mass fractions of 1%, 5% and 10% was mixed with GWBC in a range of ratios (W:V=0.1:20, 0.5:20, 1:20, 1.5:20, and 2:20), and the mixture was vigorously stirred for 5 h at 30°C. To get the PEI modified GWBC (PGWBC), the solids were filtered, washed with deionized water until the pH was constant, and then vacuum-dried for 4 h at 60°C.
Adsorbent Characterization
A Fourier transform infrared spectroscopy (FTIR, Nicolet IS50, Thermo fisher, USA) was used to analyze the functional groups of PGWBC before and after Cr(Ⅵ) adsorption. An automatic specific surface area analyzer (BELSORP-max, MicrotracBEL, Japan) was utilized to measure the specific surface area and pore features of PGWBC.
Artificial Wastewater Synthesis
The wastewater containing Cr(Ⅵ) was synthesized by dissolving a certain amount of K2Cr2O7 into the deionized water. The pH value of the working solution was adjusted using dilute HCl and NaOH solutions.
Batch Adsorption Experiment
0.02 g PGWBC was added into 50 mL Cr(VI)- bearing wastewater, and the mixture was incubated in a shaker at 120 rpm, reacting at different time spans and temperatures. The residual Cr(VI) in the supernatant was determined by a UV-vis spectrophotometer (UV- 5100, Yuanxi, China) using the 1,5-diphenylcarbazide method at 540 nm [29]. All the experiments were carried out in triplicate.
Fig. 1.
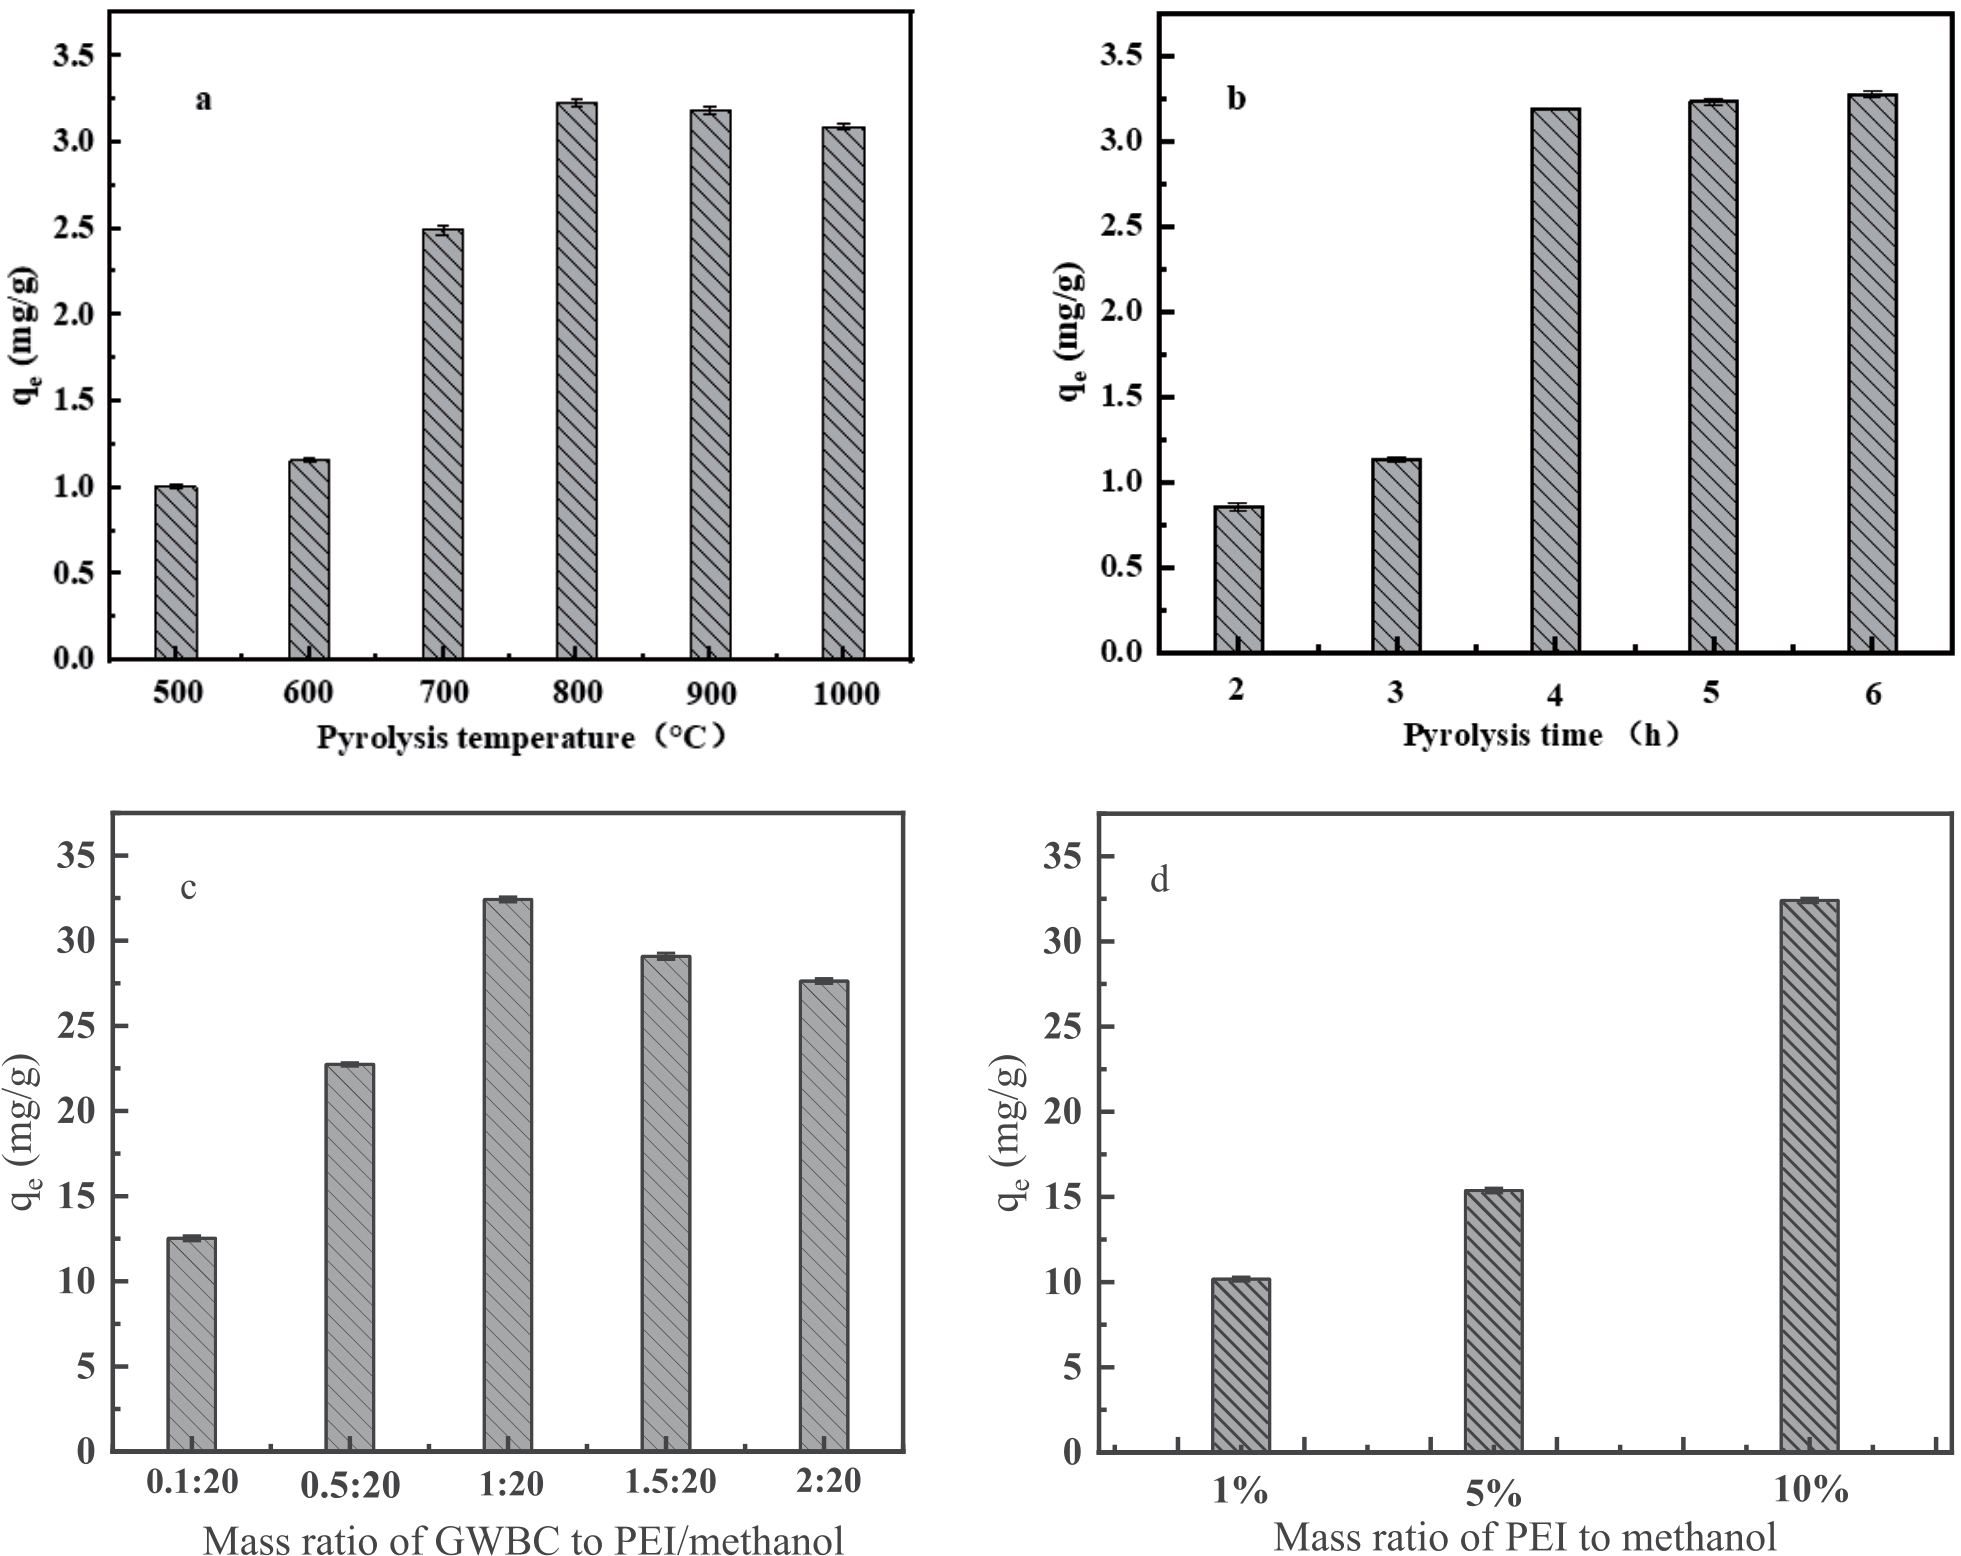
Investigation of the optimal conditions for PGWBC preparation based on the Cr(Ⅵ) adsorption: determination of the optimal temperature (a) (T=298 K, t=4 h,C0=50 mg/L); determination of the optimal pyrolysis time for GWBC preparation (b) (T=298 K, C0=50 mg/L); determination of optimal GWBC:(PEI/methanol) (m:m) (c) (T=298 K, t=4 h,C0=50 mg/L); determination of the optimal mass ratio of PEI:methanol (m:m) (d) for PGWBC preparation (T=298 K, t=4 h, C0=50 mg/L).
Results and Discussion
Investigation of the Optimal Condition for PGWBC Preparation
As shown in Fig. 1a, 800 ℃ was determined as the optimal temperature due to the fact that GWBC800 had the highest Cr(Ⅵ) uptake of 3.23 mg/g in the temperature range of 500-1000 ℃. Cr(Ⅵ) uptake rose from 0.85 mg/g to 3.18 mg/g as the pyrolysis time increased from 2 to 4 h, and continued to increase to 3.22 mg/g marginally when the pyrolysis time increased to 6h (Fig. 1b). Hence, 4h was determined as the best pyrolysis time for GWBC preparation considering the energy conservation. The ratio of GWBC:(PEI/ methanol) (m:m) =1:20 was best since PGWBC prepared at the condition had the largest Cr(Ⅵ) uptake of 32.42 mg/g (Fig. 1c), which was better the other two composites prepared using the mass fractions of 1% and 5% (Fig. 1d). According to the above description, the optimal condition for PGWBC preparation was that GWBC created at 800°C for 4 h was reacted with a combination of PEI and methanol (mPEI:mmethanol=1:10) at 1:20 (mGWBC:mPEI/methanol) , which was used to prepare the PGWBC for the following studies.
Characterization
As shown in Fig. 2, both GWBC and PGWBC possessed type Ⅳ adsorption-desorption isotherm with type H4 hysteresis loop, indicating the two materials contained mainly narrow slit mesopores. GWBC and PGWBC had pore size distribution in the range of 0.91-1.86 nm and 0.68-1.99 nm, respectively, and their corresponding peaks were located at around 1.30 nm and 1.12 nm, respectively, indicating the two biochars were mesoporous materials.
As shown in Table 1, PGWBC had a much larger BET specific area and total pore volume than those of GWBC due to the PEI modification, offering more active sites for better Cr(Ⅵ) adsorption [30], whereas, PGWBC had less average pore diameter than GWBC, which might have been caused by the blocking of the pore by PEI [31].
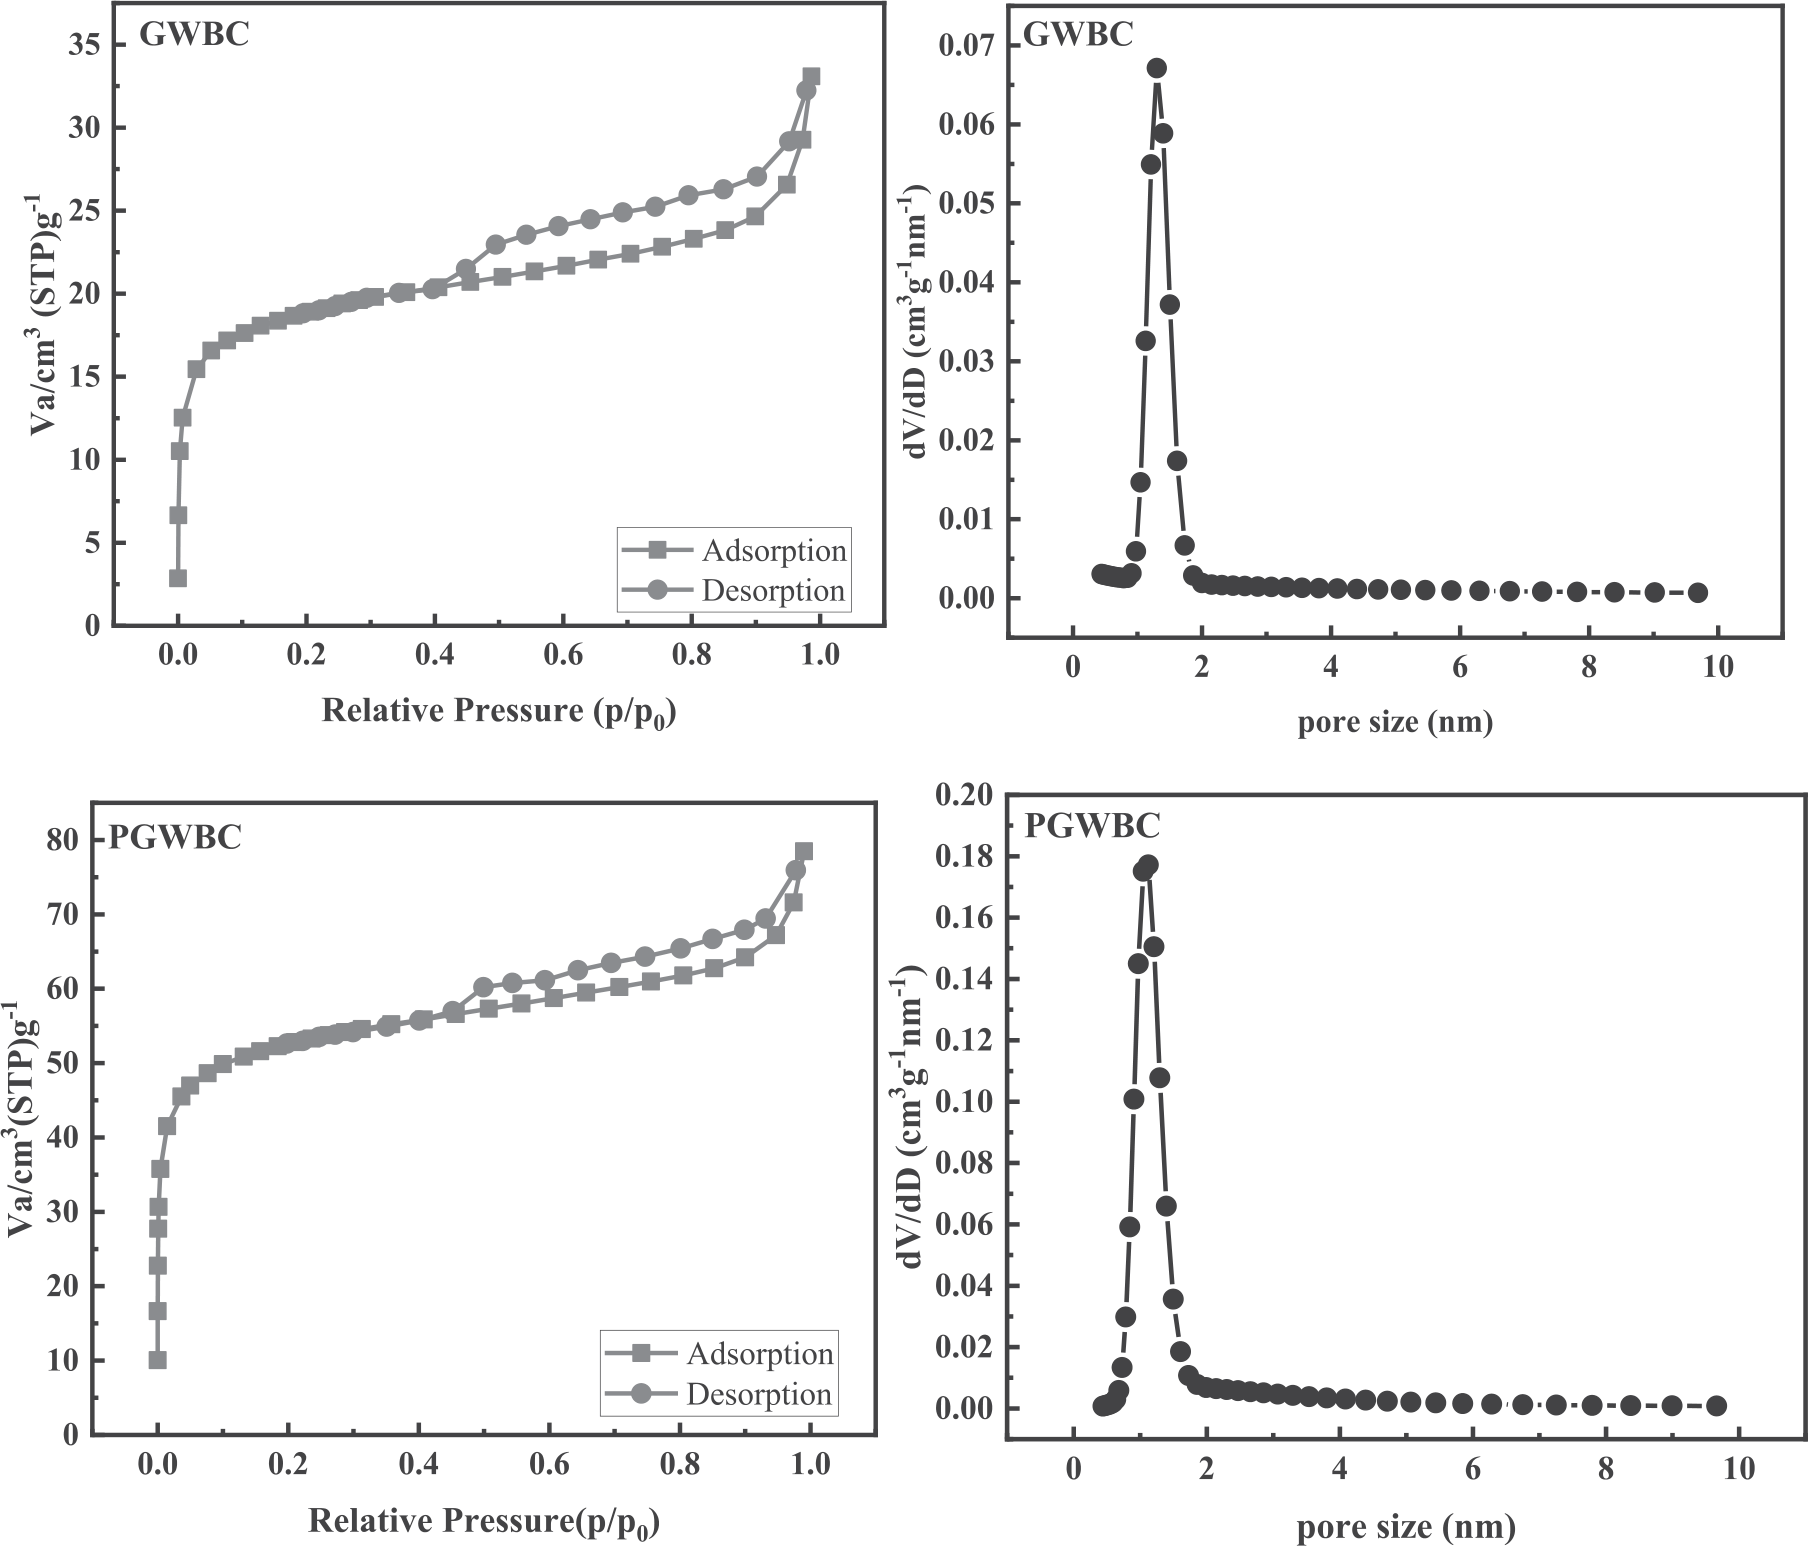
Table 1.
Specific surface areas and pore textures of GWBC and PGWBC.
| Sample | SBET (m2/g) | Vtot (cm3/g) | Average pore diameter (nm) |
|---|---|---|---|
| GWBC | 69.34 | 0.05 | 2.95 |
| PGWBC | 198.41 | 0.21 | 2.44 |
In contrast to that of GWBC (Fig. 3a), the FTIR spectra of PGWBC (Fig. 3b) showed the NH2 stretching at 3432 and 1636 cm-1 [32, 33], respectively, and CN stretching at 1384 cm-1 [34], indicating the surface of GWBC was successfully modified by PEI.
Static Adsorption
Effect of Initial Solution pH
pH played a very important role in Cr(Ⅵ) adsorption [35]. As shown in Fig. 4a, Cr(Ⅵ) uptake by PGWBC dcreased from 44.6 mg/g to 3.8 mg/g as the solution pH rose from 2 to 9, indicating lower pH was better for Cr(Ⅵ) adsorption because Cr(Ⅵ) existed primarily in the forms of oxyanions with negative charges, which competed with OH- for the active sites with rising pH, leading to a decreasing Cr(Ⅵ) adsorption. Meanwhile, as shown in Fig. 4b, pHpzc of PGWBC was at around pH=3.19, resulting in the negatively charged surface at pH>3.19, which also decreased Cr(Ⅵ) adsorption.
Kinetic Study
As shown in Fig. 5, Cr(VI) uptake rose rapidly with the increase of reaction time during the first 240 min for both of the two different initial Cr(VI) concentrations due to there being enough free active sites on the surface of PGWBC for swift Cr(VI) adsorption, and about 76.7% and 85.6% of total Cr(VI) were removed during this stage for the two reactions, respectively. In the subsequent stage, the reaction was slowed down as the active sites decreased.
The pseudo-first-order model, the pseudo-second-order model, and the Elovich model (1-3) were used to further investigate the experiment data [36-38].
Fig. 4.
Influence of the initial solution pH on the adsorption of Cr(Ⅵ) (a), Zeta potential analysis of PGWBC (b).
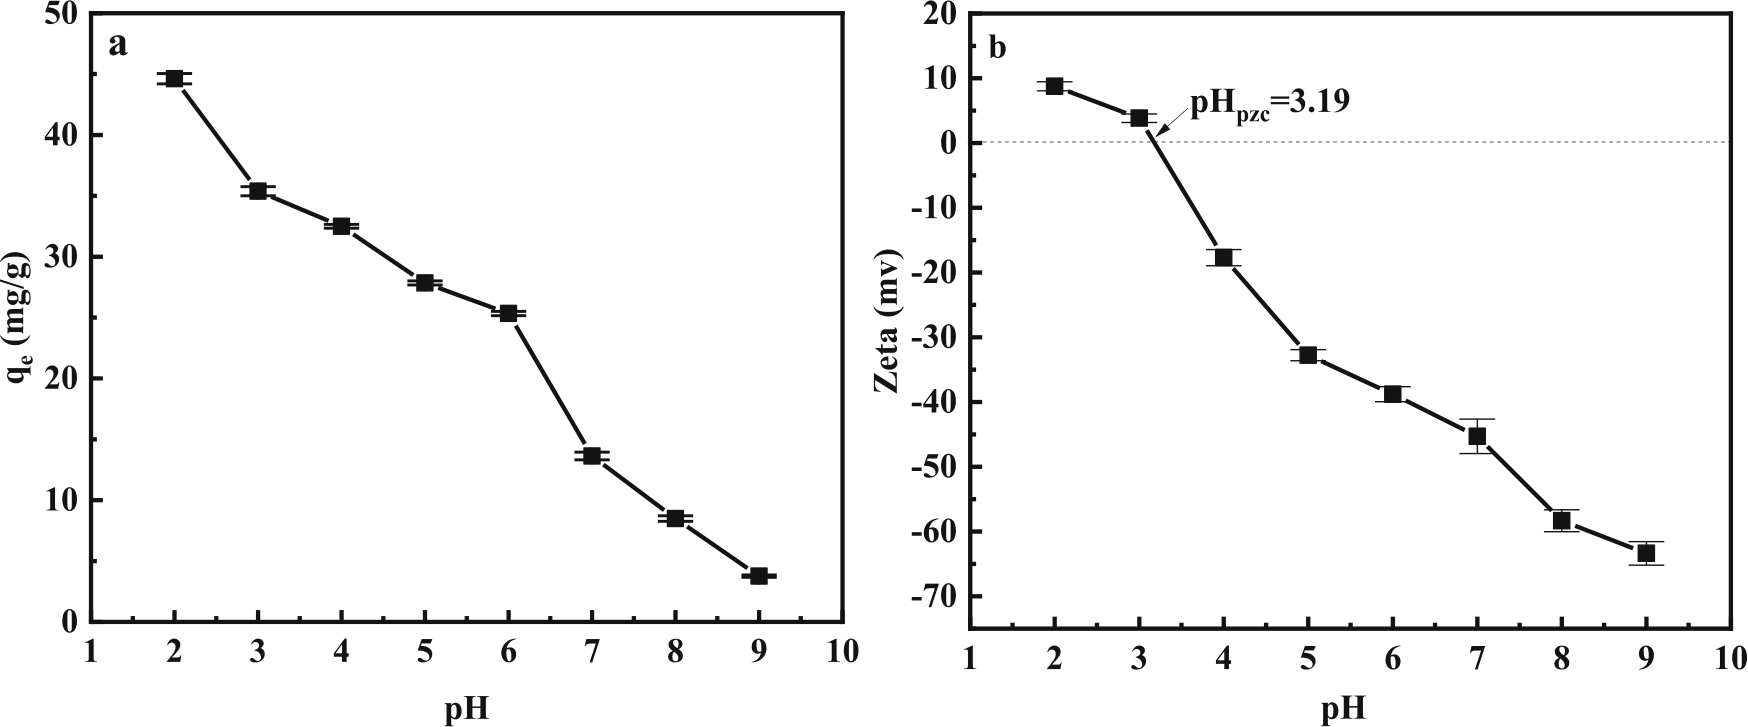
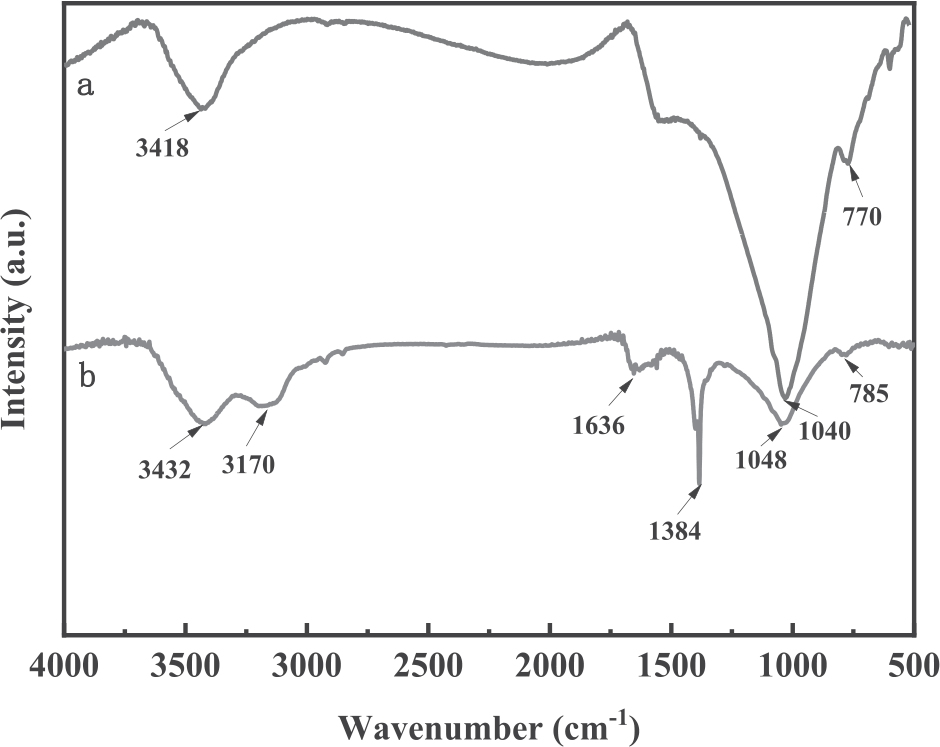
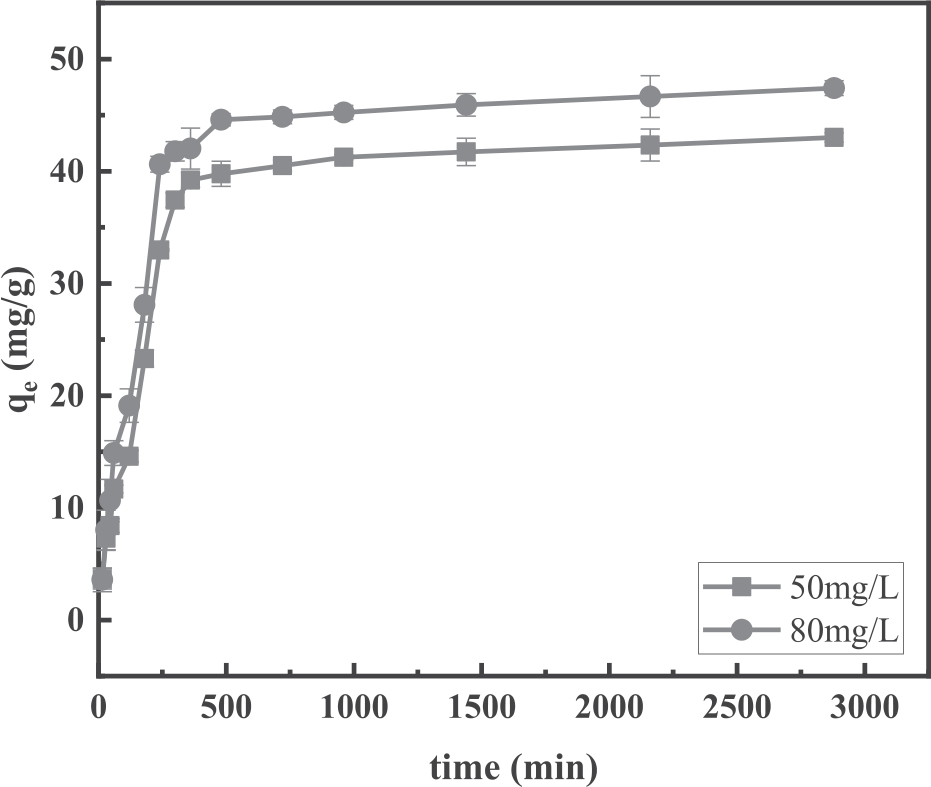
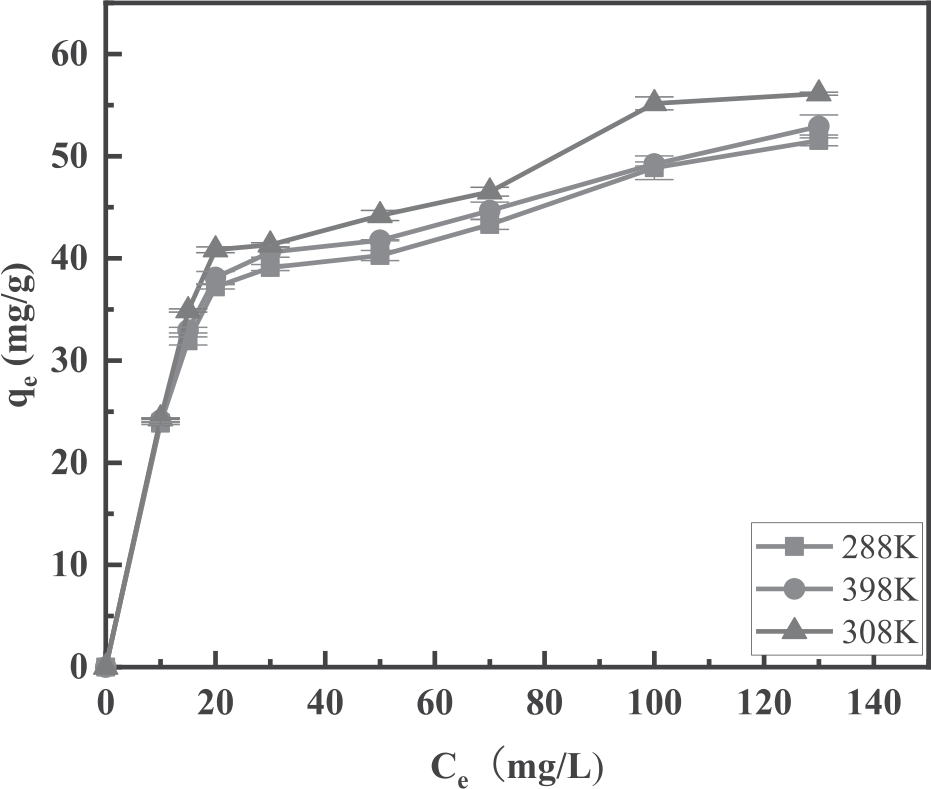
Table 2.
Kinetic parameters of Cr(Ⅵ)adsorption by PGWBC.
Table 3.
Isotherm parameters of Cr(Ⅵ) adsorption by PGWBC at different temperatures.
Where qe (mg/g) and qt (mg/g) were the Cr(VI) uptake at equilibrium and time t, respectively; k1 (min-1) and k2 (g/mg·min) were the rate constants for the pseudo-first-order model and the pseudo-second-order model, respectively; α (mg/g·min) was the Elovich adsorption rate, and β (g/mg) was the Elovich constant.
Table 2 showed the kinetic parameters of the three kinetic models. The R2 of the pseudo-second-order model was much higher than those of the other two models, and the calculated Cr(VI) uptake at equilibrium (44.33 mg/g for C0=50 mg/L, 49.65 mg/g for C0=80 mg/L) was close to the experimental values, indicating the pseudo-second-order model was best to describe the adsorption process.
Isotherm and Thermodynamic Study
Fig. 6 showed the residual Cr(VI) in the solution and the Cr(VI) adsorption by PGWBC at equilibrium. Two isotherm equations, namely, the Langmuir and Freundlich equations (4-5) were used to explore the equilibrium data [39, 40].
where qm (mg/g) was the theoretical saturated Cr(VI) adsorption, and b (L/mg) was the Langmuir constant. Both kf (Ln∙mg1–n∙g−1) and n were the Freundlich constants.
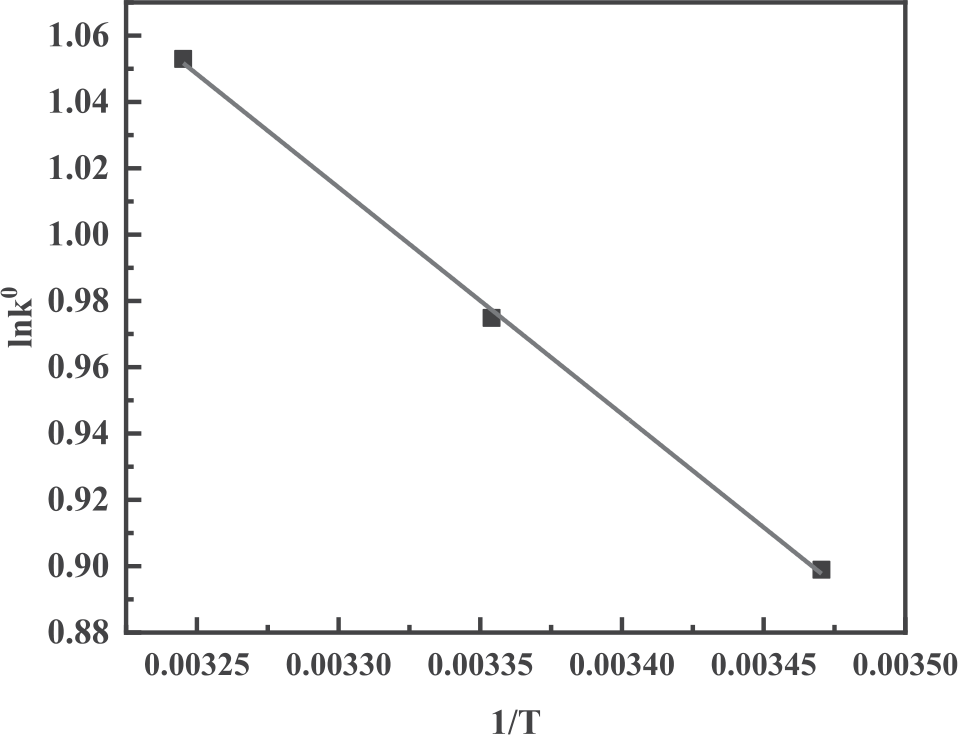
Fig. 8.
Penetration curves of Cr(Ⅵ) adsorption by PGWBC under three different influent velocities (T=298 K, pH=4, C0=50.2 mg/L).
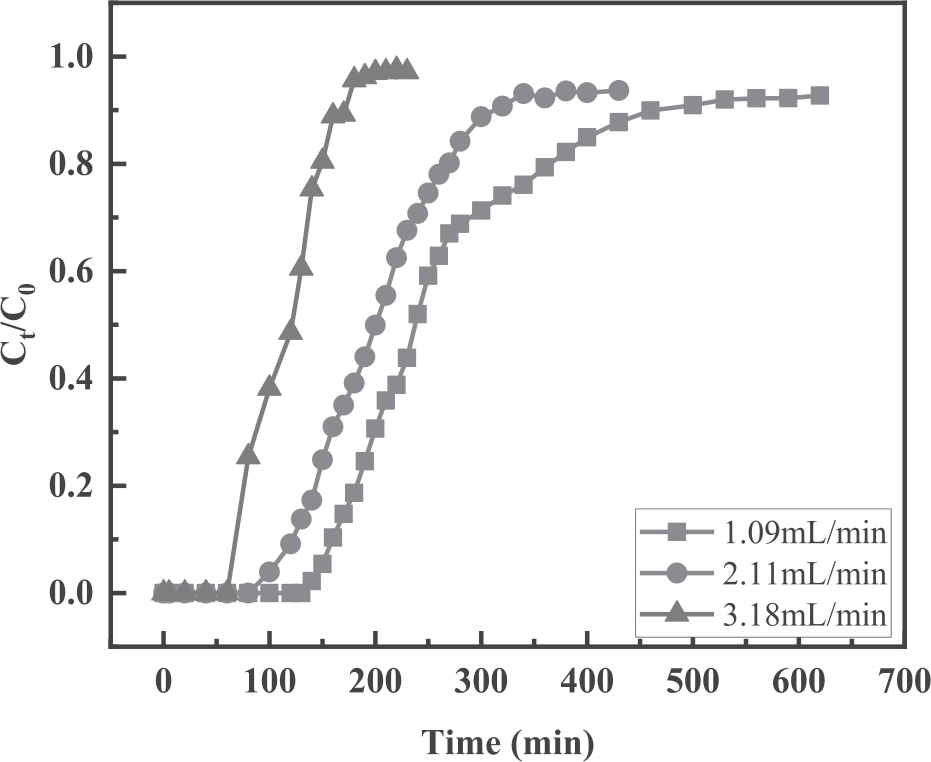
Table 3 showed the isotherm parameters of Cr(Ⅵ) by PGWBC at three different temperatures, which indicated that all the three R2 of the Langmuir model were higher than those of the Freundlich model, indicating the Langmuir model was better at describing the adsorption, and monolayer adsorption of Cr(Ⅵ) by PGWBC took place during the process.
Three thermodynamic parameters, including ΔG0, ΔS0, and ΔH0, which were calculated from the following equations (6-8) were used to analyze the thermodynamic feature of Cr(VI) adsorption by PGWBC [41].
where ΔG0, ΔH0, and ΔS0 were the Gibbs free energy change (kJ/mol), the standard enthalpy change (kJ/mol), and the standard entropy change (J/mol·K), respectively. R was the ideal gas constant (8.314 J/mol·K). k was the thermodynamic constant (L/g), which could be calculated from the intercepts of the fitted line shown in Fig. 7.
As shown in Table 4, the ΔG0 values were all negative and declined with rising temperature, implying that the adsorption of Cr (VI) by PGWBC was a spontaneous process, meanwhile, the positive ΔH0 and ΔS0 indicated the endothermic nature of the adsorption process.
Dynamic Adsorption
For further study, the influence of flow rates on Cr(Ⅵ) adsorption was investigated by a dynamic adsorption experiment. As shown in Fig. 8, the removal rate and adsorption capacity of PGWBC for Cr(Ⅵ) were decreased with the increase of flow rates, meanwhile, the time to reach saturation was also shortened due to the fact that the contact time between Cr(Ⅵ) and PGWBC got shorter with the increasing flow rate, leading to the decrease of adsorption capacities [42, 43]. Under the different flow rates of 1.09 mL/min, 2.11 mL/min, and 3.18 mL/min, the maximum Cr(Ⅵ) uptakes were 29.53mg/g, 27.76 mg/g, and 23.01 mg/g, respectively, as shown in Table 5.
The Thomas model [44, 45] and Yoon-Nelson model [46, 47] (Eqs. 9-10) were used to fit the maximum adsorption capacity in the dynamic process, the parameters were listed in Table 6 and Table 7.
Table 4.
Thermodynamic parameters of adsorption of Cr(Ⅵ) by PGWBC.
| T (K) | ΔG0 (kJ/mol) | ΔH0 (kJ/mol) | ΔS0 (J·mol-1·K-1) | |
|---|---|---|---|---|
| Cr(Ⅵ) | 288K | -2.157 | 5.6815 | 27.1810 |
| 298K | -2.417 | |||
| 308K | -2.698 |
Table 5.
Dynamic parameters of Cr(Ⅵ) adsorption by PGWBC.
| Column condition | Breakthrough analysis | ||
|---|---|---|---|
| C0 (mg/L) | Q (mL/min) | R (%) | Qe (mg/g) |
| 50.22 | 1.09 | 43.33 | 29.53 |
| 50.22 | 2.11 | 42.43 | 27.76 |
| 50.22 | 3.18 | 35.92 | 23.01 |
Table 6.
Thomas model parameters.
| Column condition | Thomas model | ||||
|---|---|---|---|---|---|
| m(g) | C0 (mg/L) | Q (mL/min) | KTH (mL·min-1·mg-1) | q0 (mg/g) | R2 |
| 1.00 | 50.22 | 1.09 | 0.22 | 30.45 | 0.9850 |
| 1.00 | 50.22 | 2.11 | 0.35 | 27.49 | 0.9923 |
| 1.00 | 50.22 | 3.18 | 0.71 | 22.27 | 0.9974 |
Table 7.
Yoon-Nelson model parameters.
where C0 (mg/L) and Ct (mg/L) were the Cr (VI) concentration at initial and time t, q0 (mg/g) was the theoretical saturated Cr (VI) adsorption uptake, m(g) was the mass of PGWBC, Q (mL/min) was the flow rate, kTh (mL/(min·mg)) was the Thomas constant, KYN (min-1) was the Yoon-Nelson constant, τ (min) was the time required for 50% adsorbent penetration, respectively.
As shown in Table 6, the values of R2 of Thomas model were higher between the two equations. The theoretical Cr(VI) uptakes calculated from the Thomas equation at varied flow rates were 30.45, 27.49 and 22.27 mg/g, respectively, which agreed with the experimental data, with the maximum relative error being 3.22%. Table 7 showed Cr(VI) uptakes calculated from the Yoon-Nelson equation were 36.48 mg/g, 34.86 mg/g, and 29.37 mg/g, which had the maximum relative error of 22.08% compared with the experimental data. Thus, the Thomas model was more suitable to represent the dynamic Cr(VI) adsorption by PGWBC.
Conclusions
PGWBC prepared under the optimal condition determined in the study was utilized to carry out both static and dynamic Cr(Ⅵ) adsorption experiments. The static adsorption experiments revealed that Cr(Ⅵ) adsorption by PGWBC decreased from 44.6 mg/g to 3.8 mg/g as the solution pH increased from 2 to 9. The adsorption process fitted the pseudo-second-order model and Langmuir equation well, and had the spontaneous and endothermic nature as well. The results of dynamic adsorption suggested that the maximum Cr(Ⅵ) uptakes decreased with the rising flow rate, and the Thomas model was better than the Yoon-Nelson model in representing the dynamic Cr(VI) adsorption by PGWBC.

