

Introduction
Copper (Cu) is an essential element for life. Nevertheless, excessive levels of Cu can become toxic [1]. Various methods are available for remediating soils contaminated with Cu, including biological/ phytoremediation, physical remediation, and electrokinetic techniques [2]. However, these methods are not feasible for large-scale applications due to their high costs and the potential risk of soil structure disruption [3]. In recent times, Cu immobilization technology in soil has emerged as effective and environmentally friendly due to its cost-effectiveness, non-toxicity, and convenience of application [4]. Researchers are employing various methods, and the utilization of biochar is one of the more effective approaches [5]. Biochar immobilizes the activity of heavy metals in the soil by transforming the speciation of metals from highly bioavailable to less bioavailable forms [6]. Biochar enhances soil fertility by augmenting nutrient content, improving water retention, enhancing microbial diversity, and improving crop yield and quality [7].
Biochar has gained recognition for its ability to immobilize heavy metals in soil due to its stable, porous, and carbonaceous structure, which provides it with large surface areas, a high pH, and a high cation exchange capacity (CEC) [8]. However, the effectiveness of biochar in metal immobilization is influenced by various factors, including biochar properties and application rate [9]. Excessive biochar application may lead to soil alkalinity and reduce crop biomass [10]. The specific characteristics of each type of biochar that contribute to variations in the bioavailability of Cu in the soil are not yet fully understood and require further investigation. The biophysical and chemical properties of biochar are primarily determined by the raw materials used [11]. In this study, two types of biochar derived from rice husks and maize stalks were selected and applied in equal quantities to Cu-contaminated soils.
Currently, most researchers tend to focus their investigations on the overall concentration of heavy metals in soil. However, indicators such as bioavailability and chemical speciation provide insights into the potential toxicity of heavy metals [12]. Metals can be associated with organic matter, calcium carbonate, or iron and manganese oxides in varying proportions [13]. Each fraction of the associated metals exhibits different levels of plant absorption and potential phytotoxicity. Speciation analysis aids in understanding the various metal fractions and facilitates the formulation of more informed decisions when utilizing biochar [14].
The objective of this study was primarily to compare the influence of two types of biochar (derived from rice husks or maize stalks) on the reduction of Cu bioavailability in pak choi based on analyzing the distribution of Cu fractions in the soil. Therefore, the specific aims of this study were as follows: (1) to elucidate any potential differences in the effects of the two types of biochar on Cu bioaccumulation and the growth of pak choi; (2) to evaluate the impact of the two biochar types on Cu immobilization and investigate the underlying mechanisms of immobilization; and (3) to determine the appropriate level of biochar that will significantly prevent the uptake of Cu by pak choi.
Material and Methods
The detailed treatment plan for the study is as follows:
1. Preparing experimental materials: soil, biochar, and chemicals. 2. Pot experiments: preparing soil pots, adding chemicals and biochar, planting, and harvesting. 3. Preparing samples: collecting soil and pak choi samples.
4. Chemical analysis: Cu concentrations and Cu fractions in soils; Cu concentrations in plants.
Experimental Materials
Agricultural soils were collected from the Tan Ba area, Thai Hoa ward, Tan Uyen town, Binh Duong Province, Vietnam, at a depth of 0 to 20 cm. The basic physicochemical properties of the experimental soil are presented: bulk density 3.01 g/cm3; particle density 1.1 g/cm3; moisture content 18.5%; pH 5.9; total N 0.033%; total P2O5 0.053%; total organic carbon content 4.35%; total Cu content 4.8 mg/kg. These soil properties were determined following the procedures described by Bao [15].
Rice husks and maize stalks were collected from the Tan Ba area, Thai Hoa ward, Tan Uyen town, Binh Duong Province. The biochar was produced through continuous slow pyrolysis under vacuum conditions, reaching a final temperature of 500 °C and a retention time of 8 hours. The elemental composition of carbon (C), nitrogen (N), hydrogen (H), and sulfur (S) was determined using an elemental analyzer. The CEC was determined using the CH3COONH4 solution method. The surface area was assessed through N2 sorption isotherms using the Brunauer-Emmett-Teller (BET) method on an automated surface area analyzer. The selected physicochemical properties of the biochar samples are as follows: Table 1.
Table 1.
Physicochemical properties of the biochar samples
Copper was incorporated into the soil samples at concentrations of 0, 50 (normal), and 200 mg/kg (toxic to plants) using CuSO4.5H2O. Biochar was uniformly mixed into the soil at rates of 0%, 1%, 2%, and 3% (w/w) for both rice husk biochar (RB) and maize stalk biochar (MB). The experimental design employed a completely randomized design with three replicates (as shown in Table 2).
After the addition of chemicals and biochar mixing, the soil was allowed to stabilize for 70 days before planting. After, the soil was fertilized with a basal fertilizer consisting of 0.15 g/kg N (urea, AR) and 0.033 g/kg P (monopotassium phosphate, AR), which were thoroughly mixed in plastic pots measuring 18 cm in diameter and 15 cm in height, each containing 2.5 kg of the equilibrated soil. The plants were grown in a greenhouse and watered periodically to maintain them at 70% of their soil capacity. The plants grow at temperatures between 24 °C and 29 °C during the day and 16 °C to 24 °C at night. After 38 days, the plants were harvested.
Table 2.
Copper and biochar concentrations in single and combined treatments
Chemical Analysis
Determination of Cu Concentration in Plants and Soils
To analyze the plant samples, a digestion process was carried out using a mixture of 4:1 (v/v) HNO3–HClO4. For the soil samples, a different oxidative acid mixture of 3:1 (v/v) HNO3–HClO4 was used. In a typical procedure, precisely 0.5 g of each sample was weighed and placed into a 100 mL glass tube. A combined volume of 10 mL of HNO3 and HClO4 was added to the tube, and the mixture was left overnight at room temperature for acid digestion. The acid digestion process was carried out in an automatic temperature-controlled furnace until the digestion solution became clear. After digestion, the sample solutions were cooled and then diluted with deionized water in a glass tube. The Cu concentration in the digestion solution was determined using an atomic absorption spectroscopy system (AAS AA-7000, Shimadzu Corporation, Kyoto, Japan). The specs of AAS used for chemical analysis are lamp intensity of 6 mA; wavelength of 324.8 nm; slit width of 0.5 nm; compressed air and acetylene; lamp type BGC-D2.
Determination of Cu Fractions in Soils
The analysis of Cu fractions involved the utilization of a sequential extraction method consisting of five steps, as described by Hu et al. [16].
(1) Exchangeable fraction (F1): shaken with 0.1 mol/L NH4HAC at 25 °C for 2 hours.
(2) Bound to carbonate fraction (F2): shaken with 1 mol/L NaAc at 25 °C for 2 hours.
(3) Bound to Fe-Mn oxidates fraction (F3): shaken with a mixture of 0.1 mol/L NH2OH+ and 0.01 mol/L HCl at 25 °C for 0.5 hours.
(4) Bound to OM fraction (F4): treated with 0.01 mol/L HNO3 and 30% H2O2, heated for 2 hours at 85 °C with intermittent shaking.
(5) Residual fraction (F5): added mixture of 15 mL HNO3, 5 mL HF, and 5 mL HClO4 and heated to 300 °C for 2 hours.
Quality Control
The certified reference materials employed in this study were QCVN 03-MT:2015/BTNMT (agricultural soil, Vietnam) and FAO/WHO. According to QCVN 03-MT:2015/BTNMT, the maximum allowable concentration of total Cu in agricultural soil is 100 mg/kg. On the other hand, FAO/WHO (2007) specifies a maximum limit of 40 mg/kg for total Cu concentration in vegetables.
Statistical Data Analysis
The data obtained from the study were analyzed using SPSS 20.0 software for statistical analysis. All results are reported as the mean ± standard deviation based on three replicates. Dunnett’s multiple comparison test of one-way ANOVA was employed in this study. A significance level of P < 0.05 was used to determine if there were significant differences between the groups.
Results and Discussion
Cu Fraction Changes in Soils Affected by Rice Husks and Maize Stalk Biochar
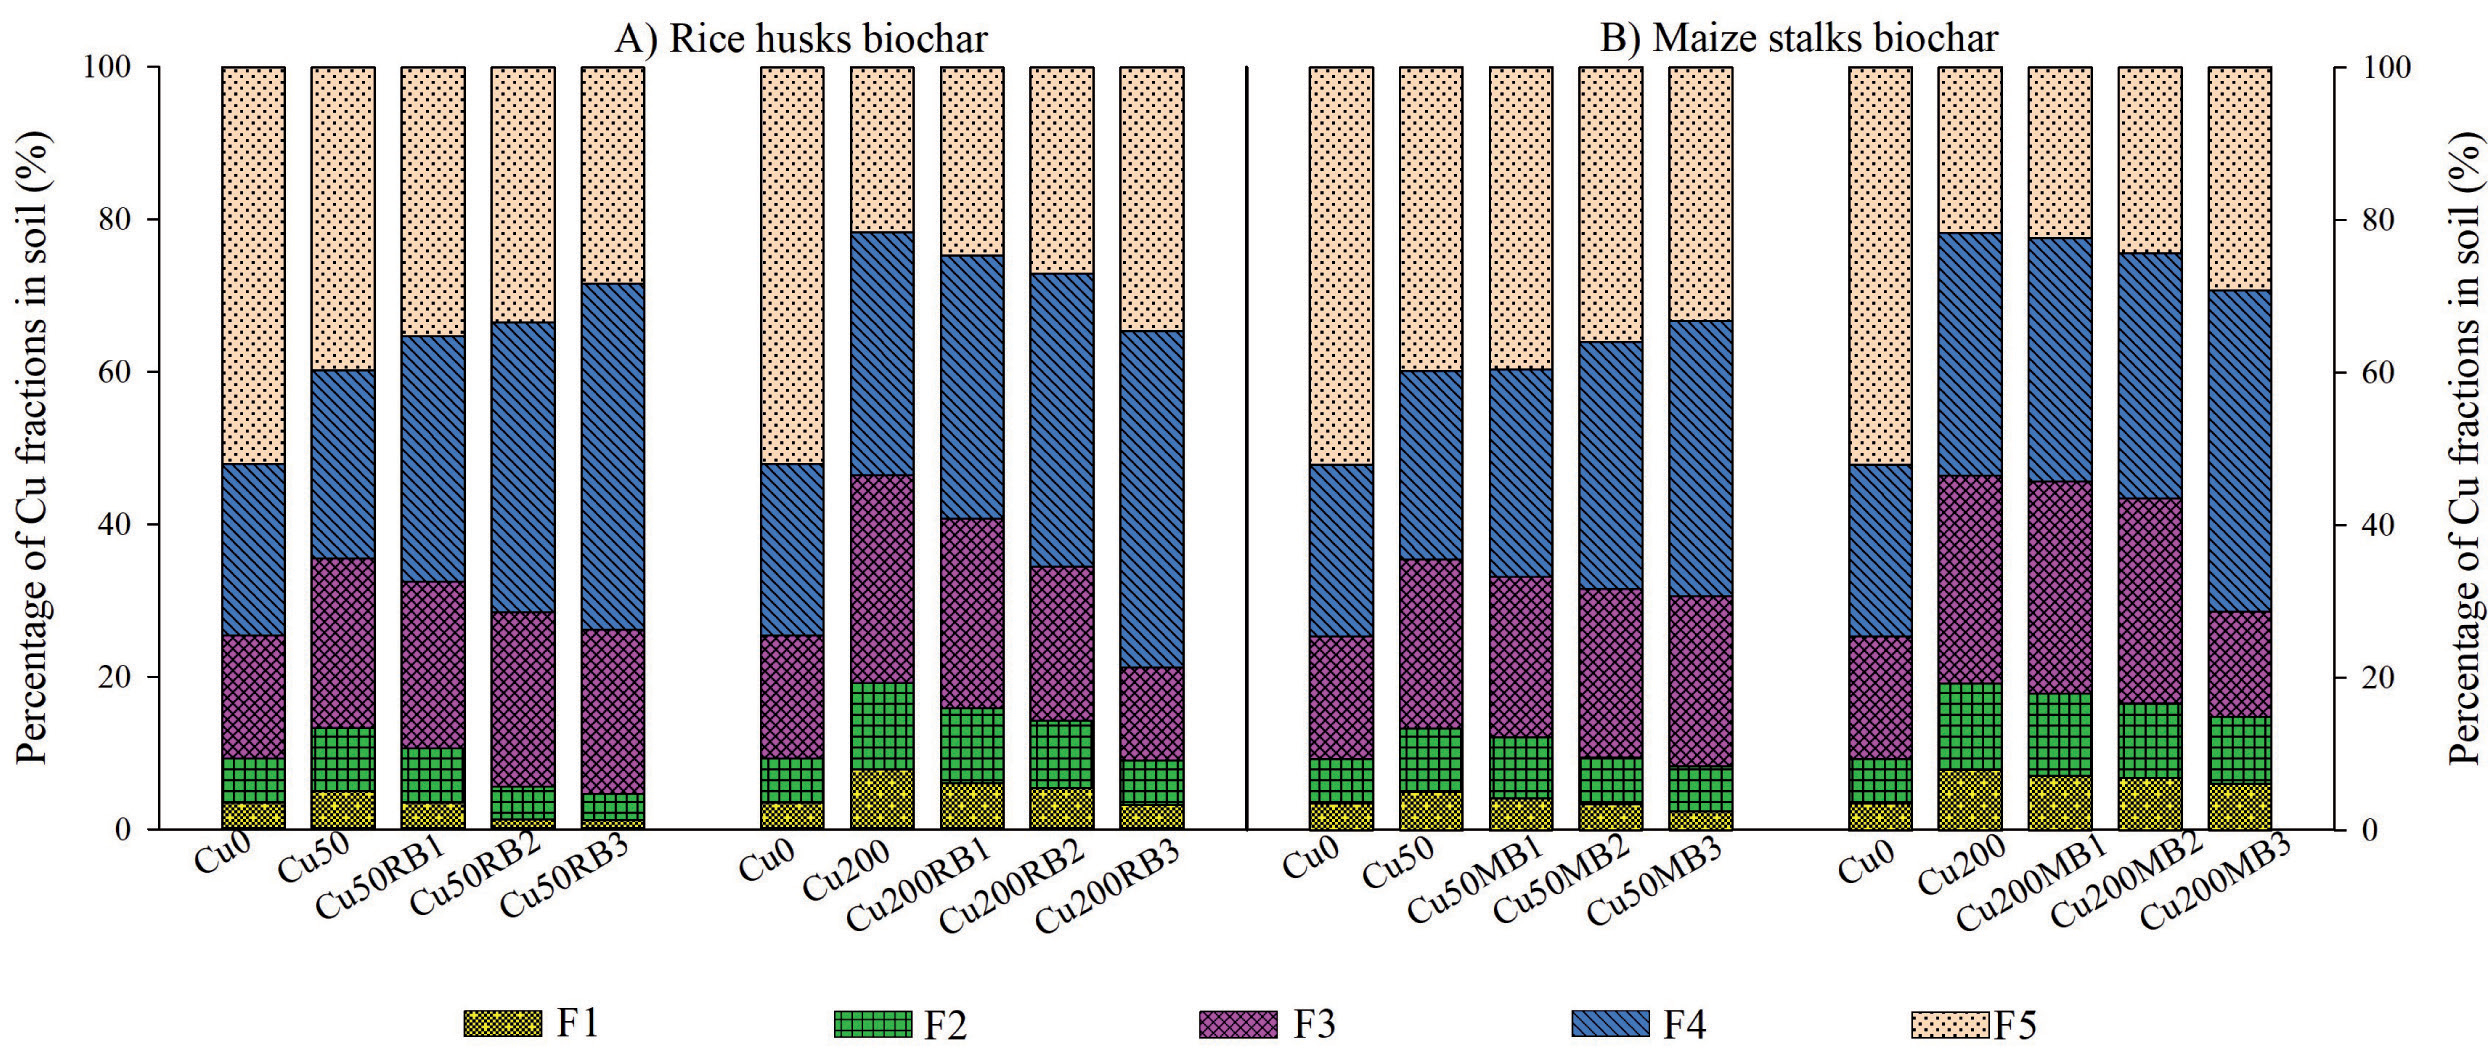
In the mobile fraction, at low Cu concentrations (50 mg/kg), RB biochar application resulted in a significant decrease in the proportions of F1 and F2 fractions to 30.0%–74.0% and 14.5%–48.2% at low and medium RB contents (1% and 2%), respectively, and this reduction remained constant at high RB content (3%) compared to medium RB contents (2%) treatments (Fig. 1). In contrast, MB biochar application resulted in a less pronounced decrease in the proportions of F1 and F2 fractions, with reductions of 50.0% and 28.9% observed at high MB content (3%) compared to the single Cu treatments (Fig. 1). At high Cu concentrations (200 mg/kg), RB biochar application led to a significant decrease in the proportions of F1 and F2 fractions by 22.8%–59.5% and 13.3%– 48.7% compared to the single Cu treatments (Fig. 1). On the other hand, MB biochar application resulted in a smaller decrease in the proportions of F1 and F2 fractions, with reductions of only 10.1%–22.8% and 4.4%–23.0% observed compared to the single Cu treatments (Fig. 1). These results also indicated that the application of biochar reduced the mobility of Cu in the soil and transformed it into more stable fractions, and RB biochar was more effective compared to MB biochar.
In the immobile fraction, the application of RB and MB biochar resulted in the conversion of mobile fractions (F1 and F2) into the F5 fraction. At high Cu concentrations (200 mg/kg), the proportions of the F5 fraction significantly increased to 59.9% for RB biochar application, whereas they only increased by 34.6% for MB biochar application at a high biochar content (3%), compared to the single Cu treatments (Fig. 1). The rate of increase in the proportions of the F5 fraction for RB biochar application was higher than that for MB biochar application. A similar trend was observed in the treatments with low Cu concentrations (50 mg/kg). The proportions of the F5 fraction increased for both types of biochar application, with a increase of 28.4% and 16.6% observed at a high content (3%) for RB and MB biochar applications, respectively (Fig. 1). These results suggest that the application of a high biochar content (3%) is more effective for both types of biochar applications. This finding is in full agreement with previous research. Previous studies by researchers [17] have also demonstrated that the addition of Cu and biochar leads to a transformation from soluble and exchangeable fractions to more stable fractions.
In the semi-mobile fractions, at medium and high RB content (2% and 3%) in the high Cu concentration (200 mg/kg) treatments, the proportions of the F3 fraction decreased to 26%–55.3%, while the proportions of the F4 fraction increased to 20.8%–38.7% (Fig. 1). There was no clear pattern observed in the changes of the F3 and F4 fractions at low and medium MB content (1% and 2%). It was only at high MB content (3%) that the proportions of the F4 fraction increased by 32.4% compared to the single Cu treatments (Fig. 1). At low Cu concentrations (50 mg/ kg), the proportions of the F3 fraction remained relatively stable, while the proportions of the F4 fraction significantly increased to 83.4% and 46.2% at high biochar content (3%) for RB and MB biochar applications, respectively (Fig. 1). The decreasing trend of the proportions of the F4 fractions was relatively consistent, but the changes in the F3 fraction were more irregular, likely due to its involvement in the transformation process from F1 and F2 to F4 and F5. The increase in the proportions of the F4 fraction observed with RB and MB biochar applications may be attributed to the high affinity of Cu and soil organic matter, leading to complexation reactions with organic functional groups [18].
The mechanism underlying the effect of biochar on Cu involves physicochemical processes in the soil such as ion exchange, electrostatic effects, physical adsorption, complexation, and precipitation [19]. 1. The functional groups on the biochar surface contribute to the ion exchange capacity of biochar and can increase soil pH through the dissociation of hydrogen ions [20]. 2. The electrostatic attraction of biochar to heavy metals occurs through the adsorption of heavy metal cations to the numerous negative charges on the soil surface, thereby stabilizing the pollutants. 3. In physical adsorption, heavy metal ions adsorb onto the large, specific surface area of biochar or diffuse into the micropores on its surface [21].
Fig. 1.
The Cu fractions proportions in soils with rice husks (RB) application (A) and maize stalks (MB) application (B)
4. Precipitation of heavy metals, along with carbonate, phosphate, or mineral phases on the biochar surface, can fix the metals in these phases [22].
RB biochar application may exhibit stronger Cu binding in soils compared to MB biochar application, which can be attributed to differences in pH, CEC, and the porous structure of the two types of biochar. Higher pH values result in more negative surface potentials of biochar, leading to further dissociation of O-containing groups, which is beneficial for heavy metal stabilization [23]. It is likely that the pH value of RB biochar (10.06) is more suitable for Cu stabilization compared to the pH value of MB biochar (8.98) (Table 1). However, excessively high pH levels may lead to the formation of soluble hydroxyl complexes, reducing the efficiency of biochar in stabilizing heavy metals [23]. At low Cu concentrations (50 mg/kg), RB biochar application at high RB content (3%) resulted in constant proportions of F1 and F2 fractions compared to treatments with medium RB content (2%) (Fig. 1). The increase in organic matter content in soil depends on factors such as the type of feedstock, pyrolysis conditions, and application rates of biochar [24]. Therefore, under the same pyrolysis conditions, the proportions of the F4 fraction increased more with the RB biochar application compared to the MB biochar application. MB biochar had the lower surface area (71.8 m2/g) and total pore volume (0.17 cm3/g), while RB biochar had the higher surface area (124.7 m2/g) and total pore volume (0.25 cm3/g) (Table 2). Therefore, surface complexation with functional groups in RB biochar is more effective, leading to a sharper increase in Cu stabilization efficiency compared to MB biochar. Additionally, it is possible that RB biochar contains more functional groups such as carboxylic, amino, and hydroxyl groups compared to MB biochar because the proportions of C, N, H, and S are higher (Table 2). The number of O-containing functional groups in biochar strongly influences the adsorption of heavy metals.
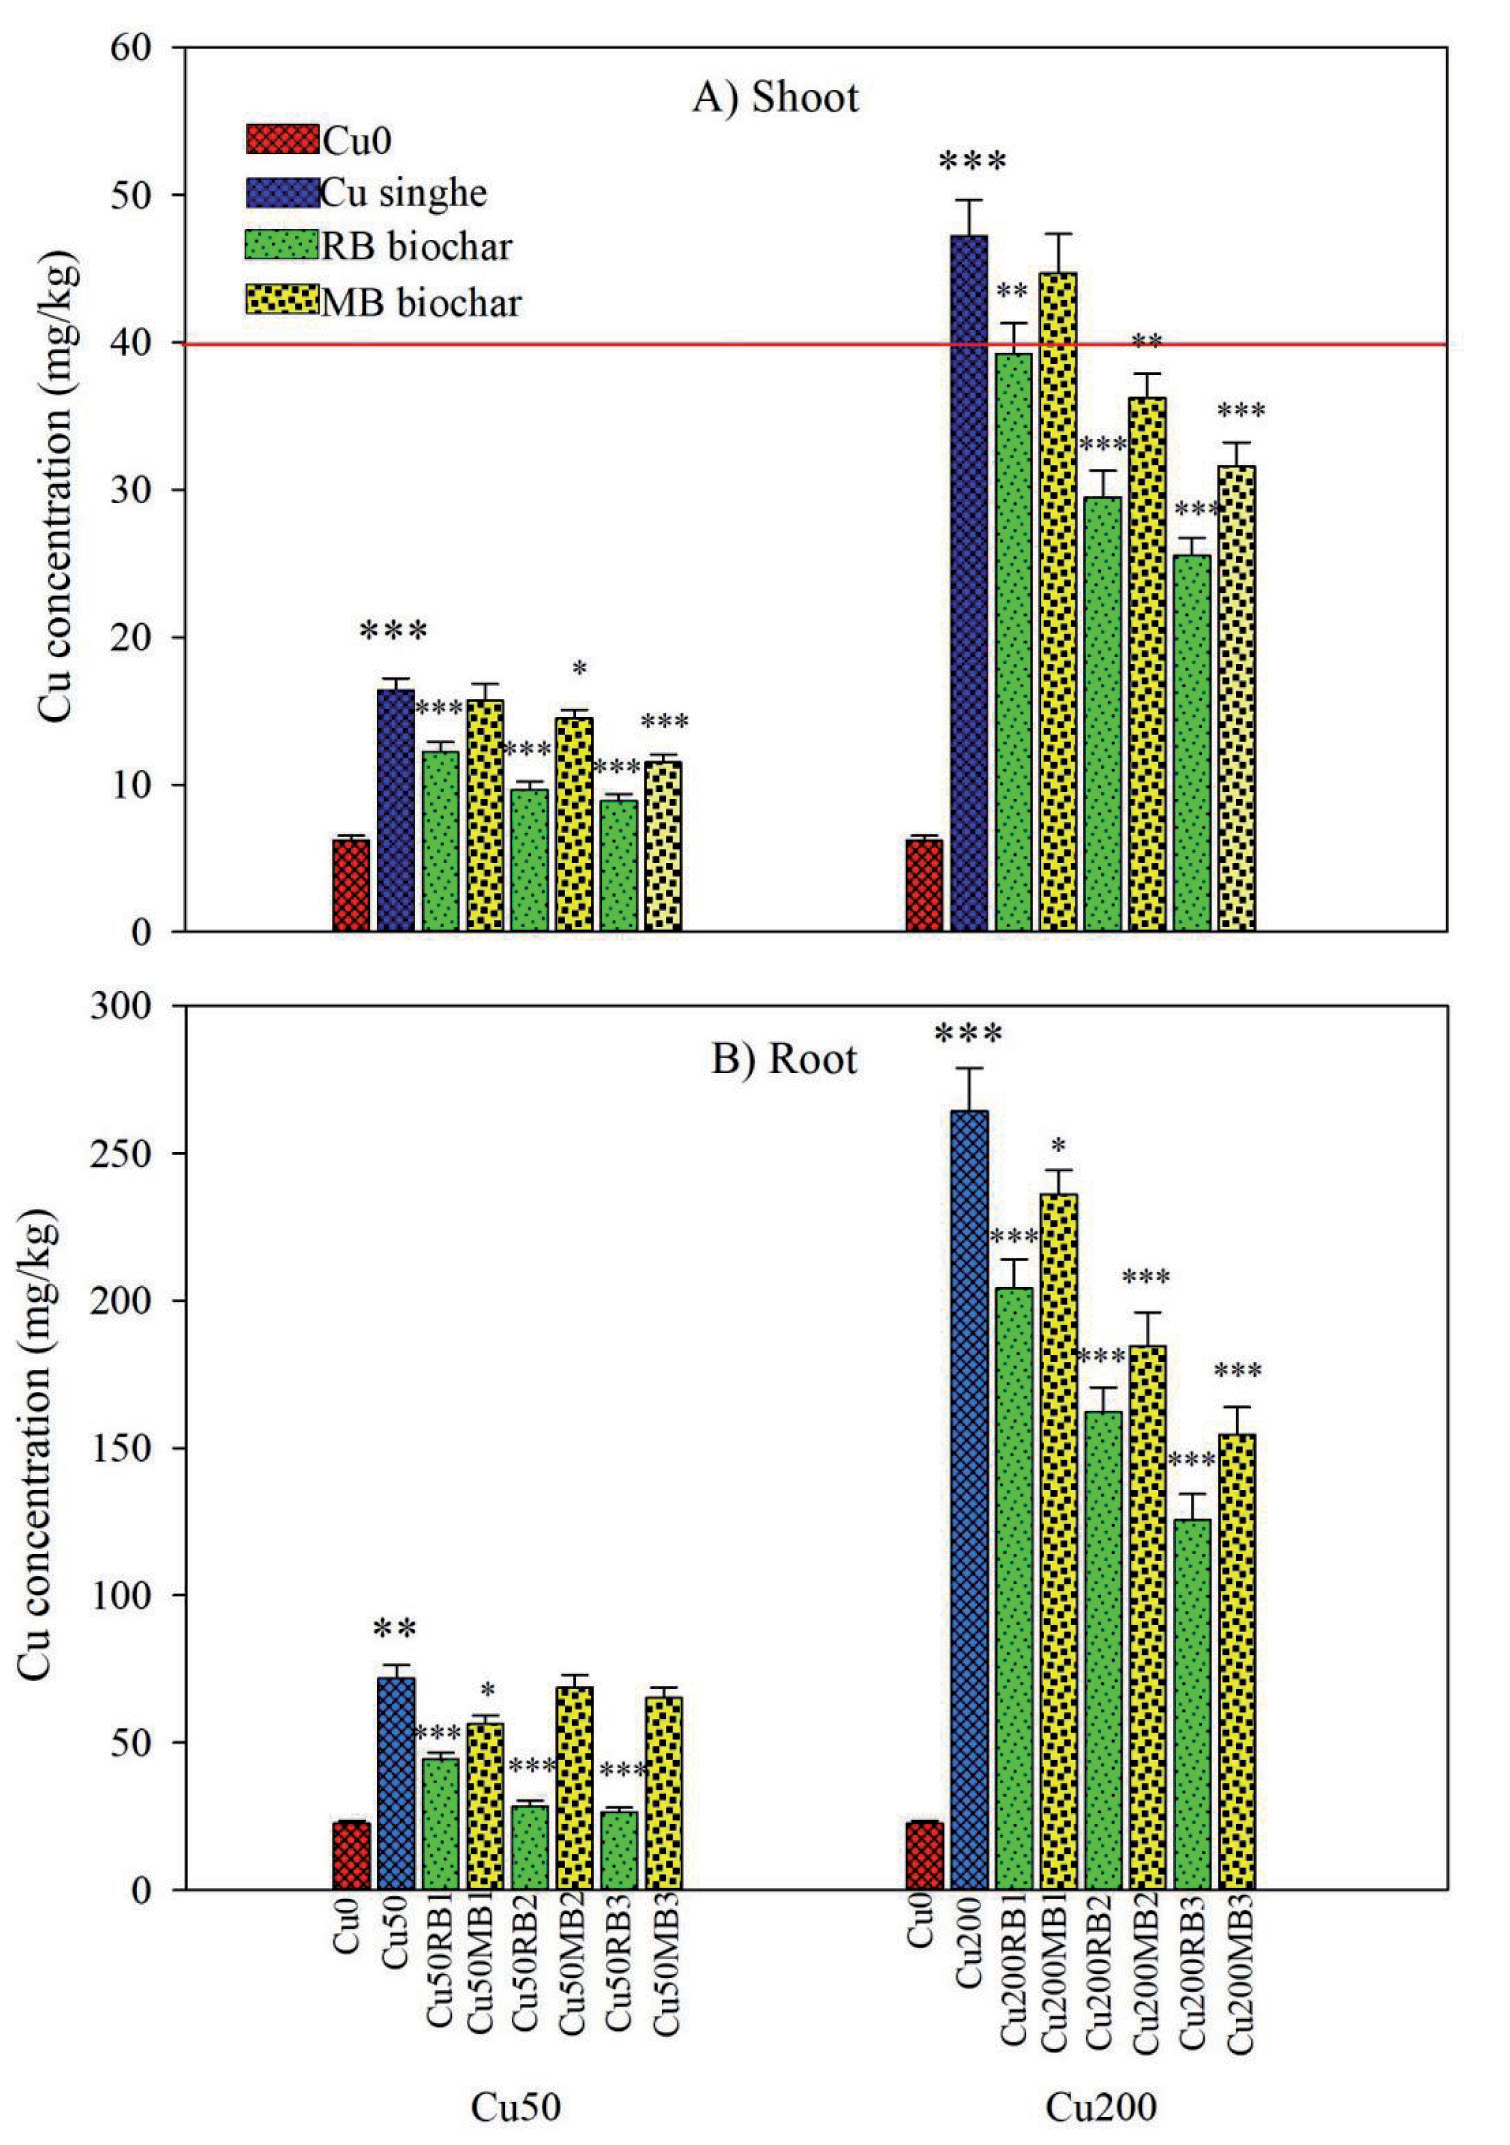
Fig. 2.
The concentrations of Cu in pak choi tissues: in shoot (A), in root (B). Data are presented as means±SD (n=3). The red line specifies a maximum limit for total Cu concentration in vegetables according to FAO/WHO (2007). Small stars indicate significant difference from no biochar (for all treatments), big stars indicate significant difference from no Cu (for only single Cu treatments) (Oneway ANOVA, followed by Dunnett’s test, * P < 0.05, ** P < 0.01, *** P < 0.001)
Cu Accumulation in Pak Choi is Affected by Rice Husks and Maize Stalk Biochar
At low Cu concentrations (50 mg/kg), the application of RB biochar significantly reduced the Cu concentrations in the shoots and roots of pak choi to 25.6%–41.5% and 38.4%–60.6% (P < 0.001) with low and medium RB content (1% and 2%), respectively, compared to the single Cu treatments (Fig. 2). However, this reduction remained constant when the RB biochar application content increased to 3% compared to the medium RB content (2%) treatments. This can be explained by the fact that the low and medium biochar content may be sufficient to absorb Cu in the biochar, reducing Cu uptake by the plants, and therefore, adding a higher content (3%) does not yield further reduction in Cu concentrations. For MB biochar application, the Cu concentrations in the shoots of pak choi decreased with all MB contents, with the highest reductions observed at the higher MB content (3%). However, this reduction was lower, and the Cu concentrations in the shoots of pak choi only significantly decreased to 29.9% (P < 0.001) at high MB contents (3%), compared to the single Cu treatments (Fig. 2). Nevertheless, there was no decrease in the Cu concentrations in the roots of pak choi when MB content exceeded 1% (P > 0.05), indicating that the Cu concentration in the roots was not significantly influenced by the MB biochar application.
At high Cu concentrations (200 mg/kg), for MB biochar application, the Cu concentrations in the shoots of pak choi were not significantly influenced by MB biochar application at low content (1%), showing a decrease of only 5.3% (P > 0.05) compared to the single Cu treatments (Fig. 2). MB biochar application at 2% and 3% content significantly reduced the Cu concentrations in the shoots and roots, decreasing them to 23.3%–33.1% (P < 0.01) and 30.2%–41.6% (P < 0.001), respectively, compared to the single Cu treatments (Fig. 2). However, for RB biochar application, the Cu concentrations in the shoots and roots of pak choi significantly decreased to 16.9%–46.0% (P < 0.01) and 22.7%–52.5% (P < 0.001), respectively, compared to the single Cu treatments (Fig. 2). These findings suggest that both types of biochar greatly inhibited Cu accumulation in pak choi tissue, particularly when the biochar addition amount was 3%, which yielded the best immobilization effect for Cu. Previous studies support our findings. Wang et al. reported that the original rice hull biochar exhibited stabilization efficiencies of 25.24% for Jiyuan soil and 35.98% for Zhuzhou soil, respectively, in relation to Cu [25]. Wang et al. demonstrated that the application of 5% bamboo biochar, straw biochar, and Chinese walnut shell biochar resulted in a 15%, 35%, and 26% reduction in Cu uptake by roots, respectively [7].
The Cu concentrations in the shoots of pak choi with RB and MB biochar application at low content (1%) ranged from 39.2 to 44.7 mg/kg, values that exceed or nearly exceed the standard value of 40 mg/kg set by FAO/ WHO (2007) for total Cu concentration in vegetables (Fig. 2). With RB and MB biochar applications at medium and high content (2% and 3%), the Cu concentrations in the shoots of pak choi ranged from 25.5 to 36.2 mg/kg (Fig. 2). Although the Cu concentrations in the shoots of pak choi did not exceed the standard value, long-term consumption of these vegetables can pose challenges for consumers, particularly with MB biochar application, where the Cu concentration in the shoots of pak choi exceeds 30 mg/kg.
The findings indicate that the RB biochar application is more effective in reducing both the bioconcentration and transportation of Cu in pak choi compared to the MB biochar application. RB biochar, with its more porous structure (average pore diameter of 3.62 nm and total pore volume of 0.25 cm3/g) and a larger surface area (124.7 m2/g) than MB biochar (average pore diameter of 2.06 nm, total pore volume of 0.17 cm3/g, and larger surface area of 71.8 m2/g), has the ability to improve soil structure and provide more adsorption sites for the stable absorption of Cu, resulting in a better reduction of Cu concentration in plants (Table 2). Additionally, RB biochar has a higher pH compared to MB biochar, leading to an increase in soil pH upon application (Table 2). The increased soil pH reduces the extractability of Cu and provides new adsorption sites in biochar-treated soils [26]. Moreover, the porous structure and surface functional groups of RB biochar may facilitate the complexation and adsorption of Cu [27].
Influence of Rice Husks and Maize Stalk Biochar on the Growth of Pak Choi
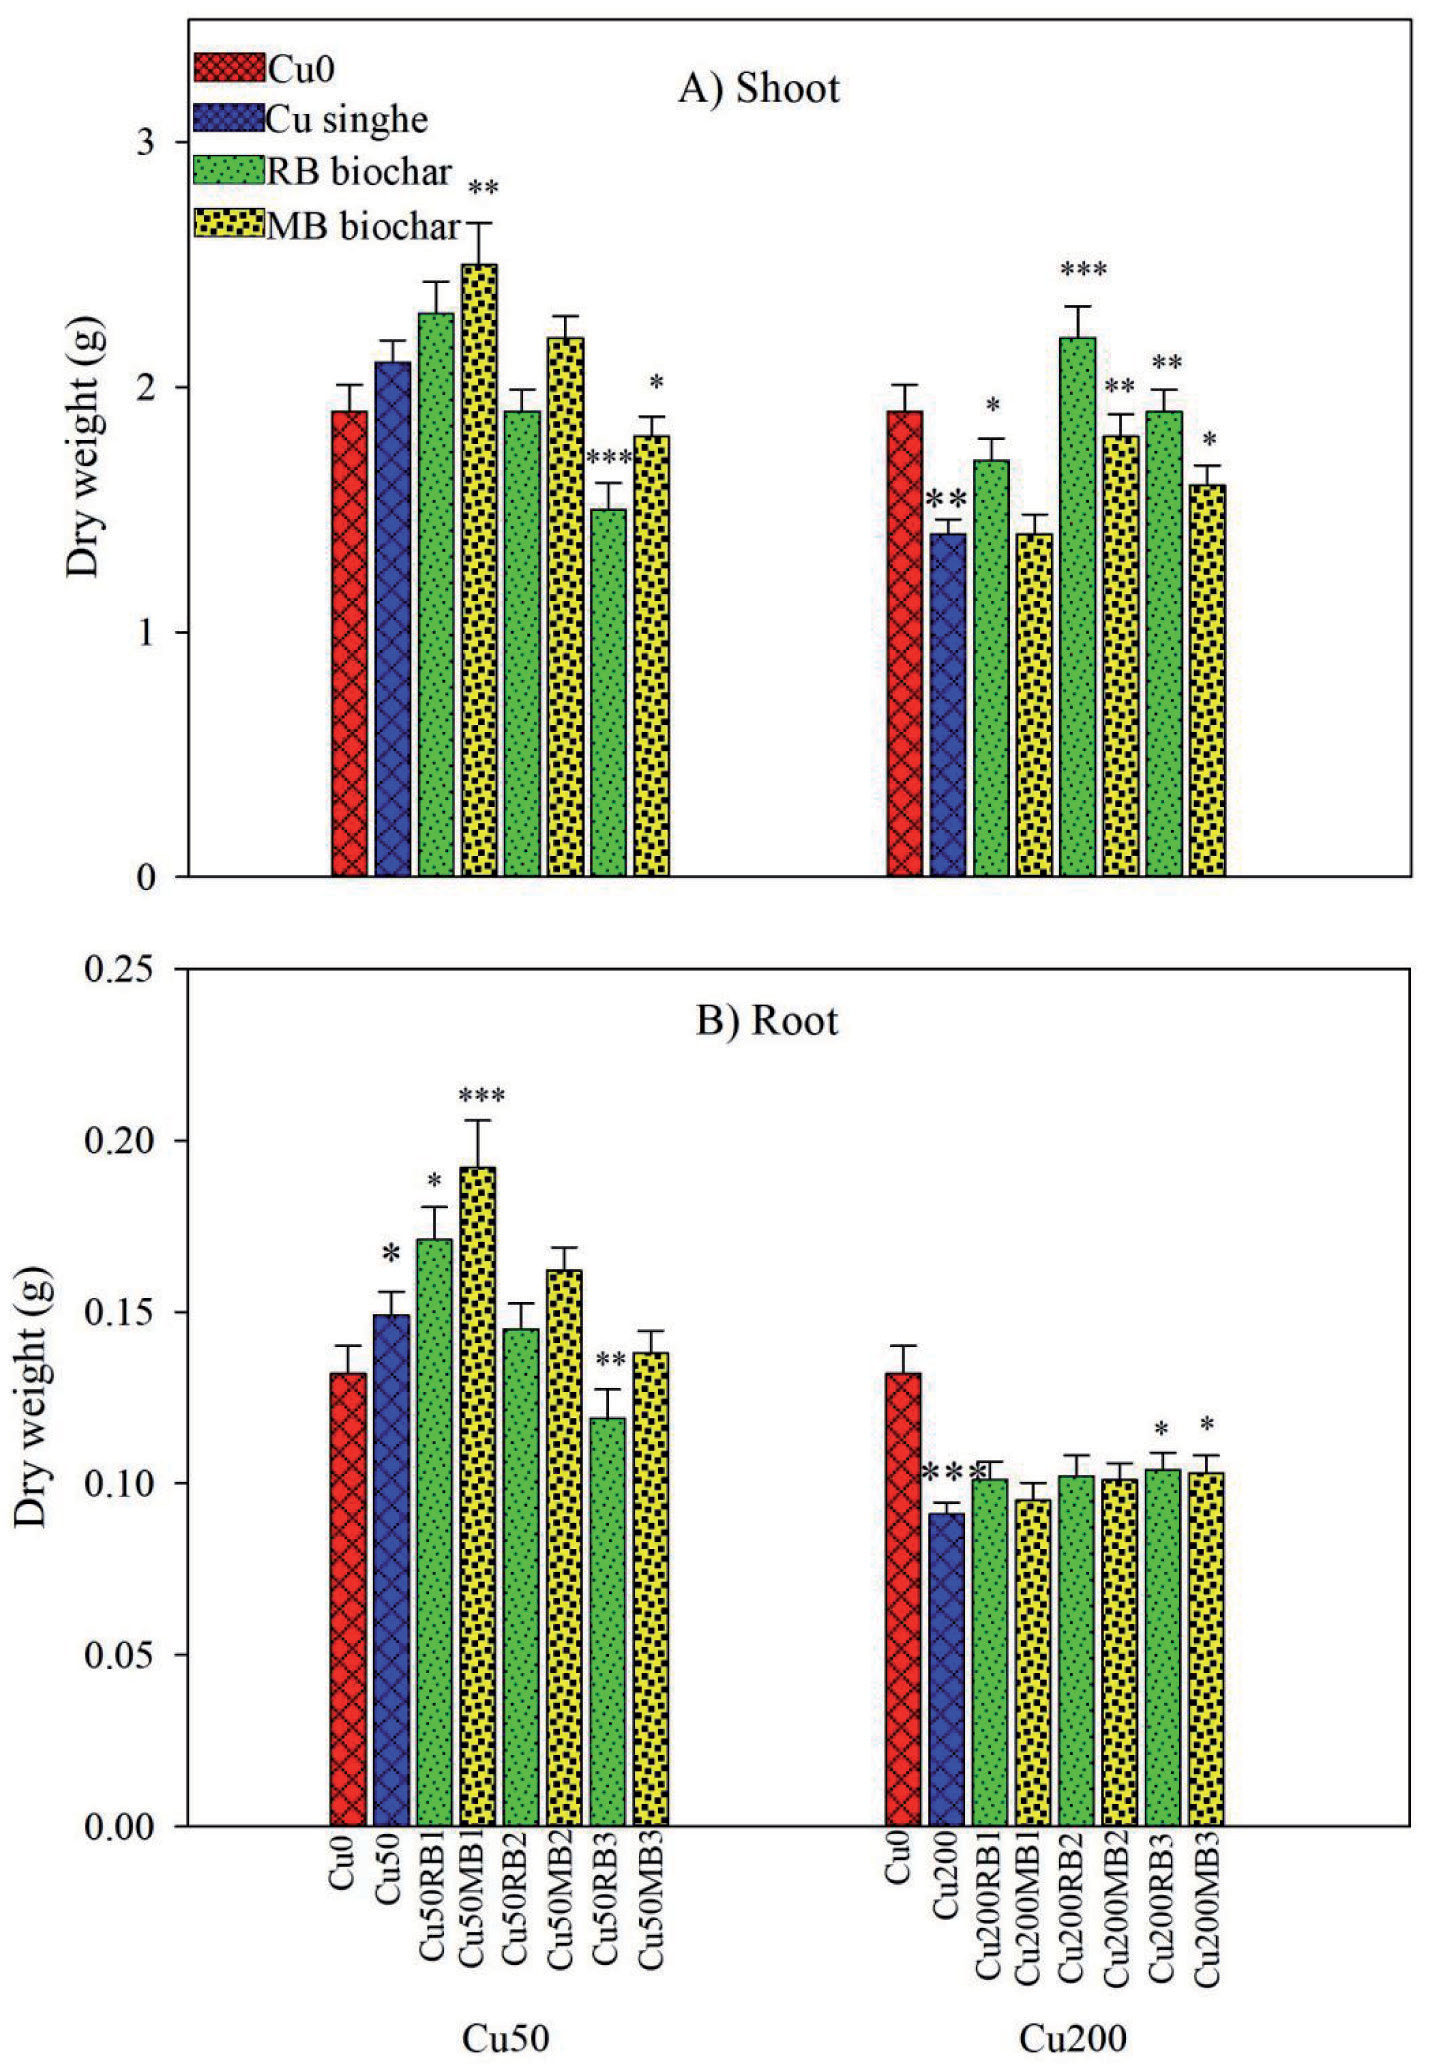
At low Cu concentrations (50 mg/kg), the lowest content of RB and MB biochar (1%) resulted in the highest increase in shoots and root dry weight of pak choi. The shoots and roots dry weight increased by 19.0% and 28.9% (P < 0.01) with MB biochar application and by 9.5% and 14.8% with RB biochar application, compared to single Cu treatments (Fig. 3). However, at medium and high biochar content (2% and 3%), the shoots and roots dry weight of pak choi significantly decreased. For MB biochar application, the shoots and roots dry weight decreased by 0%–14.3% and 0%–7.4%, while for RB biochar application, the decrease was 9.5%–28.6% (P < 0.001) and 2.7%–20.1% (P < 0.01) at medium and high biochar content, compared to low biochar content treatments (Fig. 3). These results indicate that MB biochar application is more effective in promoting the growth of pak choi than RB biochar application at low Cu concentrations (50 mg/kg). Furthermore, a low content of RB and MB biochar (1%) is most suitable for reducing Cu concentration in plants and improving plant growth in non-contaminated Cu soil.
At high Cu concentrations (200 mg/kg), the shoot dry weight of pak choi increased with both RB and MB biochar amendments compared to single Cu treatments. However, treatments with 2% biochar content showed significantly higher shoot dry weights compared to treatments with 3% biochar content. Specifically, the RB biochar application at medium content (2%) resulted in a significant increase of 57.1% (P < 0.001) in shoot dry weight, while the MB biochar application only increased by 28.6% (P < 0.01) compared to single Cu treatments (Fig. 3). At low biochar content (1%), there was no change in the shoot dry weight of pak choi with MB biochar application (P > 0.05), but an increase of 21.4% (P < 0.05) was observed with RB biochar application (Fig. 3). These findings are consistent with the study by Awad et al., which found that the biomass of Brassica juncea plants significantly increased with the application of 2% biochar and decreased with higher application levels up to 6% [28]. Therefore, the medium content of RB and MB biochar (2%) is the most suitable for reducing Cu concentration in plants and improving plant growth in contaminated Cu soil. The RB biochar application demonstrated better performance in terms of shoot dry weight compared to the MB biochar application. However, the dry weight of the roots of pak choi was not significantly affected by increasing biochar contents compared to single Cu treatments. The response of root dry weight to increasing biochar application contents, particularly with MB biochar application, was minimal.
Fig. 3.
The dry weight of pak choi tissues: shoot (A), root (B). Data are presented as means±SD (n=3). Small stars indicate significant difference from no biochar (for all treatments), big stars indicate significant difference from no Cu (for only single Cu treatments) (Oneway ANOVA, followed by Dunnett’s test, * P < 0.05, ** P < 0.01, *** P < 0.001)
The increase in dry weight resulting from the application of biochar can be attributed to several factors. Firstly, biochar application can enhance the availability and uptake of nutrients in the soil [29], leading to improved plant growth. Secondly, biochar can reduce the bioavailability of heavy metals, including Cu, in the soil [30]. However, as the application level of biochar increases, the dry weight of plants may decrease. This decrease can be attributed to the increase in soil pH caused by biochar application, which can reduce nutrient availability and subsequently hinder plant growth [31]. The large surface area of biochar can adsorb available soil nutrients, leading to nutrient deficiencies and a decrease in the potential for plant growth [29].
It was found that MB biochar had a higher content of plant nutrients compared to RB biochar. However, RB biochar exhibited a more developed pore structure and a larger surface area (Table 2), leading to outperformance in terms of immobilizing Cu, reducing the bioaccumulation of Cu in pak choi, and promoting the growth of pak choi in the soil.
Correlation Between Various Cu Fractions in Soil, Cu Concentration in Pak Choi, and Pak Choi Growth
The results demonstrated significant positive correlations between Cu uptake by shoots and roots with the F1 and F2 fractions (R > 0.8, P < 0.01), while a significant negative correlation was observed with the F5 fraction (R > 0.7, P < 0.01). There was no significant correlation with the F4 and F3 fractions (R < 0.5, P > 0.05) (Table 3). The positive correlation between mobile Cu fractions and Cu concentration in the shoots and roots of pak choi indicated that the majority of Cu in plants is directly absorbed from the available fractions in the soil, and the mobile Cu fractions played a crucial role in Cu bioavailability. In comparison to the F5 fraction, the F3 and F4 fractions had a higher potential to become bioavailable fractions, serving as a potential nutrient pool for plants. However, the F3 and F4 fractions showed no significant correlation, likely due to the changes in the proportions of the F3 and F4 fractions being influenced by the organic matter content, pH, and clay minerals in the soils. Furthermore, the Cu concentrations in the shoots exhibited a significant positive correlation with the Cu concentrations in the roots (R > 0.9, P < 0.01), indicating that the Cu concentration accumulated in the shoots is transported from the roots of pak choi.
For the growth of pak choi, the dry weight of shoots and roots showed no significant correlation with the Cu fractions (R < 0.4, P > 0.05), except for the F5 fraction, which exhibited a significant correlation with dry weight shoots (R = 0.574, P < 0.05) (Table 3). Although the application of RB and MB biochar led to a reduction in mobile Cu fractions and Cu concentrations in pak choi, there was no correlation observed between these factors and plant growth. The lack of correlation between the tissue dry weight of pak choi and Cu fractions indicates that assessing the growth of pak choi may not be a reliable indicator for evaluating Cu contamination in soil. However, a significant negative correlation was found between the Cu concentration in plants and the dry weight of shoots (R > 0.5, P < 0.05), but no correlation was observed between the Cu concentration in plants and the dry weight of roots (R < 0.4, P > 0.05) (Table 3). This result contradicts an earlier report suggesting that Cu in roots displayed relatively good sensitivity to Cu pollution, while the aerial parts of plants may not directly reflect the phytotoxicity of Cu [32]. These findings indicate that, apart from being influenced by Cu accumulation in roots, the growth of pak choi shoots is also affected by biochar properties and the physiological characteristics of the plant.
Table 3.
Correlation between copper fractions in soil with the uptake of copper by pak choi and pak choi growth
Conclusions
Biochar plays an important role in preventing Cu uptake by pak choi tissue at excessive concentrations. In contaminated Cu soil (200 mg/kg), the medium content of biochar (2%) is the most suitable for reducing Cu concentration in plants and improving pak choi growth, and RB biochar plays a more important role than MB biochar. In non-contaminated Cu soil (50 mg/ kg), a low content of biochar (1%) is most suitable for improving pak choi growth, and MB biochar application is more effective than RB biochar. Good correlations between the proportion of mobile Cu fractions and the Cu concentrations in plants indicated that they can all be used to predict Cu bioavailability in soil.

