

Introduction
Agricultural production is closely related to greenhouse gas emissions. Carbon emissions (CEs) from agricultural production account for about 30% of the total agricultural carbon emissions (ACEs) [1, 2]. It is estimated that ACEs in the United States and around the world respectively account for 9% and 11% of total CEs [3]. By contrast, in China, ACEs account for 15% of total CEs. This relatively high proportion will affect the realization of agricultural green development (AGD) goals. Compared to other industries, ACE reduction has stronger externalities, reducing other CEs, improving agricultural product quality, and providing high-quality ecological products. Agriculture in China is constrained by sparse, fragmented, and low-quality arable land. Yet food security is of the utmost importance to China. Historically, agricultural production in China aimed at maximizing output. It relied heavily on agricultural chemical inputs to increase land output. This has contributed to energy consumption and pollution of soils, leading to an increase in ACEs. Long-term human activities have brought about soil salinization and heavy metal pollution [4], and polluted soil is not conducive to plant growth [5], which will lead to a further increase in the application of agricultural chemicals and a further loss of soil organic carbon, which is not conducive to ACEs reduction. An important element of high-standard basic farmland (HSBF) construction is to improve the quality of soil through technology and other means. At the same time, China’s grain production has increased annually, which hides the unsustainability of production such as ACEs and pollution of farmland soils.
Many scholars have conducted in-depth studies on ACEs and their influencing factors. Some studies consider ACE calculation methods such as the inventory method of the United Nations Intergovernmental Panel on Climate Change [6, 7], the life-cycle assessment method [8], the input-output method, and the actual measurement method. The impact factors of ACEs are mainly concentrated in resources and the environment [9-11], population, economy [12-14], trade openness [15], agricultural structure [16], technological progress [17], and policies and institutions [18-22]. The basic consensus reached by researchers is that environmental regulation is essential for solving environmental pollution. Environmental regulation can reduce CEs, improve energy efficiency, and solve the externalities of environmental pollution. ACEs are scattered, unclear, and complex, and the effectiveness of environmental regulations is significantly reduced. However, China’s previous system of pollution control focused on industrial and urban pollution [19]. Besides ACEs are fragmented, unclear, and complex, making environmental regulations less effective. How can we achieve ACE reduction while ensuring food security? The construction of HSBF provides a viable option for achieving ACE reduction while ensuring food production.
Since 2011, China has been promoting a rural land consolidation policy (RLCP), with the construction of HSBF as its main component. HSBF is based on land leveling, fertile soil, concentrated and continuous plots, support facilities, rural equipment, sound ecology, strong resistance to disasters, and sustainable, high, and stable yields. Farmland has economic and social value, as well as ecological value. Strengthening farmland quality protection is conducive to improving the carbon sink function of farmland. Previous research on the construction of HSBF mainly focused on construction technology [23], the delimitation of the construction area, the construction sequence, and the suitability of the construction [24]. The performance evaluation of HSBF construction focuses on the safeguarding of food security, improved production conditions [25, 26], and the dimensions of economic benefits [27]. The ecological and environmental effects of relevant policies are primarily based on the land-use data of a single county or city, although few studies have focused on them at the national level to evaluate the construction of HSBF [28]. Some scholars have also evaluated the ACEs reduction effect of HSBF from the perspective of investment in comprehensive agricultural development [29-31], but without involving the spatial spillover effects of ACEs reduction, the existence of regional variability in resource endowments, economic development, agricultural structure, and technology, which may lead to spatial-temporal differences and the spatial dependence of ACEs [32]. The spatial effect of HSBF construction on ACEs cannot be ignored.
The construction of HSBF brings the flow of factors of production, agricultural factors of production will flow to the region with a high level of AGD, which can optimize the level of agricultural resource allocation in the region and promote the low-carbon development of agriculture. The region with a high level of AGD can have a demonstration effect on the neighboring regions, and the neighboring regions will drive their own low-carbon development of agriculture by imitating and learning from each other [33]. Otherwise, the quality and effectiveness of HSBF construction will be monitored and reviewed by the country, and the result will affect the next year’s construction funds. The construction of good results in the region will enable to obtain financial assistance, which can alleviate the financial pressure on the region [34]. Conversely, the construction of bad results in the region will lose funds, which, will undoubtedly bring serious financial pressure to the region. Therefore, in the process of HSBF construction, the local government’s construction of HSBF will be affected by the influence of the neighboring regions, and there may be the phenomenon of imitation competition. The spatial econometric model can elucidate the strategy interaction behavior of inter-regional HSBF construction. Specifically, the spatial econometric model first constructs the strategy interaction model using the reflective function to depict the HSBF construction behavior of other regions with competitive relationships, and the coefficient of the spatial lag reflects whether there exists strategy interaction behavior between regions. Whereas HSBF construction was introduced in 2011, the heterogeneity of implementation years and regions allows the policy to be considered a quasi-natural experiment. One implicit assumption in the difference-in-differences (DID) model is that either individual in the aggregate is not affected by whether other individuals receive the treatment or not (SUTVA) [35], ruling out interactions between regions. According to the previous analyses, policy shocks received in the region may have implications for other regions. The spatial DID model extends the measurement of HSBF policy based on the DID model to the spatial DID model under the relaxation of the SUTVA assumption, which not only estimates the impact of RLCP policy on individual pilot regions, but also is able to test the spatial effect of the policy, enhancing the reliability of the conclusions.
In this paper, we consider the implementation of the rural land consolidation policy (RLCP) as a quasi-natural experiment. We apply the DID and spatial DID (SDID) models to test CE reductions and their spatial spillover effects and mechanisms. Our results can serve as a reference for the formulation of ACEs policies.
Materials and Methods
Historical Evolution of RLCP
RLCP is divided into three stages. Exploration stage (1988-2010). According to the Law of the People’s Republic of China on Land Administration in 1987, the government at all levels should protect arable land, safeguard drainage and irrigation projects, improve soil fertility, and combat land desertification and soil erosion. In 1988, the State Council set up a fund for land development and construction and began the exploration of renovating and transforming medium-low yield fields. During this period, the main goal of the policy was to develop and utilize the land to achieve stable growth in food production and the comprehensive and coordinated development of agriculture. However, since relevant government departments have not formed special documents to clarify the construction standards, content, and tasks in HSBF, land development lacks unified planning and management, with deforestation and reclamation of lakes and land. This has damaged the ecological environment and affected the sustainable utilization of land resources.
Normative implementation stage (2011-2018). The main task of this section of the RLCP was the construction of HSBF, aiming to stabilize the amount of farmland, improve the quality of farmland, and protect the ecosystem. The National Land Remediation Plan (2011-2015) issued in 2011 defined the standards and main tasks of HSBF, and large-scale construction of HSBF for drought and flood protection was carried out. By 2015, 400 million mu of HSBF for drought and flood protection had been built. The local government also issued corresponding plans, providing institutional guarantees for the construction of HSBF nationwide. Subsequently, the National HSBF Master Plan (2011-2020) considered agriculture, water conservancy, land, forestry, electricity, meteorology, and other factors, covering specific operational measures such as field remediation, soil improvement, irrigation and drainage facilities, the improvement of farmland protection and ecological environment, agricultural science and technology services, and the renovation of field roads. Although the planning period was 2011-2020, after reforms to the construction organization in 2018, the construction of farmland changed from being led by several departments to being led by a single administration, and the content and direction of the construction changed substantially.
The third section began in 2019 and extends to 2030. The National HSBF Plan (2021-2030) puts forward new requirements for the next stage of HSBF construction, namely, strengthening quality control, building according to local conditions, integrating regional farmland resources, and promoting continual construction.
Impact of RLCP on ACEs
The greenhouse effect is a global environmental pollution problem. In order to reduce CEs, countries around the world are making efforts toward energy conservation and CE reduction. The agriculture sector is the second-largest carbon source, inferior to the industry sector. China feeds 21% of the world’s population with only 7% farmland. Its total grain output has increased from 113 to 669 million tons from 1949 to 2020. But for a long time in the past, China’s environmental protection policy of CE reduction was based on industry. With the negative externalities of ACEs becoming more obvious, relevant departments have gradually realized the harmfulness of ACEs. HSBF construction provides a feasible scheme to realize ACE reduction while ensuring food security. HSBF construction policies affect ACEs by improving soil quality and water resource utilization efficiency (WRUE).
Soil Quality Improvement and ACE Reduction
Agriculture is generally regarded as the curse of ecological protection [36]. Agricultural production leads to the loss of wildlife habitat [37] and some regulatory services, such as carbon storage or soil erosion control [38]. Farmland soil carbon storage accounts for 8%-10% of land soil carbon storage. Because of natural factors and agricultural production activities, farmland soil is in a process of constant change. Long-term traditional farming combined with the overuse of agricultural chemicals degrades soil organic carbon storage [39]. The loss of soil organic carbon causes CEs resulting from the oxidation of the organic carbon after farming [40]. Some studies have shown that about 60%-70% of the above loss can be refixed, and the soil carbon pool can be increased by 0.4-0.9 PgC every year for 50 years, as estimated by the IPCC, with the aid of appropriate management measures. The cumulative increase in the oil carbon pool is 24-43 PgC [41]. HSBF involves better soil texture through soil improvements, increasing the thickness of the farmland tillage layer, ameliorating the soil and soil fertility by adopting agronomic, biological, and other measures, and promoting the content of soil organic matter by applying farmyard manure and returning straw to the field. Adding organic matter improves soil carbon status and sequestration, as well as soil quality [42]. In addition, through the promotion of conservation tillage, the saline alkaline soil, acidified soil, and heavy metal-contaminated soil can be controlled, the soil’s physical and chemical characteristics in the tillage layer can be improved, and soil pH can be maintained at 5.5- 7.5. The improvement of soil quality enhanced carbon sequestration on farmland and reduced ACEs. Moreover, soil improvement and soil fertility make farmland fertile, which reduces the application of fertilizer to a certain extent and promotes ACE reduction.
WRUE and ACE Reduction
China’s water resource scarcity and uneven spatial allocation of water resources. The HSBF construction policy also focuses on constructing agricultural water facilities and promoting water-saving irrigation technology. Nearly half of the farmland in China is without irrigation water or conditions, but the irrigation in some areas is flood irrigation, which seriously wastes water resources. Agriculture production activities both contribute to and are easily influenced by climate change [43]. The increase in climate extremes such as drought, heavy precipitation, and tropical cyclones has a huge impact on agricultural production and universal life. Climate change contributes to the increased probability and intensity of drought [44]. Drought causes food loss and affects food security. For areas with irrigation facilities, irrigated and non-irrigated farmland affects the unit grain yield, which is 1.67-1.89 times higher for wheat and 1.47-1.53 times higher for corn. Irrigation is crucial for stabilizing grain yields. China’s agricultural water supply accounts for 60%-70% of the total water supply [45]. Due to the growing demand for water, this results in a lack of surface water and the depletion of groundwater. CEs from the development and utilization of water resources are an important part of ACEs. CEs from irrigation account for about 22% of the total CEs from agricultural production [46]. Improving the WRUE can reduce the excessive consumption of water resources and CEs. Water-saving irrigation can reduce water consumption and improve the WRUE to reduce ACEs.
In view of the aforesaid analysis, we propose the following hypotheses: H1: The implementation of RLCP can reduce ACEs. H2: RLCP reduces ACEs by improving soil quality and WRUE.
RLCP Has a Spatial Spillover Effect on ACE Reduction
According to the first law of geography, there is a connection between things and their surroundings, and the closer they are, the stronger the connection. Such spatial effects are common in economic and social life. As a pollutant, ACEs have a significant spatial correlation. Environmental pollutants usually have the feature of inter-regional diffusion, and areas close to geographical space easily accumulate pollution. Regions with high ACEs have an impact on the environment for agricultural production in the local region and have a spatial spillover effect on the surrounding regions. On the one hand, the allocation of agricultural resources in surrounding regions is affected by the flow of agricultural production factors. The flow of agricultural production factors to regions with high levels of AGD can optimize the allocation of agricultural resources in the region and promote ACE reduction. On the other hand, regions with higher levels of AGD can produce demonstrative and competitive effects on surrounding regions, and regions with lower levels can imitate and learn from areas with higher levels.
HSBF is a national construction project relating to food security. The quality and effectiveness of the construction will be assessed by the Ministry of Land and Resources and other relevant national departments. Furthermore, the assessment results will be linked to the funding arrangement of the central government for the construction of HSBF next year and included in the assessment of the objectives of local governments at all levels for farmland protection. For their own interests, local governments may imitate and compete with each other [47] in the procedure of formulating and practicing construction plans. The construction of HSBF in one region will also be affected by the surrounding areas. In response to the above analysis, we propose the hypothesis: H3: The impact of RLCP on ACEs has a spatial spillover effect.
Research Methods
DID Model
The DID model is the main method to estimate policy effects. The construction of HSBF is the most important element of the second phase of RLCP. HSBF was implemented nationwide in 2011, focusing on the major grain-producing regions and giving due consideration to other regions. Therefore, in different periods of the policy’s implementation, HSBF in each province differed in size and progress. The implementation year and regional heterogeneity of HSBF are such that RLCP can be regarded as a quasi-natural experiment. Here, we use the DID model to estimate ACEs resulting from RLCP. We use the identification strategy of continuous DID and the continuous variable of the “HSBF area ratio” to differentiate the experimental group (samples with a high HSBF area ratio) from the control group (samples with a low HSBF area ratio).
The continuous DID model is formulated as follows [48]:
Where
SDID Model
The implicit identified assumption of the DID method is that any individual in the collectivity will not be influenced by other individuals receiving the treatment (the stable unit treatment value assumption, SUTVA). This excludes the interaction between individuals and strictly assumes that individuals are independent of each other [49]. However, in the case of the RLCP, regions are subject to spillover effects. Due to the violation of the SUTVA hypothesis, the measurement method of the RLCP effect based on the SDID method needs to be further expanded. Contrary to the DID model, the SDID model relaxes the SUTVA hypothesis and considers the spatial spillover effects of RLCP.
The DID model can only evaluate the impact of RLCP on individual pilot regions. It ignores the test of spatial spillover effects, diminishing the robustness and authenticity of the results. Therefore, we constructed a SDID model to research the impact of RLCP on ACEs. The SDID model [50] can be expressed as follows:
Where
There are three spatial econometric models commonly used to estimate SDID models, namely the spatial Durbin model (SDM), the spatial autoregressive model (SAR), and the spatial error model (SEM). The SDM model can be simplified into SAR and SEM, and the most suitable model can be determined by a likelihood ratio (LR) test and the Wald test [51]. The SWM is the spatial distance between regions. According to the first law of geography, the spatial distance can also reflect the degree of interdependence between regions, which is the basis of spatial econometric analysis. According to the aims of our study, we established three SWMs for analysis:
(1) Adjacency SWM. Using the rook adjacency method, if there is an adjacent boundary between regions, the value is 1. That is
(2) Geographic distance SWM. The distance between two regions in the SWM is calculated by the reciprocal of the distance
(3) A nested SWM may be the result of the combined effect of two spatial forces: geographical proximity and economic correlation. This is an economic and distance SWM because of the spatial association effect between provinces through the flow of agricultural production factors, labor mobility, and the strategic interaction between local governments. The economic SWM builds a SWM according to the inverse of the difference in GDP per capita:
Spatial Correlation
Before establishing the SDID model, it is necessary to use Moran’s I to analyze the spatial correlation of ACEs as the basis for evaluating the spatial spillover effects of RLCP policies:
where
Data Sources
Explained variable: ACEs. We considered the planting industry as the research object. ACEs were estimated with statistical data. The sources of ACEs are numerous and complex. Referring to the existing literature, the sources of ACEs mainly include the use of agricultural chemicals, the consumption of fossil fuels by agricultural machinery, indirect emissions caused by the consumption of electric energy by agricultural irrigation, and the loss of organic carbon caused by tillaging. The specific calculation method of ACEs is to multiply the six carbon emission sources of fertilizer, pesticide, agricultural film, agricultural diesel, tillage, and agricultural irrigation by the corresponding CEs coefficient [7].
Core explanatory variables. DID is expressed by the cross-product of the HSBF area ratio and the dummy variable at the time of RLCP policy implementation (
Control variables. (1) Economic factors are important factors affecting ACEs [12]. Regional economic development level (Eco): measured by per capita regional gross domestic product. Considering that ACEs and economic development may follow Kuznets’s environmental theory, we added the square of Eco to the model. Urbanization level (Urban): characterized by the proportion of urban population in the total population. Regional marketization level (Market): calculated using the total imports and exports of regional goods. (2) The income level of rural residents (Income): measured using the per capita net income of rural households. (3) The number of agricultural laborers (Labor): calculated using the number of employees in agriculture. This indicator can reflect the endowment of agricultural labor resources. (4) The planting structure (Plant): measures the proportion of the grain planting area. (5) The level of agricultural mechanization (Mech): measured using the total power of agricultural machinery. (6) The situation of agricultural disasters (Agdis) is used to control the impact of crop disasters. (7) Regarding climate change. We selected the annual average temperature (Tem) and annual average rainfall (Rain) to control for the impact of climate change on ACEs.
Mechanism variables. According to previous theoretical analysis, we selected soil quality (Soi) and the WRUE as mechanism variables. Limited by the availability of data, large-scale soil survey data at the national level were collected from the Second National Soil Survey from 1978 to 1979. We used the area of soil erosion control as a proxy variable for soil quality. The erosion and destruction of the soil arable layer degrade soil fertility over time. The soil quality can be effectively improved by controlling soil erosion by technical means. The water-saving irrigation area was used as a proxy for the WRUE. The key to improving the WRUE is to improve the efficiency of water transmission and distribution. Water-saving irrigation can improve the efficiency of water transmission and distribution, thus improving the WRUE.
Table 1 shows the descriptive statistics of variables.
Results
Spatial Correlation Analysis and Parallel Trend Test of ACEs
Moran’s I of ACEs
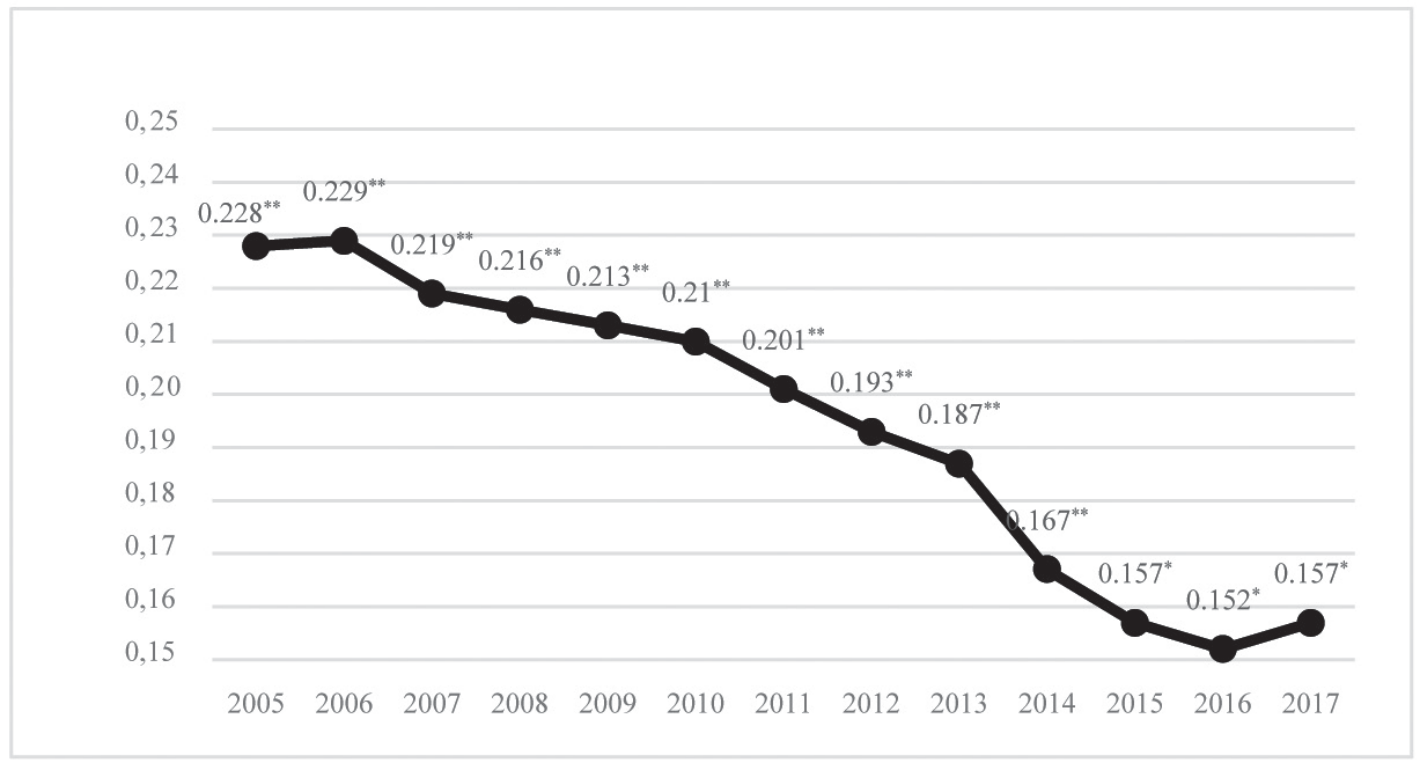
Before using the SDID model for empirical analysis, it is essential to prove the spatial correlation of ACEs. The global Moran’s I was calculated by the adjacency SWM (Fig. 1). We found that the global Moran’s I is significantly greater than 0, indicating that ACEs show significant spatial correlation characteristics. In addition, it showed a downward trend since 2006, a slow rise since 2016, and a slow downward trend in general. This means the spatial correlation of ACEs has gradually weakened from 2005 to 2017. Therefore, we constructed a SDID model for analysis.
Parallel Trend Testing
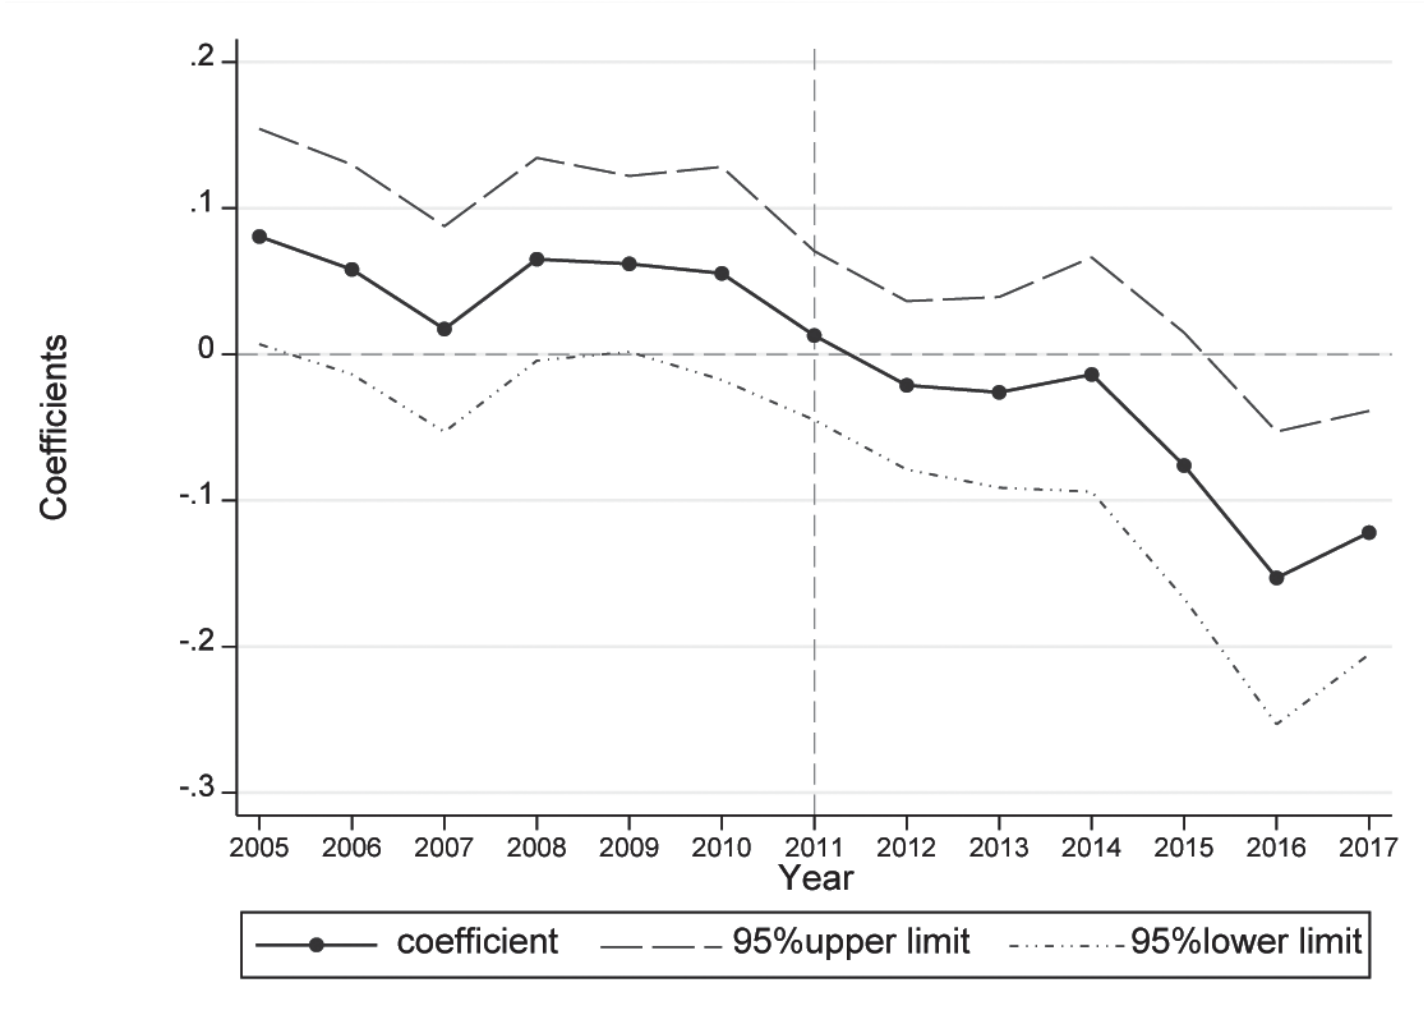
A fundamental assumption with the SDID model is that before the RLCP policy, ACEs in non-pilot areas and pilot areas had the same trend of change. Consequently, we used the event study method to verify whether this assumption was broken. Referring to existing research [52], we used the event study method to verify the dynamic effects of RLCP policy. Specifically, we replaced the DID variable in the benchmark regression with dummy variables representing several years before and after the implementation of RLCP and tested the parallel trend assumption based on the following equation:
Table 1.
Descriptive statistics
where DIDkit is a variable of the RLCP policy. Since the relevant data were updated to 2017, the data years after the implementation of the RLCP in the sample only include the six years from 2011-2017. Therefore, the threshold value of the virtual variable is set to 6. Let Si be the implementation year of the RLCP policy, where
Effects and Spatial Spillover Analysis of the RLCP
Benchmark Model
RLCP had a negative impact on the total ACEs (Table 2), and the results were significant at the 1% level (Model 1). The coefficient of DID is -0.050, indicating that the implementation of the RLCP policy suppressed 5% of ACEs and had significant environmental effects. After that, the SDID was used for estimates. SWMs are the foundation of spatial econometric analysis, and different settings of weight matrices lead to different results, affecting the robustness of empirical analysis. We used adjacency weight matrices, geographic distance matrices, and geographic and economic distance nested matrices for spatial econometric analysis. We used the Lagrange multiplier (LM) test, the Hausman test, the LR test, and the Wald test to confirm the specific form of SDID. (1) Based on the LM and robust LM statistics, we inspected whether the SAR or SEM model was selected. If the LM test demonstrates that the model has spatial effects, they can be directly estimated using a more general SDM. (2) The Hausman test results were used to choose whether to use fixed or random effects. (3) We used the LR test to confirm whether the SDM contains time or spatial fixed effects. (4) Wald’s test was used to determine whether the SDM model would degenerate into the SAR or SEM model. According to the test results, we selected the SDM model with time and spatial fixed effects.
Models (2) to (4) demonstrate the estimation of the SDID model. It can be seen that the estimation results of the SDID model under the three SWMs are relatively consistent, indicating that the SDID model is relatively robust and trustworthy. The coefficients of DID are all negative, and they all pass the 1% significance test under the three SWMs. The results indicate that the RLCP has a significantly positive impact on ACEs. The coefficient of WDID is also negative, and it is uniform at the 5% significance level, demonstrating that the construction of RLCP may have a negative spatial spillover effect on ACEs and that the construction of RLCP in neighboring regions had a demonstrative effect on the region. Elhorst [53] specified that when global interaction effects are included in the model set, the point estimation results of the spatial econometric model do not typify the marginal impact of the independent variables. Accordingly, in order to compare and analyze the heterogeneity in the effect of each independent variable and its spatial spillover effects, it is essential to further calculate the direct and indirect effects of each independent variable based on the point estimation of the model.
Table 2.
Benchmark model estimation results
Direct and Indirect Effects of RLCP
As mentioned above, there is a spatial dependence of ACEs in various provinces. In virtue of the existence of global interaction effects in the SDM, the coefficient of the DID variable cannot directly calculate its impact on ACEs. For the sake of better revealing the impact of RLCP on ACEs, this section decomposes the spatial effects, including the direct and indirect effects of RLCP on ACEs (Table 3). The coefficients of RLCP policy’s direct effects are negative under the three SWMs, with impact coefficients of -0.048, -0.071, and -0.052. The coefficients are all at the 1% significance level, proving that RLCP policies had a significant inhibitory effect on ACEs in the region and thus verifying hypothesis H1. RLCP promotes the rational use of land resources and the optimization and improvement of the land use structure. In order to increase production and income, agricultural operators unreasonably apply a large number of chemicals, such as fertilizers, resulting in increasingly barren land fertility and increasingly hardened plots. Due to resource endowments and technical constraints, individual farmers are unable to effectively improve soil quality, because poor soil fertility results in a large amount of chemical products being applied, falling into a cycle of increased poverty. RLCP can repair damaged cultivation layers through agronomic and biological means, improving the content of soil organic matter, thereby improving land quality, and promoting the reduced use of chemicals by agricultural operators to reduce carbon emissions. Moreover, the promotion of organic fertilizer and soil testing formula fertilization during construction plays a demonstrative role, guiding agricultural operators to rationally utilize land resources and scientifically input agricultural production factors to reduce ACEs. Due to factors such as climate change and irrational land use, water and soil erosion are relatively typical. In 2020, the area of water and soil loss reached 2.6927 million square kilometers, resulting in the loss of land productivity, siltation of watercourses, and pollution of water quality. The annual loss of nitrogen, phosphorus, and potassium fertilizers also caused enormous economic and ecological losses.
The indirect effects of the DID variable have a significantly negative impact under the three SWMs, indicating that RLCP policy can inhibit ACEs in surrounding regions and that the construction of RLCP not only directly affects ACEs in the local region, but also significantly inhibits ACEs in other regions through spatial spillover effects. Hypothesis H3 is thus verified. Compared to the adjacent SWM, the indirect effects of RLCP policy under the geographical distance SWM and the nested SWM are higher, indicating that policies in regions with closer geographical and economic distances generate more spatial spillover effects. The construction of RLCP also promotes the flow of productive factors such as technology, and it promotes the optimization of agricultural resource allocation in surrounding regions as well as ACE reduction. Regions with high levels of AGD can have demonstrative and competitive effects on surrounding regions. Regions with low levels of AGD can imitate and learn from regions with high levels of AGD, promoting the agricultural green transformation of the region. On the one hand, in the process of constructing the RLCP, there has been a gradual shift towards a green and ecological approach to farmland construction, shifting from a focus on production to one that emphasizes production and ecology equally.
Table 3.
Decomposed Effects of the SDID model
The direct effect of Eco on ACEs has a negative and significant impact under the three SWMs, indicating that regional economic development can suppress local ACEs, while the indirect impact of Eco on ACEs is positive and significant. The development of the regional economy promoted an increase in ACEs in neighboring provinces. The higher the level of economic development in a region, the more the public will increase demand for agricultural green food. This motivates agricultural operators to use greener and more environmentally friendly production methods and reduce ACEs. The direct, indirect, and total effects of the market variable on ACEs are significantly negative, indicating that regional marketization promotes the reduction of ACEs. The direct and indirect effects of the Mech variable on ACEs are significantly positive, illustrating that the Mech promoted local ACEs, while the cross-regional operation of agricultural machinery also promoted ACEs in surrounding regions. The direct effect of the Income variable on ACEs is positive and significant. One reason for this is that the increase in farmers’ income mainly came from an increase in non-agricultural income, while non-agricultural industrialization led to a disorderly increase in agricultural chemicals.
Robustness Check
Set Virtual the Time of RLCP Policy
Previously, we stipulated a binary dummy variable of 2011 as the RLCP policy time point. For the sake of robustness, we randomly selected the years 2007 and 2008 as the time of the RLCP policy for placebo estimations. As shown in columns 1 and 2 in Table 4, when 2007 and 2008 are taken as the RLCP policy time points, the coefficients of the DID variable are -0.013 and -0.014 and not significant, indicating that the policy time points are not random and that the estimated results are reliable.
Eliminate Other Policy Interference
After the New Development Concept was proposed in 2015, with “green” as one of the five major development concepts, the concept gradually permeated the agricultural field. In particular, corresponding agricultural policies such as the zero-growth action of fertilizer and pesticide and the reduction and efficiency of fertilizer and pesticide (as proposed in 2015) inevitably had an impact on ACEs. Therefore, we excluded samples from 2015 and beyond to eliminate the impact of other policies.
Discussion
We took the Qinling-Huaihe River line as the boundary to divide the south and the north and as the boundary between dry farming and paddy fields. It is also the boundary between subtropical and warm temperate zones, with a nearly coinciding January average temperature isotherm of 0°C. There are significant differences between the north and south of the Qinling-Huaihe river line in terms of the natural environment and farming methods. We estimated the samples from the south and the north, and the results are shown in Table 5. It can be seen that the RLCP in the southern region not only had a direct negative spillover effect on ACEs, but also had a negative spatial spillover effect, which was significant at the 5% and 1% levels, respectively. The northern region had a significant direct inhibitory effect, but the spatial spillover effect was positive and not significant. Limited by the natural resources of the north and south and the Qinling-Huaihe river, the area north of the river has relatively few water resources, accounting for only 18.28% of the total water resources of the country. However, the main grain producing region is in the north, accounting for 59.2% of the total national production. The northward migration of grain cultivation increased environmental pressure on grain cultivation in the north, leading to agricultural pollution from the so-called beggar-thy-neighbor phenomenon. The southern region has abundant light and heat conditions suitable for crop growth. However, compared to the northern region, the southern region is more hilly and mountainous, with fragmented agricultural land. The construction of RLCP has, to some extent, made up for this defect. Through land leveling, the degree of soil fragmentation has improved. Due to factors such as unreasonable land use, water, and soil loss are relatively common. HSBF construction can have a spillover effect on surrounding areas, especially in upstream areas.
Table 5.
Physical geographic heterogeneity
The empirical results of the previous section verified that RLCP had significant carbon reduction effects (Table 6). Theoretical analysis showed that the RLCP affects ACEs by improving soil quality and WURE. This section examines the inherent mechanism of HSBF construction on ACEs. Model 1 shows that the direct, indirect, and total effects of RLCP policies on soil quality are significant, indicating that the construction of RLCP policy has a facilitating effect on local and surrounding farmland soil quality. Model 2 shows that the direct, indirect, and total effects of farmland soil quality on ACEs are negative, but the indirect effects are not significant, indicating that farmland soil quality can inhibit ACEs in local regions, but has a limited impact on ACEs in surrounding regions. Model 3 shows that the direct effect of RLCP construction on WURE is significantly positive, indicating that RLCP policies have promoted the improvement of WURE in the region. In model 4, the WURE has a significant impact on the indirect and total effects of ACEs. The WURE can promote ACEs in surrounding areas and various regions. The impact of the WURE on ACEs has externalities, but the construction of the RLCP policy can only improve the WURE. Hypothesis H2 is thus partially validated.
Conclusions
This paper uses SDM to empirically analyze data on RLCP policy in 31 provinces of China, aiming to explore the impact and spatial effect of HSBF construction on ACEs. The following conclusions can be drawn:
(1) The RLCP policy has a significant inhibiting effect on ACEs in the region and can have a negative spillover effect on ACEs in neighboring regions. The implementation of the policy has resulted in continuous suppression of ACEs. In the first three years, the impact of the RLCP policy on ACE reduction was small. In the fourth year, the impact was greater, but in the fifth year, it lessened again.
(2) RLCP in the south and north had a profound negative impact on ACEs, but the spatial spillover effects in the north were positive and not significant.
(3) When analyzing the mechanism of RLCP, we found that improving soil quality and the WURE were mechanism variables.
Based on our conclusions, the following policy recommendations can be made:
Table 6.
Mechanism analysis regression results
(1) The government should attach importance to the spatial effects of HSBF construction, strengthen the flow of production factors, and exchange experience in HSBF construction between regions with a view to achieving regional synergy of HSBF construction on ACE reduction. Cross-regional technology exchanges and knowledge spillovers might be hampered by the existence of administrative boundaries, and RLCP projects should focus on strengthening inter-regional links and facilitating the diffusion of factors of production, technology, and other spillover channels.
(2) The effectiveness of the construction of HSBF should be effectively regulated, and construction should be carried out in compliance with national standards. As construction progresses, there are fewer and fewer plots of land that are prone to construction, and the difficulty of construction increases. According to our interviews with several people in the relevant departments of the Department of Agriculture, they found that the acceptance criteria for the construction of HSBF in some areas have not been carried out in full accordance with the standards.
(3) The government should promote RLCP projects in accordance with local conditions. In the northern region, where there is a mismatch between water supply and demand, with supply falling short of demand, it should continue to vigorously develop water-saving irrigation techniques and the construction of shelter forests to promote the economical use of water resources and the conservation of water sources, and to promote the improvement of agricultural production efficiency and the reduction of agricultural chemicals, as well as the reduction of CEs. And the southern region has sufficient water and heat conditions, but is mountainous and hilly. As the allocation of China’s land is based on the equalization system, and there are good and bad parts of the land, the equalization has induced serious land fragmentation, and it should continue to promote the reform of land property rights and the transfer of land. The government should promote the construction of HSBF to promote land leveling and consolidation and to promote large-scale agricultural operations and scale efficiency.
Of course, there are some limitations to this paper. Firstly, because of the reform of the construction institutions and the non-disclosure of statistical data, we have contacted the officials in relevant departments of the Department of Agriculture many times and could not obtain the data of the third stage. There is also a possibility that the statistical calibre after 2018 is different from that of 2017 and this paper mainly researches the second stage of the RLCP, and does not track the latest development for the third stage. This paper is a study based on macro provincial data and does not observe how micro farmers will affect their agricultural production behaviors in the context of RLCP, and thus how it will contribute to ACE reduction, which is still worth exploring in the future.

