

Introduction
Background and Motivation
In this day and age, climate change has grown to be a significant worry. Empirical evidence overwhelmingly confirms that carbon emissions (CE) are the primary cause of climate change [1]. The IEA reported that global energy-related CE reached a new high of over 36.8 billion tons in 2022. Energy consumption and CE have grown rapidly over the past 40 years in China. The economy’s rapid advancement has resulted in a steady rise in CE [2], resulting in an annual CE of more than 6 billion tons [3]. According to the IEA’s CO2 Emissions in 2022 publication, China’s CE was 11477 million tons in 2022. To address the climate challenge, the entire world has been called upon by the UN to take immediate action [4]. Nearly 200 nations worldwide, including China, signed the Paris Agreement in 2015. Reducing CE has become a major concern for society [5], and it has also become a global issue related to the sustainable development of the world economy [6]. Against this background, we need to explore a low-carbon development path that suits our national conditions.
To enhance energy efficiency [7], accelerating industrial restructuring [8] is a recommended method for reducing CE. Industrial convergence can realize industrial structural adjustment and is an inevitable trend of industrial system modernization [9]. It requires the mutual interpenetration and extension of knowledge, application, technology, and other aspects among different industries [10] and a new industrial form. Currently, the convergence of the digital and energy industries (CDIEI), has gained the attention of researchers [11]. The digital industry itself, as a new strategic industry, can achieve green development. With the CDIEI a role for the digital industry in the energy field is becoming increasingly prominent. Firstly, the digital industry can directly participate in the low-carbon process of energy, thereby reducing CE. Secondly, it can improve energy utilization efficiency and reduce energy consumption. Thirdly, it can also optimize the energy structure, reduce energy pollution, and improve environmental quality. The energy industry can also provide high-quality energy security for the development of the digital industry. The deep CDIEI is a trend, and the convergence of the two helps the energy industry gradually exhibit green, digital, and intelligent attributes. Achieving low-carbon goals is the core goal of the CDIEI. Meanwhile, the NEA pointed out the need to strengthen the construction of new infrastructure that converges traditional energy and digital intelligent technology, unleashes the potential for value in energy data elements, and provides strong support for actively and steadily promoting carbon peak and carbon neutrality. This requires promoting the CDIEI. Therefore, modern industrial systems must be constructed, and the industrial development model must be modified in order to lower CE. Promoting the CDIEI is an inevitable choice for China to fulfill its low-carbon targets.
Literature Review
Research on Industrial Convergence
Convergence is the process by which technological services and industrial structures evolve [12]. It occurs when innovation takes place at the intersection of established industries with clear boundaries. The resulting technologies and products generate new applications within their respective industries [13]. The convergence between industries is the gradual weakening of industry borders, and the convergence with other industrial functions helps create new industries that weren’t previously available, in addition to helping to restructure the industrial structure [14]. There are two categories into which the literature on industrial convergence can be subdivided. The first category is research on the CDIEI, Wang et al. [11] used principal component analysis to calculate the degree of convergence between China’s overall and regional digital and energy industries from 2002 to 2018 and, based on this, studied the influencing factors of the convergence development of the two industries. The results indicate that the convergence level of China’s digital and energy industries is on the rise. Chen et al. [15] used the entropy weight method to measure the development level of China’s energy industry and digital economy and used a coupled coordination model to measure the degree of energy digitization. Through the use of methods like kernel density analysis, the changing features of China’s energy digitization were examined. The results showed that the current energy digitization is in a barely coordinated state. The second category is research on the convergence of other industries. Dong et al. [16] used a spatial econometric model to investigate the effect of China’s manufacturing and productive services convergence on green development efficiency. The two have a positive relationship with each other. Cao et al. [10] looked at how different stages of industrial convergence affected China’s metabolic efficiency and found that while industrial convergence generally has a positive influence on metabolism, its driving force changes depending on the level at which it occurs. Zhou et al. [17] analyzed how China’s digital and automobile industries were convergent. The automotive and digital industries in China are tightly connected, with 2018 being an important turning point for the two industries from disjointed to coordinated. Dong et al. [9] empirically investigated how China’s 2001-2014 convergence in the information industry had an impact on the manufacturing sector’s high-quality development, and it was discovered that industrial convergence helped the sector’s increase in energy efficiency. Technological innovation can indirectly improve energy efficiency through industrial convergence.
In terms of measuring industrial convergence, the following four approaches are commonly used in the existing literature: the Herfindahl index, patent coefficient, input-output method, and coupling coordination model [18]. Among these methods, given that the coupled coordination degree model can represent the degree to which many systems are developing synergistically and are more suitable for measuring the level of CDIEI, this model is used in this paper.
Research on the Influencing Factors of Carbon Emissions
Factors such as economic development level, urbanization, opening up level, environmental regulation intensity, and human capital level will have an impact on CE. Grossman and Krueger [19] analyzed the relationship between economic development and CE and found a “U-shaped” relationship, namely the environmental Kuznets curve. Some scholars also believe that the relationship between the two is an “inverted N-shaped” relationship [20]. Some studies suggest that after the Industrial Revolution, the growth of the world economy led to a rapid increase in CE [21]. The relationship between urbanization and CE is relatively complex. Tang et al. [22] argue that with the rapid advancement of urbanization, a large amount of energy consumption and CE are rapidly increasing. On the contrary, Adams and Nsiah [23] argue that urbanization can improve carbon emission efficiency, improve management levels, and promote technological progress, thereby reducing CE. The opening up level to the outside world also has an impact on carbon emissions. Shen et al. [24] argue that while opening up to the outside world brings benefits to enterprises, it may also lead to excessive resource utilization, resulting in an increase in CE. Similarly, imports are also affected. Salman et al. [25] point out that with the increase in imported products, the consumption of transportation will also increase, so CE will further increase. The series of environmental protection policies introduced by our country have, to some extent, affected CE. Zhang et al. [26] argue that environmental regulations will not reduce CE, which is known as the “green paradox”. Wu et al. [27] argue that although environmental regulation can promote CE in western China, it can reduce CE in other regions. There is a close relationship between the human capital level and the environment. Bano et al. [28] argue that, in the long run, human capital will improve CE. However, Çakar et al. [29] argue that human capital only suppresses CE at low growth levels and vice versa at high growth levels.
Research on the Impact of Industrial Convergence on Carbon Emissions
It was discovered through a review of relevant research that there are two categories of studies on the connection between industrial convergence and CE. The first category is research on the impact of the CDIEI on CE, which is relatively rare. Wang et al. [11] used principal component analysis to calculate the convergence level of the digital and energy industries in China as a whole and in various regions from 2002 to 2018. The study found that the convergence of the digital and energy industries helps to advance the fulfillment of the “dual carbon” goal. The second category is research on the impact of the convergence of other industries on CE. Lin and Heng [30] studied the relationship between the level of convergence in the development of manufacturing and productive service industries and carbon emission efficiency in 30 provinces of China from 2003 to 2017. The results showed that the convergence of the two industries can significantly improve carbon emission efficiency. Kuan and Lei [31] used mediation models and spatial Durbin models to study the impact of rural industrial convergence on agricultural CE in 30 provinces and cities in China from 2008 to 2020. The results showed that rural industrial convergence can suppress carbon CE by optimizing labor, expanding land scale management, and promoting agricultural technological progress. Bangsheng et al. [32] used a bidirectional fixed effects model to calculate the impact of rural primary, secondary, and tertiary industry convergence on agricultural CE in 30 provinces and cities in China from 2011 to 2020. The study showed that rural industry convergence can suppress agricultural CE. Xia et al. [33] used a three-stage least squares method to analyze the impact of the convergence of China’s manufacturing and digital services industries on CE from 2006 to 2018 and concluded that there is a “U-shaped” relationship between the two.
Through a review of relevant literature, it was found that there are currently shortcomings in the research for the CDIEI on CE:
(1) Lack of research on the CDIEI.
(2) The existing literature on the digital industry, energy industry, and CE mainly focuses on the relationship between the two. Currently, there are no articles that incorporate the CDIEI and CE into a unified research framework.
(3) The existing literature lacks empirical analysis ideas on the CDIEI on CE.
This study takes the following steps to address the above deficiencies or gaps:
(1) Construct an indicator system for the digital industry and energy industry, using the entropy approach and coupling coordination degree model to calculate the CDIEI level. Use an ArcGIS visual map to analyze the trend of the level of CDIEI. The work adds to the existing literature on measuring industrial convergence.
(2) Incorporated the CDIEI and CE into the same research framework and analyzed the impact of the CDIEI on CE.
(3) The article empirically tests the impact of the CDIEI on CE and innovatively, according to the level of industrial convergence, by dividing China’s 30 provinces into high convergence regions and low convergence regions to examine how differing regional convergence levels affect CE. Selecting two variables, ISU and GTI, as mechanism variables and threshold variables, we explore the impact mechanism and nonlinear effects of the CDIEI on CE.
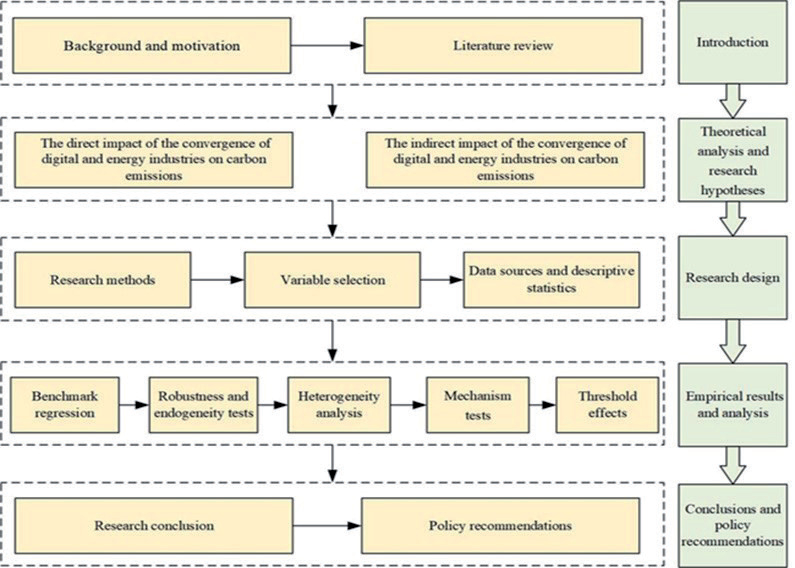
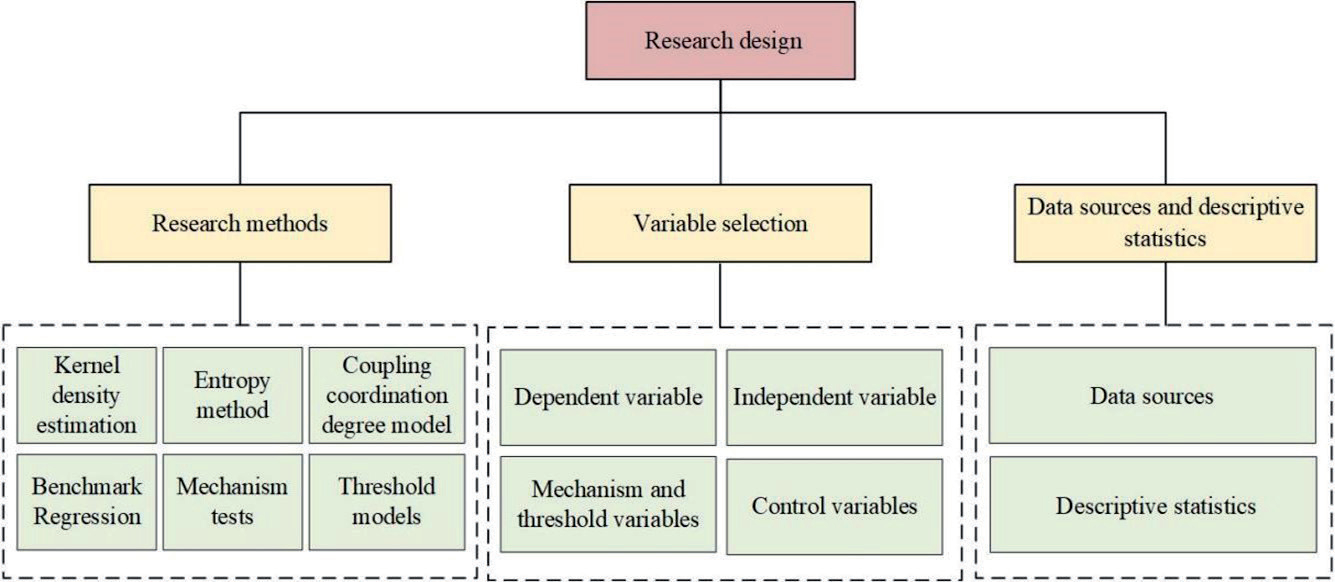
Here are the remaining sections of the article: Section 2 presents the theoretical analysis and proposes the research hypotheses. Section 3 describes the research design of the article. Section 4 conducts the empirical analysis and gives the results. Section 5 contains conclusions and policy recommendations. Fig. 1 depicts the specific framework for this article.
Theoretical Analysis and Research Hypotheses
The Impact of the Convergence of the Digital Industry and the Energy Industry on Carbon Emissions
With the development of society, the digital industry and the energy industry are infiltrating each other. CDIEI is an effective resource convergence method that can reduce operating costs. It allows limited resources to be used for research and development of new products to improve energy efficiency [34]. It can also promote a comprehensive and interconnected upgrading and transformation of related industries, reducing the consumption of fossil energy and improving production energy efficiency [35], thereby achieving carbon reduction. Meanwhile, the CDIEI can have a profound impact on the entire energy system. If energy pollution happens, quick action can be taken to stop it from worsening, thus curbing CE [36].
Hypothesis 1. The CDIEI can curb CE.
The Impact Mechanism of the Convergence of the Digital Industry and the Energy Industry on Carbon Emissions
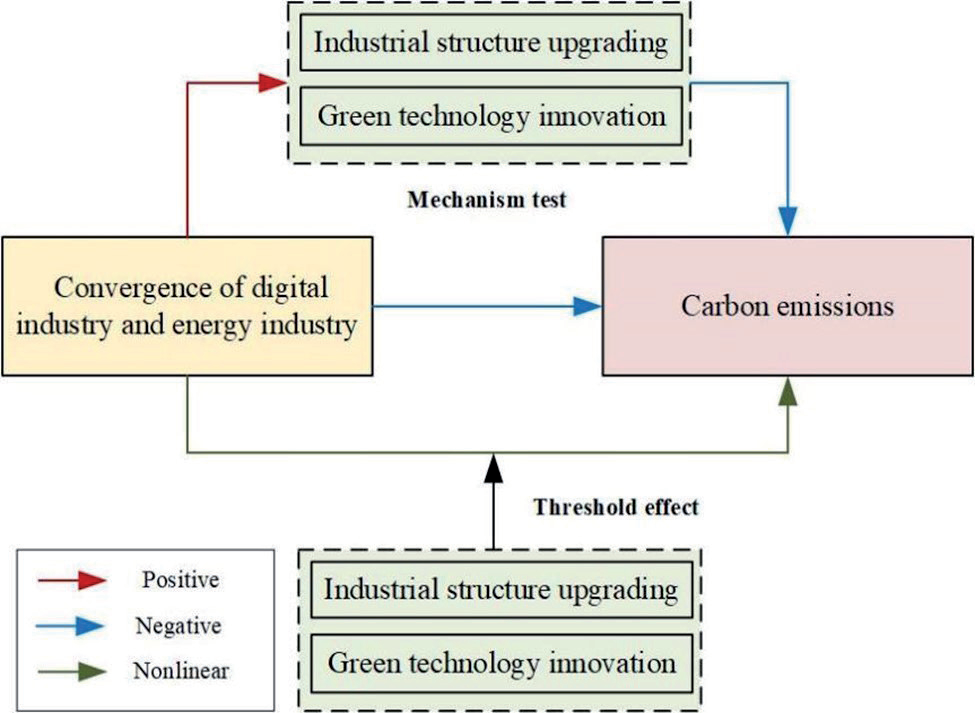
The CDIEI can effectively promote the ISU because industrial convergence helps promote innovation in conventional industries, which in turn encourages the industrial structure to be optimized. The digital industry and energy industry have moved from gradual interpenetration to full convergence, which is conducive to the realization of ISU and facilitates its development in the direction of rationalization, high-end modernization, and greening [37]. Industrial restructuring is an effective way to curb CE [38]. ISU may modify the structure of energy-intensive industries by allocating production elements logically, thus realizing the purpose of reducing CE [39]. Therefore, relocating beyond the secondary into the third sector of the economy can be conducive to curbing CE [40].
Dong et al. [16] believed that industrial convergence could promote GTI. GTI is an innovation mode coordinated with the ecological environment [41]. The digital industry is environmentally friendly, so the deep CDIEI might enhance resource use in an efficient manner and capital allocation, release the vitality of green innovation, reduce energy consumption and pollution emissions, and then stimulate enterprises to undertake green innovation research, protect the environment, save energy and reduce emissions, and promote regional GTI. GTI is an important means of reducing CE [33]. GTI can not only significantly reduce CE but also meet the goal of ecological protection [42]. It can reduce CE by reducing energy intensity, improving production efficiency, and enhancing the environment’s condition [43].
Hypothesis 2. The CDIEI can curb CE by promoting ISU and enhancing GTI.
The Nonlinear Impact of the Convergence of the Digital Industry and the Energy Industry on Carbon Emissions
The ISU will lead to a phased change in CE. In the initial period, China’s secondary industry had a very unsteady basis and was driven by scientific and technological innovation and social demand. The rise of secondary industry and its dominance over a country’s industrial structure have led to the rapid growth of China’s economy. It has resulted in a sharp increase in energy consumption [44]. Consequently, when the industry grows more intense, the importance of the tertiary industry also increases. It is essential for adjusting the industrial structure, but it also greatly encourages conserving energy and the reduction of emissions [45]. It is an important force for reducing carbon, reducing pollution, and expanding green. So, the ISU will have a jump in the impact on CE.
The inhibitory effect of GTI on CE shows an increasing trend. Initially, the application of GTI is in a period of experimentation and demonstration. When the promotion of green ideas has only just begun, green technological innovations are not a good impediment to CE reductions; when the application of GTI reaches a certain phase, technology, machinery configuration, and management will be improved. The green platform has been improved, the green concept has been widely recognized, the distribution of resources is more sensible, the upgrading of GTI has become faster, and CE has been curbed. Fig. 2 depicts the theoretical analysis of this research.
Hypothesis 3. The CDIEI has a non-linear impact on CE due to the ISU and the improvement of GTI.
Research Design
Research Methods
Kernel Density Estimation
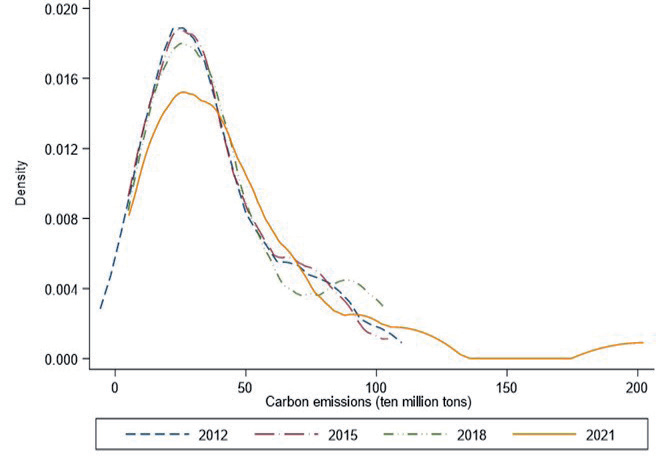
The overall spatial differences and dynamic evolution trends of CE in the 30 provinces of China in 2012, 2015, 2018, and 2021 are depicted using the Kernel density estimate’s nonparametric estimate to more intuitively represent the spatial distribution of China’s CE. The formula is shown below:
Among them, Nh is the number of observation values. Xi represents the observation point value, x is the average value, h represents bandwidth, and k(·) represents the kernel functions. Select Gaussian kernel functions that have been widely used in existing research, as shown below:
Entropy Method
Standardize the data and calculate the indicator weights.
Step 1, Standardization of indicators:
Positive indicators:
Negative indicators:
Among them, xij' reflects the standard value, xij represents the original value, provinces are denoted by i, i = (1,2,…,n), indicators are denoted by j, j = (1,2…,m).
Step 2, To eliminate the impact of “0” after standardization on subsequent calculation results, let xij = xij+10-4. The following is the formula for calculating the proportion of indicator characteristics:
Step 3, Calculate the information entropy of indicators:
Step 4, Calculate the coefficient of difference gi and indicator weight
Coupling Coordination Degree Model
Construct a model for estimating the CDIEI level:
Among them C is the degree of coordination between the digital industry and the energy industry in China, based on which the mutual relationship between the two can be determined; U1 and U2 represent the comprehensive indicator values of the two industries, respectively; CDIEI represents the level of convergence between the digital industry and the energy industry, which tends to be closer to 1, signifying a greater CDIEI level; T is the composite indicator’s level of development for the two industries; α and β represent the undetermined weight coefficient, with α + β = 1, considering that the two industries are equally important in this study; α = β = 0.5.
Benchmark Regression
Constructing the following model for testing the connection between CDIEI and carbon emissions (lnCE):
Among them, lnCEit is the carbon emissions of province i in year t, CDIEIit represents the convergence level of the digital industry and energy industry, Controlit is the relevant control variables, μi and vt are divided into fixed effects of province and time, while εit is a random error term.
Mechanism Tests
Drawing on the ideas of Ting [46], the following mechanism testing model is constructed:
Among them, med represents mechanism variables and incorporates industrial structure upgrading (STU) and green technology innovation (lnGTI), while others are consistent with the above.
Threshold Models
Prior theoretical analysis shows that the influence of the CDIEI on CE may have nonlinear characteristics. Therefore, referring to Hansen [47], constructing panel threshold models:
Among them, q is the threshold variable, representing STU and lnGTI, respectively. θ is the corresponding threshold value, I(·) is the indicator function, which estimates a value of 0 in the absence of the condition in parenthesis and 1 when it is satisfied. The remaining variables are consistent with the above.
Variable Selection
Dependent Variable
Considering the IPCC [48] as a reference, calculate the 30 provinces’ CE in China from 2012 to 2021 and take logarithmic values. CE mainly comes from the combustion of fossil fuels and industrial processes. In this article, fossil energy is subdivided into seven energy categories: coke, coal, diesel, kerosene, gasoline, fuel oil, and natural gas. In industry, the study only considers CE from cement production and estimates CE using the following expression:
Among them, k is the fossil energy type, Ek is the k-th energy consumption, CEFk is the emission coefficient during the combustion of k-type energy, M0 is the CE coefficient in the process of making cement, and Q is the volume of cement produced. After further decomposition of the CE coefficient, Hk stands for the k-type energy’s average low calorific value. CHk denotes the carbon content per unit of calorific value during fossil fuel combustion, CORk represents the carbon oxidation factor, and 44/12 represents the molecular weight proportion for carbon dioxide to carbon.
To explore the dynamic distribution characteristics of CE in various provinces of China, kernel density estimation was used to obtain CE kernel density plots for 30 provinces in China in 2012, 2015, 2018, and 2021, as shown in Fig. 3. Firstly, from a positional perspective, there has been no significant shift in the center of CE nuclear density since 2012. From the curve shape, it shows a single peak characteristic as a whole, with the peak in 2012 being the highest, followed by 2015, 2018, and 2021. The peaks have gradually shifted from the “sharp peak” to the “broad peak”, indicating a significant spatial imbalance in China’s CE. The differences in economic development, technological level, urbanization level, and other factors lead to differences in CE among different provinces. The kernel density estimation curve in 2021 exhibits a right “trailing” phenomenon, indicating an increase in the proportion of provinces in China with high CE in 2021. The improvement of independent research and innovation capabilities in various regions, coupled with limited technological capabilities for reducing CE, led to an increase in CE in some provinces. Therefore, investigating China’s low-carbon development route is essential.
Independent Variable
Taking into account the evolution of China’s digital industry and energy industry, taking full account of all factors, and based on a summary of existing studies, in keeping with the principles of scientificity, operability, representativeness, and data accessibility, three aspects have been taken into consideration when creating a system of indexes for the digital and energy industries: industrial scale, industrial structure, and industrial efficiency and includes a quantity of 16 secondary indicators. The CDIEI is measured using the coupling coordination degree model. The specific indicator construction is detailed in Table 1.
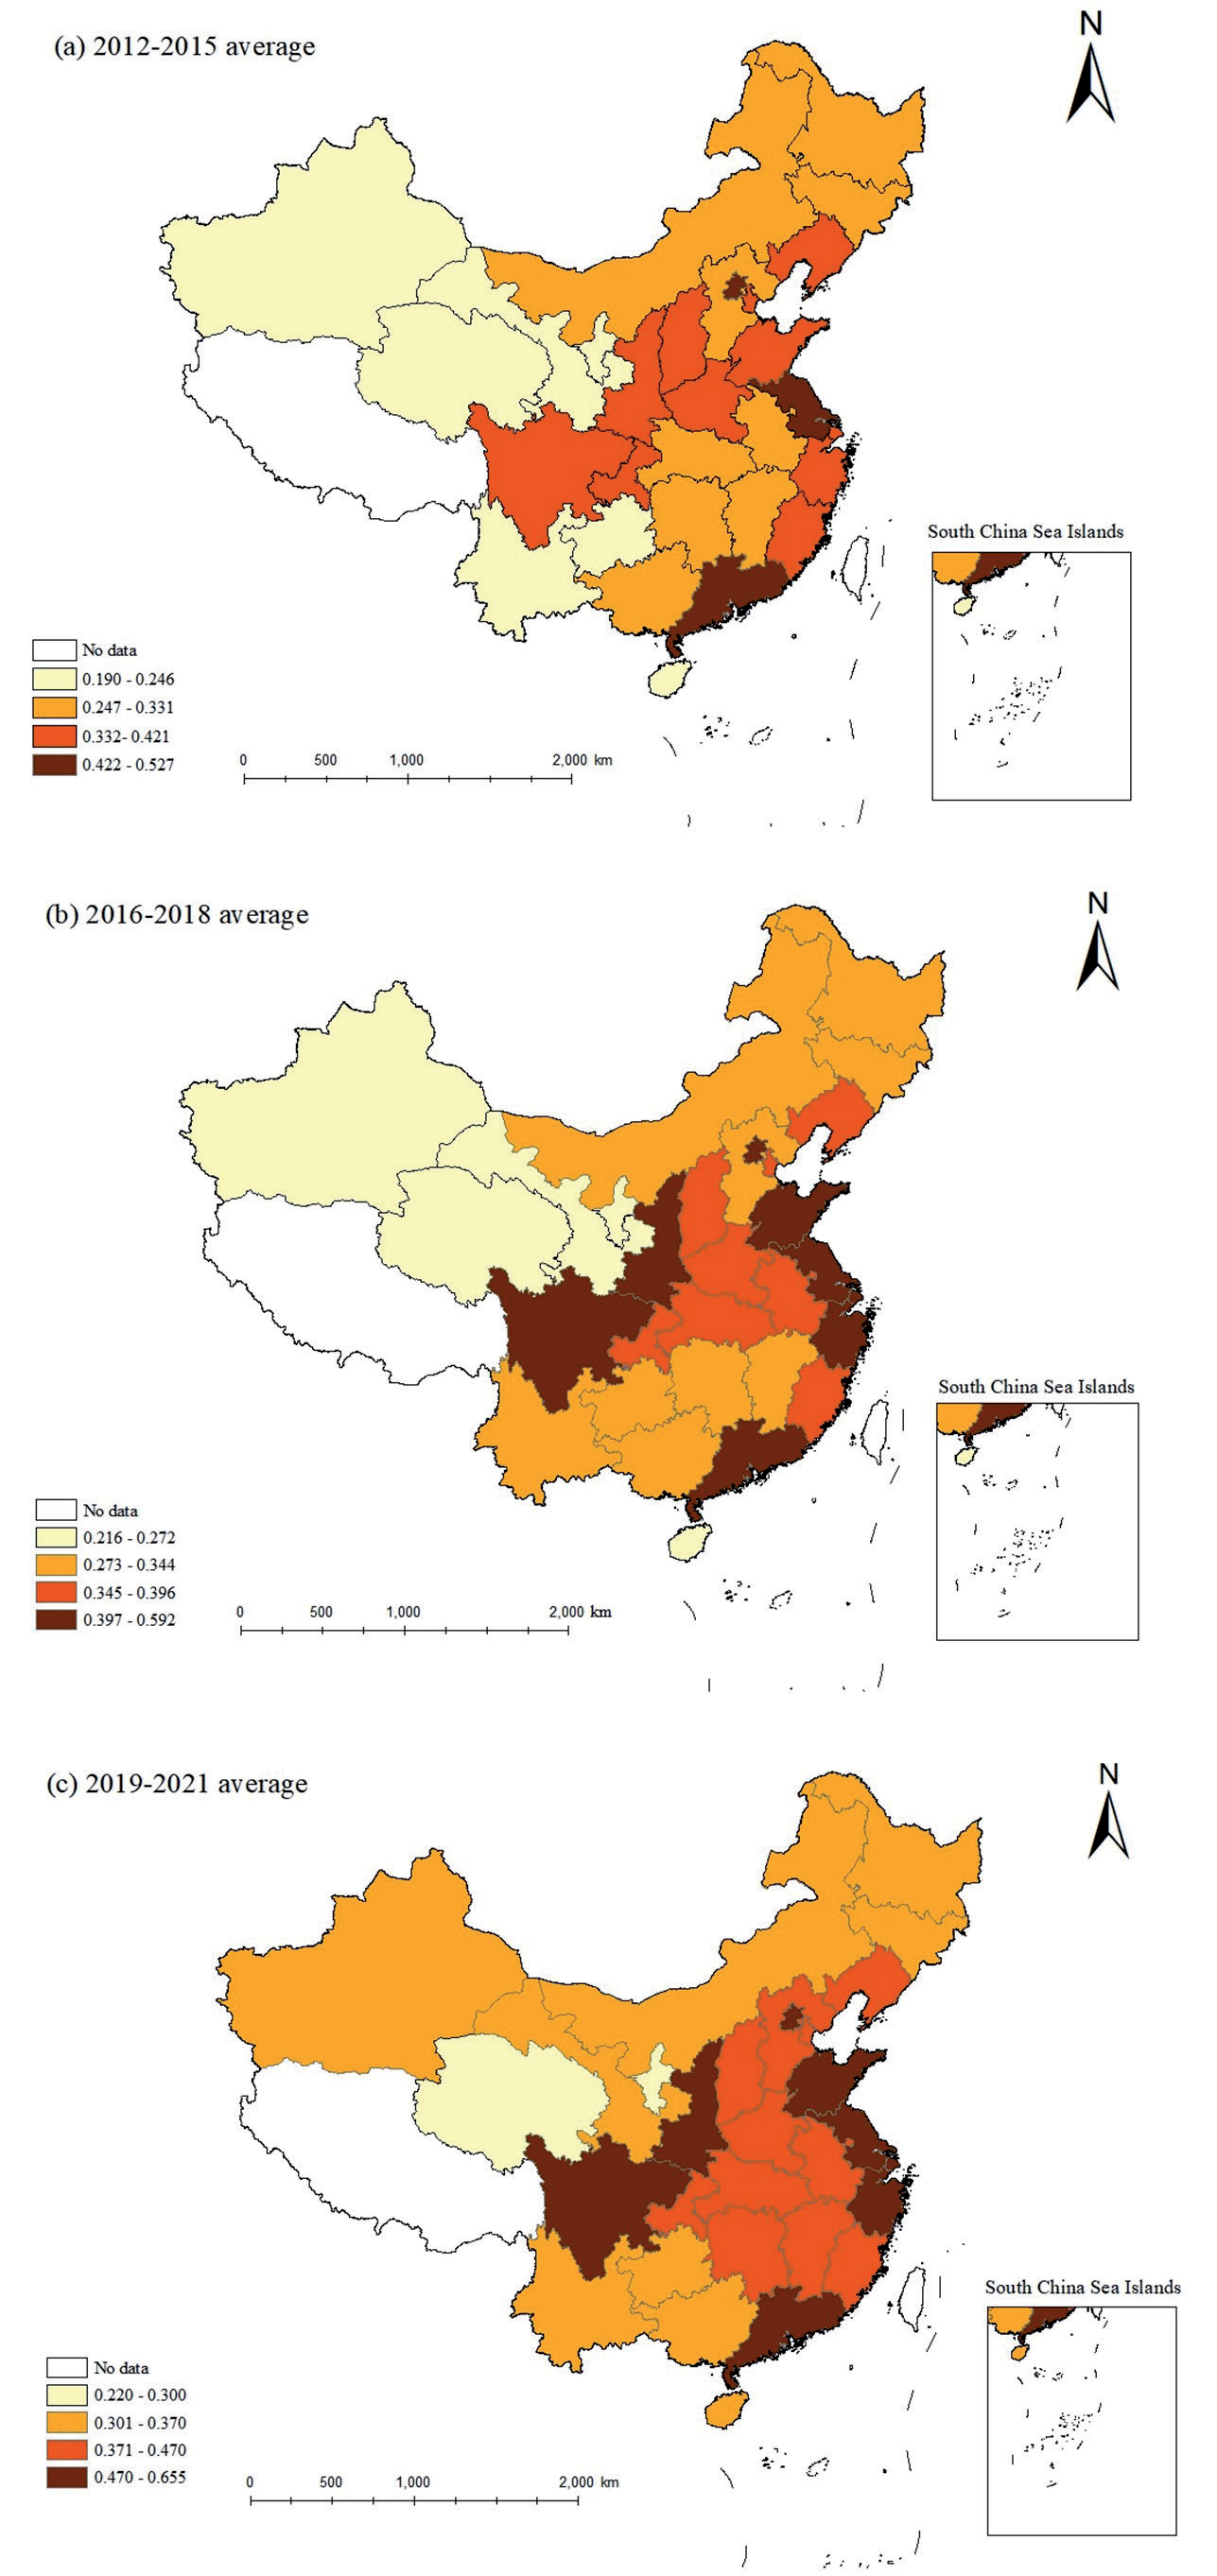
To show the CDIEI and its spatial distribution characteristics features more graphically and intuitively, this paper selects the average annual convergence level of 30 provinces in China in 2012-2015, 2016-2018, and 2019-2021, and draws an ArcGIS visual map as shown in Fig. 4. First of all, from an overall perspective, from 2012 to 2021, the CDIEI in 30 provinces in China has shown different degrees of improvement but is still in the development stage; the eastern seaboard has greater levels of convergence, the middle region comes in second, the northwest region is last, and the level of CDIEI varies widely across provinces, with some cities far surpassing others. From 2012 to 2015, only Beijing, Jiangsu, and Guangdong provinces and cities had a good level of convergence; from 2016 to 2018, eight regions, Beijing, Shanghai, Shandong, Jiangsu, Zhejiang, Guangdong, Sichuan, and Shaanxi, had a better level of convergence. While the convergence level of Hubei, Anhui, Yunnan, and Guizhou showed a significant increase from 2019 to 2021, the convergence level of Hebei, Hunan, Jiangxi, Hainan, Gansu, and Xinjiang improved, while the convergence level of Qinghai and Ningxia was relatively low.
Table 1.
Evaluation index system for the development level of the digital industry and energy industry.
Fig. 4.
ArcGIS visual map of the level of CDIEI from 2012 to 2021. Source: This map depends on a standard map that was acquired from the Standard Map Service website of the National Bureau of Surveying and Mapping Geographic Information. It has the review number GS (2022) 1873. There are no changes to the original map.
Mechanisms and Threshold Variables
The prior theoretical analysis demonstrates that STU and lnGTI are selected as mechanisms and threshold variables. The STU is represented by the tertiary industry’s value-added divided by the secondary industry’s value-added. lnGTI shows the total number of green patent applications and logarithmic.
Control Variables
Referencing existing literature, five variables that affect CE have been chosen as control variables: Economic development level (lnGDP), measured and logarithmized using per capita GDP; Urbanization (URB), expressed as the ratio of the resident urban population to the annual resident population of the region; Opening up level (OPEN), determined by the total amount of imports and exports relative to GDP; Environmental regulation intensity (ER), expressed as the ratio of completed investment in industrial pollution control to the value-added of industry; Human capital level (HC), expressed as the ratio of the number of students enrolled in higher education to the total local population.
Data Sources and Descriptive Statistics
Based on 30 provinces and cities in China, 2012-2021 (Hong Kong, Macao Special Administrative Region of China, Taiwan, and Tibet Autonomous Region are not covered due to missing data). 2012-2021 data is taken from the China Statistical Yearbook, the China Energy Statistical Yearbook, the China Electronic Information Industry Statistical Yearbook, the China High Tech Industry Statistical Yearbook, the Regional Statistical Yearbook, the National Bureau of Statistics, and CNRDS databases. Interpolation is used for partially missing data. Fig. 5 shows the research design.
The statistical status of the variables that were chosen for this paper can be seen in Table 2. The CDIEI is 0.365 on average, which shows that the level of CDIEI in China is still at a low level and requires improvement. In addition, its largest value is 0.681, while the smallest is 0.176, representing a large gap in the CDIEI among China’s provinces, consistent with the previous results.
Table 2.
Descriptive statistics of variables.
Empirical Results and Analysis
Benchmark Regression
To test the CDIEI on CE, a benchmark regression is conducted on the full sample data. Before model testing, the Hausman test was first used to decide between a fixed effects model and a random effects model, which showed a p-value equal to 0.0000. The original hypothesis was rejected. For benchmark regression, a fixed effects model was thus selected. In Table 3, column (1) indicates the CDIEI effect lnCE without considering control variables. The regression result indicates that for every 1% rise in the CDIEI, lnCE will reduce by 1.154% and be significant at the 5% level. The effect of the CDIEI on lnCE after considering relevant control variables in column (2), indicates that when relevant factors work together, for every 1% increase in the CDIEI, lnCE will be reduced by 1.503%, which is significant at the 5% level. Therefore, the CDIEI can curb lnCE. With the continuous deepening of the CDIEI, the relationship between the digital industry and the energy industry has become increasingly close. The convergence of the two industries has improved energy production and utilization efficiency, ensured the quality of energy resources, and reduced environmental pollution related to energy. Hypothesis 1 is established.
In the control variables, lnGDP and lnCE are significantly positive at the 1% level. Economic growth will be accompanied by resource consumption and energy use, leading to an increase in lnCE. URB and lnCE are significantly positive at the 5% level. URB promotes energy consumption, traffic congestion, and urban population aggregation, which in turn, exacerbates environmental pollution and lnCE. The regression coefficient between the OPEN and lnCE is positive but not significant. The OPEN at this time cannot significantly affect lnCE. ER and lnCE are significantly negative at the 1% level, despite the remarkable success of ER in China, generally reducing lnCE. HC and lnCE are significantly positive at the 10% level. HC helps to absorb foreign technology, providing technical support for saving production and reducing lnCE.
Robustness and Endogeneity Tests
Robustness Tests
As noticed in Table 4, to guarantee the study’s robustness, the paper examines three aspects. Firstly, the dependent variables are switched to per capita carbon emissions (lnPCE) for a fixed effects regression. In column (1), the CDIEI is still significant at the 5% level. Secondly, four municipalities were excluded from the data. Given that China’s municipalities have a higher degree of economic development than the country as a whole and the increasing emphasis on environmental protection, also an important pillar of China’s development, there is a certain gap between them and the national average, and the regression results will have an impact. In column (2), the CDIEI is still significant at the 5% level. Third, the shrinking of independent variables. In order to avoid adverse effects of abnormal values, non-random measurement results, and non-randomness measures, In column (3), the independent variable is re-estimated after shrinking the upper and lower 1%. The above three robustness tests indicate that the coefficient sizes and significance levels of the independent variables change slightly. There has been no obvious shift in the coefficients’ significance or sign. Therefore, the benchmark regression results have strong robustness and credibility, so the CDIEI can curb CE.
Endogeneity Tests
The above robustness test has, to some extent, alleviated the endogeneity issues that may exist in this study, but it still cannot avoid errors. To address these issues, the lagged 1-period term of the CDIEI was used as the instrumental variable (IV) for 2SLS regression. Table 4 column (4) shows that the results of the first stage test are significantly positive, and the Cragg Donald Wald F-value is 814.30, which is greater than the critical value of 10, rejecting the null hypothesis of weak instrumental variables and indicating that the constructed instrumental variables are reasonable. The results of the second stage of column (5) indicate that the regression results are consistent with the benchmark regression results, indicating that there are no endogeneity issues caused by omitted variables or reverse causality, further confirming the credibility of the benchmark regression results.
Table 4.
Robustness and endogeneity tests.
Heterogeneity Analysis
Heterogeneity Analysis of Geographical Location
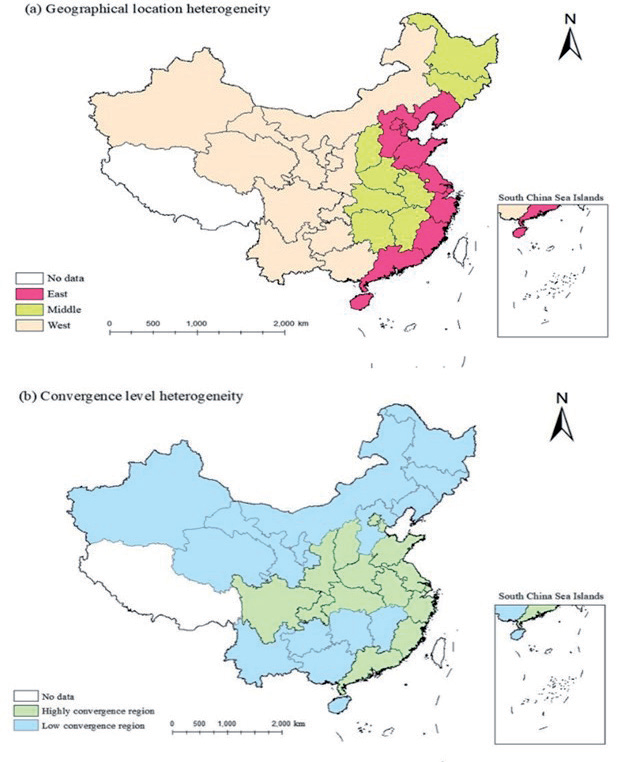
China’s different regions differ greatly in terms of their degree of development, and there is significant regional heterogeneity in lnCE. Table 5 also proves that the CDIEI to curb lnCE is indeed influenced by geographical location. Referring to the approach of Xiaobo et al. [49], it divides the 30 provinces of China into eastern, middle, and western. In columns (1) and (2), the CDIEI in the eastern and middle regions is significant at the 5% level, representing that the CDIEI in the eastern and middle regions can curb lnCE. In the western region, the coefficient is negative but not significant. Representing the CDIEI has no significant impact on lnCE. The root cause of this result is that the middle and eastern regions of China have developed economies, can provide sufficient funds, and have a lot of high-quality and high-level talents, advanced technology, and a broad market. These provide a good basis for the CDIEI, which is conducive to curbing lnCE. Although the western region has abundant energy resources, high-tech industry development continues to be comparatively slow, economic development is backward, and the level of science, technology, and education lags, resulting in insufficient demand for industrial convergence and an inability to effectively curb lnCE.
Table 5.
Heterogeneous regression results.
Fig. 6.
Geographical location and industrial convergence level distribution map. Source: This map depends on a standard map that was acquired from the Standard Map Service website of the National Bureau of Surveying and Mapping Geographic Information. It has the review number GS (2022) 1873. There are no changes to the original map.
Heterogeneity Analysis of Industrial Convergence Levels
Both the digital industry and the energy industry that has developed differ greatly throughout China’s provinces, resulting in different levels of industry convergence. Based on this, using the average level of CDIEI as a benchmark for group regression of 0.37, regions above the average are called high convergence regions, below the average are called low convergence regions. In Table 5, columns (4) and (5), the CDIEI in high convergence regions will increase by 1% and lnCE decrease by 0.85%, significant at the 10% level; a rise with the CDIEI of 1% in low convergence regions will increase lnCE by 1.32% and is significant at the 5% level. This can represent that high convergence regions have better enjoyed the dividends of industrial convergence, and greater CDIEI levels imply a larger contribution to lnCE; in low convergence regions, due to the lack of infrastructure, technology, and talent support, the development of the digital industry and energy industry is unbalanced, which restricts the convergence development of the two industries and exacerbates the development gap between regions. The distribution of geographical location and industrial convergence level is shown in Fig. 6.
Mechanism Tests
Mechanism Testing of Industrial Structure Upgrading
Table 6’s column (1) results indicate that the CDIEI’s impact coefficient on ISU is 1.575 at the 5% level, which is significant. The CDIEI influences the ISU positively, as it helps to share resources between industries, improve resource utilization efficiency, reduce resource waste, improve resource quality and efficiency, and promote the ISU. The above results indicate that promoting ISU is an important channel for the CDIEI to curb lnCE, consistent with theoretical analysis.
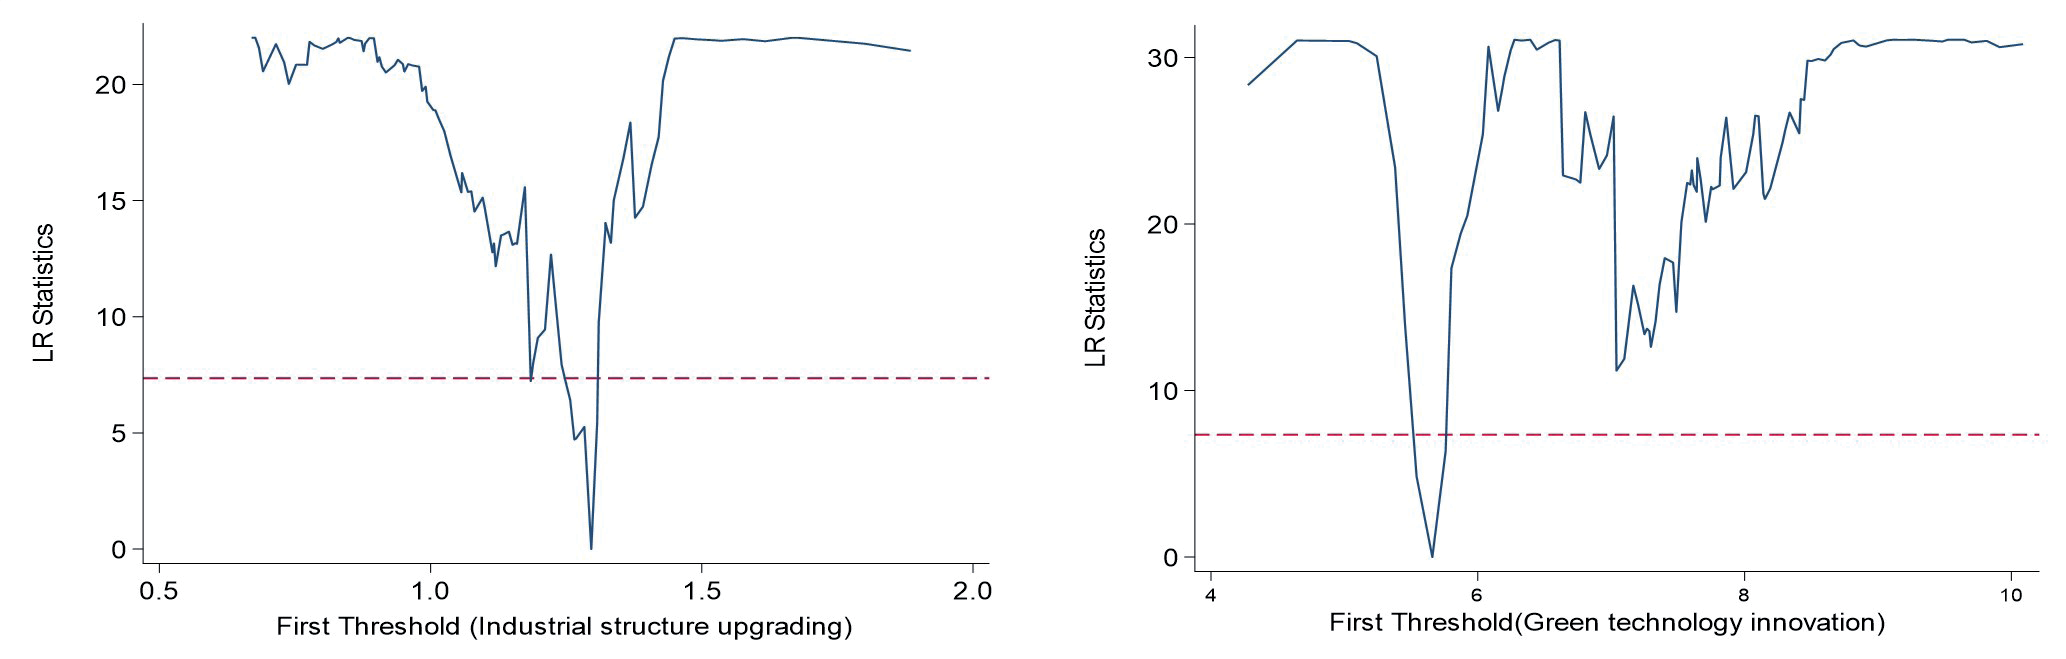
Table 8.
Panel threshold regression model estimation results.
Mechanism Testing of Green Technology Innovation
Table 6’s column (2) results indicate that the CDIEI’s impact coefficient on GTI is 2.828 at the 5% level, which is significant. The CDIEI influences the GTI positively because it can accurately allocate factor resources, reduce high pollution production links, minimize environmental emissions and energy use, lower costs of technological innovation, and increase its capacity and efficiency, thus laying the foundation for improving lnGTI. Therefore, the CDIEI can curb lnCE by enhancing the lnGTI. The above results indicate that upgrading lnGTI is an important channel for the CDIEI to curb lnCE, consistent with theoretical analysis. Hypothesis 2 is established.
Threshold Effects
Based on this previous theoretical research, it is clear with the ISU and the improvement of the level of lnGTI. The CDIEI will have a nonlinear effect on lnCE. Therefore, the test is conducted using a panel threshold model. Table 7 contains the threshold effect test and the threshold value estimation. The results of 300 bootstrap simulations indicate that there is a single threshold value for both ISU and lnGTI. The threshold value for ISU is 1.296, and the threshold value for lnGTI is 5.660.
To verify the authenticity of the existence of threshold values, construct likelihood ratio function graphs for the two threshold variables mentioned above. When the resulting threshold value lies within the LR value of the confidence interval, it means that the threshold value is true. From Fig. 7, single threshold values for ISU and lnGTI are both within the 95% confidence interval, so the model passes the test.
After passing the test, the regression analysis was performed using the panel threshold model and parameter estimates in Table 8.
The Threshold Effect of Industrial Structure Upgrading
The effect of the CDIEI on lnCE is positive but not significant when the ISU is less than the threshold value of 1.296. When the ISU crosses the 1.296 threshold, the effect of the CDIEI on lnCE is significantly negative. It indicated that China may have underdeveloped tertiary industries at the initial stage of ISU, mainly labor-intensive manufacturing, and the proportion of industry is relatively large, with significant differences in industrial structure across regions, leading to the promotion of lnCE through ISU. However, as the level of ISU increases, the CDIEI is beginning to gradually reduce lnCE, which indirectly indicates that the reduction effect of the CDIEI on lnCE depends on the ISU.
The Threshold Effect of Green Technology Innovation
When lnGTI is less than the threshold value of 5.660, the CDIEI has a significant and reducing effect on lnCE; when lnGTI crosses the threshold of 5.660, the CDIEI has a more significant reduction effect on lnCE, reaching 1.502 and significant. Indicating that lnGTI can improve the ecological environment while maximizing economic and social benefits. Therefore, enhancing the level of lnGTI can significantly improve environmental quality and reduce lnCE. Therefore, Hypothesis 3 is established.
Conclusions and Policy Recommendations
This article explores the impact of CDIEI on CE based on panel data from 30 provinces in China from 2012 to 2021. The findings indicate that the CDIEI level is generally showing varying degrees of improvement but is still in a developmental stage. The CDIEI is beneficial for curbing CE. After several robustness tests and endogeneity discussions, the finding is still true. Heterogeneity analysis shows that CDIEI in the eastern and middle regions and high convergence regions can curb CE. The CDIEI can also reduce CE by promoting ISU and enhancing GTI, and there is a non-linear effect when crossing a single threshold. The role of CDIEI in curbing CE will be strengthened. Given this, the following policy recommendations are proposed:
First, comprehensively and actively promote the development of the CDIEI. There is still significant room for improvement in CDIEI in China, as well as the potential for CE reduction. We need to accelerate the exploration of new industry models and realize a greater leap forward between the industries. Improving the infrastructure construction of the digital and energy industries, creating a digital energy open cooperation park, and adhering to the idea of low-carbon and environmentally friendly growth will strengthen open cooperation in the digital energy industry, promote domestic and foreign dual circulation coordination, promote the CDIEI, and curb CE.
Secondly, based on one’s reality, explore industry convergence models that are suitable for the local area according to local conditions. Correctly understand the development gap between provinces, continue to optimize the convergence model of the digital industry and energy industry in the eastern and middle regions, reduce CE, and promote local green development. The CDIEI in the western region urgently needs to be improved. We need to strengthen the foundation of the digital industry and energy industry, actively propel the CDIEI, and improve support policies for the western region. Low convergence regions need to strengthen their connections with high convergence regions, learn from their experiences, systematically formulate development strategies for the CDIEI, and promote coordinated regional development.
Thirdly, attach importance to the important role played by ISU and GTI. ISU and GTI are important paths for the CDIEI to reduce CE. The government needs to identify and judge whether the existing industrial structure is coordinated and reasonable, screen out factors that hinder the rationalization of industrial structure, promote ISU, and correspondingly relax regulations to provide a relaxed macro environment for industrial convergence. Increase financial support for GTI, promote GTI for enterprises, concentrate on creating, introducing, and promoting green technology, and further achieve green and low-carbon development in industrial convergence.
The CDIEI is key to reducing CE. Our series of empirical tests supports the results and provides new ideas for reducing CE. However, further work still needs to be done. Firstly, a more complete framework is needed for measuring the degree of industrial convergence, and a more comprehensive indicator system needs to be constructed in the future. Secondly, it is possible to conduct a more in-depth study on the impact of the convergence of other industries on CE to provide more effective policy recommendations for reducing it.

