


Introduction
In the construction arena, concrete is construed as an inevitable construction material. Owing to infrastructure development, need for the concrete increases in the each passing year [1]. Currently production of sustainable concrete becomes a great challenge since the ingredient of concrete derived from the non-renewable geological sources [2]. Utilization of industrial by-products as a concrete ingredient is an ideal solution to overcome this problem [3, 5]. Now-a-days, enormous quantity of combustion by-products has been produced from thermal power plants. Fly ash (FA) is the major by-product obtained from the coal burning process [6]. Worldwide the annual production of FA is much higher than its consumption [7, 9]. Only 80% of the produced coal combustion by-products have been utilized and the residual ash has been disposed in ash ponds. The most insidious component formed simultaneously with FA is pond ash [10, 13].
Pond ash (PA) are alumino-silicate light weight free flowing particles. The density of PA range between 2000-2100 kg/m3 [14]. Owning to their low density, pond ash (PA) in dry form can be easily carried by air and water [15]. Entrainment of ash in air may cause cardiovascular, respiratory problems to humans and animals [16, 18]. If it enters in to water bodies, it may harm aquatic livings [19]. Improper disposal of PA pose severe threat to environment. Hence this by-product should be disposed or reused in an effective manner [20, 21]. PA having cementitious properties, instead of disposing it as a waste material, it can be considered as a valued industrial by-product and used as a supplementary cementitious material (SCM) [22, 25]. PA produced by the thermal power plants consists of water holding capacity of 62-65% which plays a key role in enriching strength properties of the cement paste in concrete by according to standards [26].
By and large, the rheological properties mainly depend on the flow ability, which is significantly influenced by the supplementary cementitious material content and water/cementitious materials ratio [27, 29]. Packing density is one of the key parameter in the assessment of the flow ability of the cement mantle, particularly at low water-to-cementitious ratio [30, 32]. Higher packing density tends to and increases the free water content which lubricates the particles to produce water film coating. Hence, higher packing density could lead to a better workability [33, 35].
GGBS is an effective pozzalanic material which imparts good strength and flowability properties to the concrete. Enormous quantity of GGBS is produced in ferro silicon manufacturing industries as by-product [36]. In the production of green concrete, GGBS plays a substantial role. GGBS can also be employed as an effective substitute for cement in concrete to reduce the consumption of cement [37]. While using GGBS, considerable quantity of CO2 emission can be reduced which helps to reduce global warming. Hence usage of GGBS has umpteen benefits in production of eco-friendly concrete [38, 40].
Pond ash is comprised of a slurry mixture containing a notable proportion of bottom ash and fly ash [41]. Pond ash consists of particles that can be categorized into coarser and finer fractions. The coarser fraction exhibits limited pozzolanic reactivity, while the finer fraction possesses stronger and more pronounced pozzolanic properties [42]. To harness its pozzolanic properties, pond ash is transformed into a fine powder through a pulverizing process [43]. Incorporating 10% ground pond ash as a substitute for cement can improve the strength characteristics of the material while simultaneously reducing carbon dioxide (CO2) emissions [44, 45].
The strength of concrete mainly influenced by the rheological performance of cementitious materials [46]. Water retaining ability of the pozzolanic material could considerably condense the water requirements and enrich the strength properties of the cement paste in the concrete. However, sufficient water should be present in the mix to reduce the voids otherwise air may entrain through unfilled voids and the strength may be reduced [47, 48]. Few researchers reported that incorporation of optimal percentage of fine PA and GGBS particles would escalate the strength of concrete [49, 50]. Due to low density, good acoustic properties and thermal insulation, PA and GGBS have been preferred as a supplementary cementitious material [51]. Experimental investigations have been carried to assess the impact of PA and GGBS on the mechanical and rheological behaviour of the cement paste and results are discussed.
Materials
Ordinary Portland cement (OPC), PA and GGBS were used to produce cubes. OPC confirming grade 53 has been used. The specific surface area and specific gravity of OPC, PA and GGBS tested and found to be 325 m2/kg and 3.14, 398 m2/kg and 2.71 and 455 m2/kg and 2.87 respectively. The chemical compositions of OPC, PA and GGBS are revealed in Table 1.
M-Sand, a manufactured sand, was utilized as the fine aggregate, while crushed blue granite metal was employed as the coarse aggregate for all the mixes. The specific gravity of M-sand and Blue granite metal found to be 2.71 and 2.69. The bulk density of M-sand and Blue granite metal are determined and found to be 1850 kg/m3 and 1695 kg/m3. Conplast SP430 super plasticizer is used in this study. The optimal dosage of super plasticizer was found to be 0.5% by mass of the cement.
Mix Proportions
The mix proportions were formulated in accordance with the M20 grade specifications outlined in the Bureau of Indian Standards (BIS) of 2019 [52]. Experiments have been conducted in three phases as provided in Table 2. In the first phase, control mix with 100% OPC. In the second phase, PA content was varied from 0% to 20% in increments of 4% by the mass of cement. In addition, the third phase, optimum PA and GGBS content was varied from 0% to 25% in increments of 5% by the mass of cement. In this study, the water-to-cementitious ratios has been varied between 0.36 to 0.4 in increments of 0.2 by weight of cement.
Methods
Flow ability of the mix was assessed by Cone flow test. Fig. 1 shows the mini slump cone used for flow test. Cubical and split and flexural samples of size 150 mm x 150 mm x 150 mm ; 150 mm x 300 mm; 500 mm x 100 mm x 100 mm were used to assess the strength properties. SEM was carried out in the PSG institute of advanced studies, Coimbatore. Sample were prepared and tested as per BIS 516-1959 [26].
Results and Discussions
Compressive Strength
Binary Blended Concrete (BBC) and Ternary Blended Concrete (TBC)
Concrete cubes comprising various proportions of pond ash (PA) have been calculated at 28 days. Fig. 2 comprise the compressive strength of concrete cubes with variations of different mixes. Test results exhibited that the optimal replacement percentage of PA found to be 12%. Reduction in water-to-cementitious ratios considerably enhanced the cubes compressive strength up to 12% addition of PA. A lower water-cement ratio is associated with increased compressive strength in concrete [53]. It was observed that increasing the percentage of PA content beyond 12% tends to reduce the compressive strength. Hence, incorporation of PA up to 12% together with lower water-to-cementitious ratios would increase the strength. The lower value indicates the presence of unburned carbon present in the PA [43]. Higher strength attainment is due to thicker shell and the pozzolanic effect of the PA particles in the cementitious system.
Table 2.
Mix Proportions. Table 2. Mix Proportions.
The optimal percentage of PA content has been considered and the rest of the cementitious content was partially replaced with GGBS. Concrete cubes comprising different proportions of GGBS with optimal percentage of PA have been calculated at 28 days and shown in Fig. 3. 15% replacement of GGBS with cement along optimal percentage of PA gained higher compressive strength. The inclusion of GGBS in concrete leads to a more compact microstructure within the concrete matrix, thereby improving its strength [54].
Split Tensile Strength
Binary Blended Concrete (BBC) and Ternary Blended Concrete (TBC)
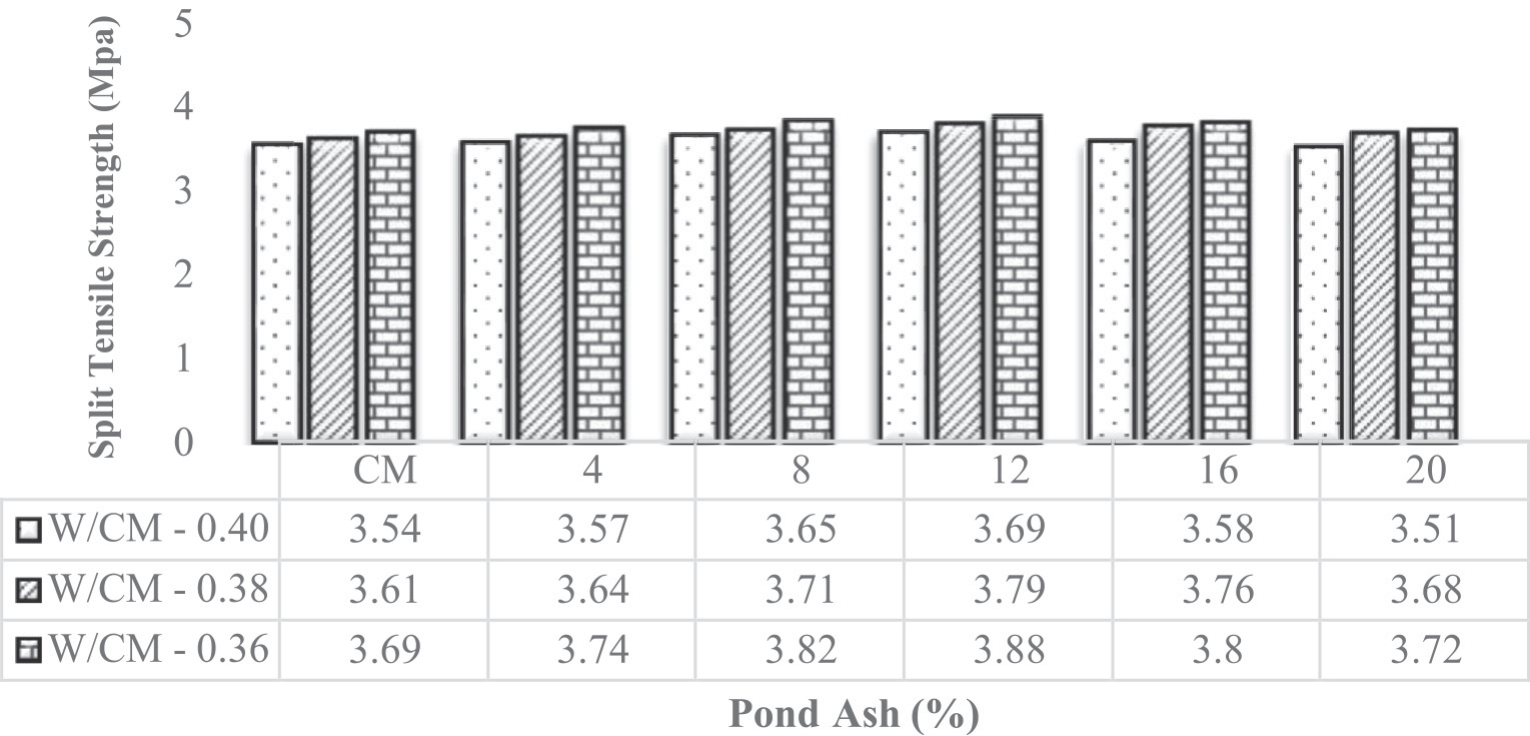
The split strength of concrete incorporating PA was evaluated and compared with the control mix at 28 days, as illustrated in Fig. 4. The 12% of PA concrete exhibited maximum split tensile strengths of 3.69 MPa, 3.79 MPa, and 3.88 MPa. Except for mix 16% and 20% of PA, the split tensile strength of PA concrete is higher compared to control mix.
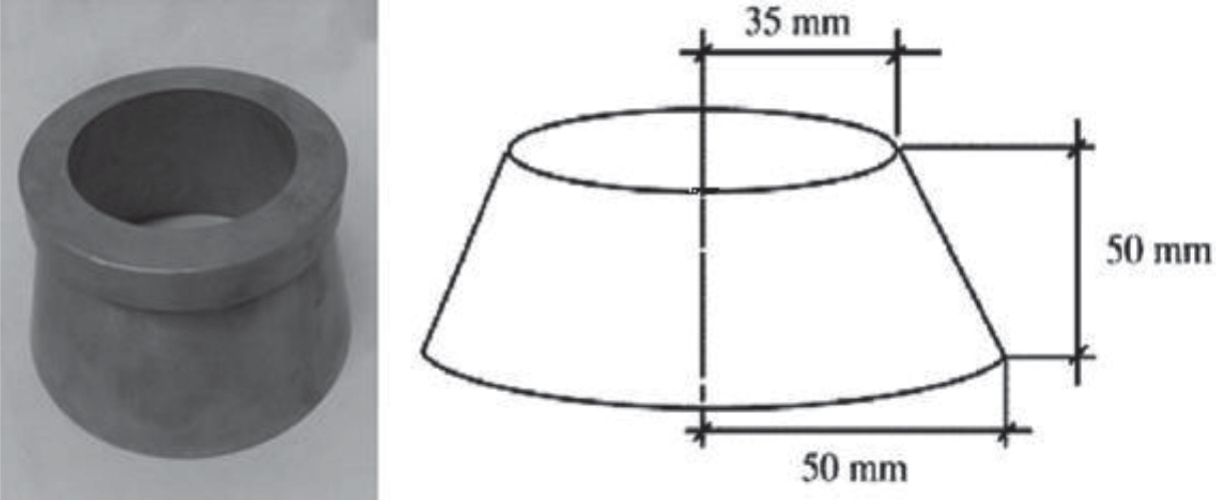
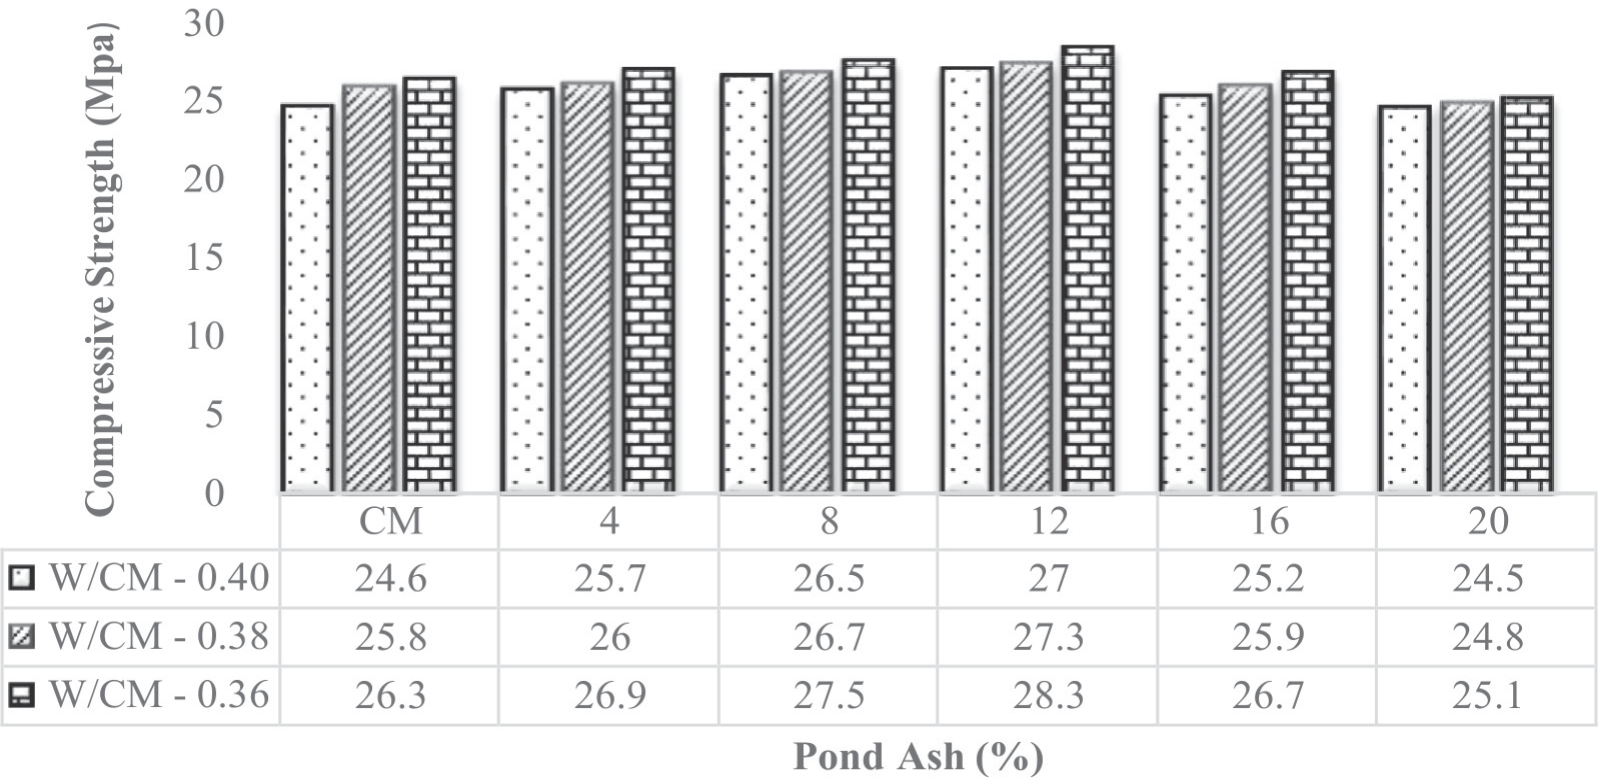
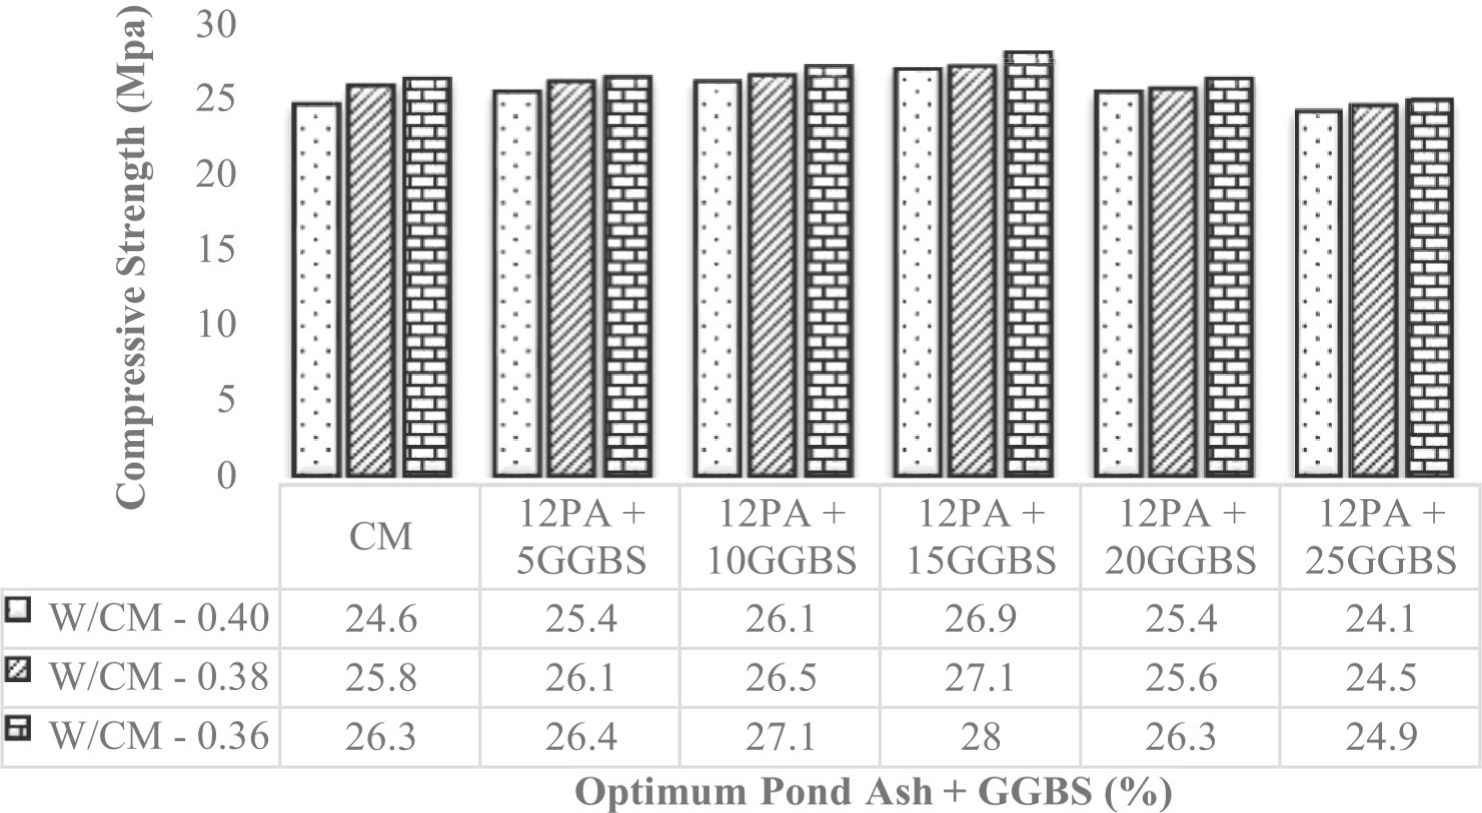
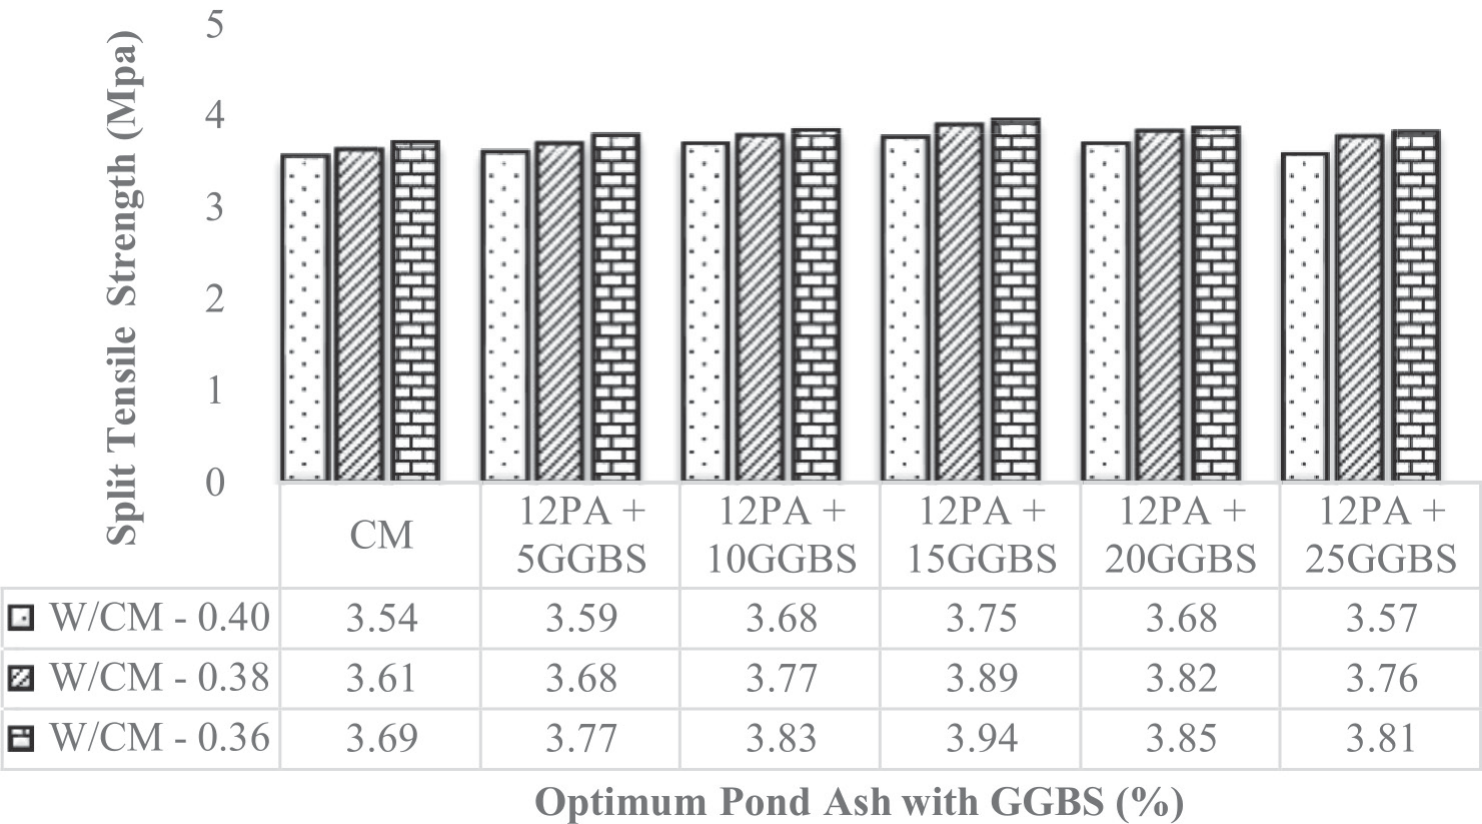
Fig. 5 shows the Split tensile strength variations of different mixes incorporated with PA and GGBS. 15% GGBS found to be optimal replacement percentage for cement with PA. The 12 of PA with 15 of GGBS concrete exhibited maximum split tensile strengths of 3.75 MPa, 3.89 MPa, and 3.94 MPa. The inclusion of higher specific surface area and addition of calcium and silica in concrete are tends to improve the pozzolanic reaction of cement paste [55].
Flexural Strength
Binary Blended Concrete (BBC) and Ternary Blended Concrete (TBC)
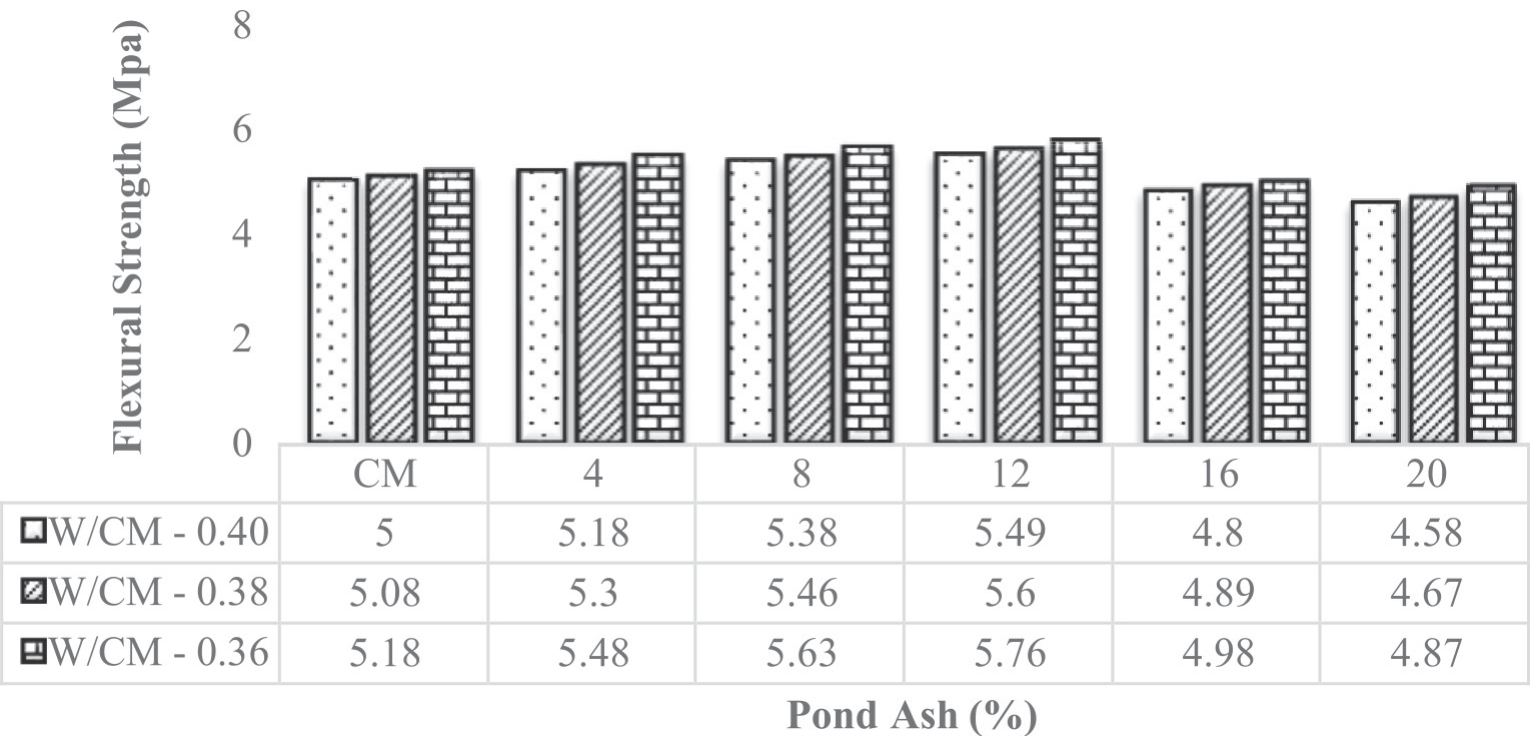
The flexural strength of PA incorporated concrete takes into account and compared with control mix at 28 days as shown in Fig. 6. The scenario of instability in maintaining the flexural strength with gradual reduction of cement in the concrete matrix can be interpreted as follows: In case of OPC replacement with 12% of PA results in the flexural strength increase with standard curing times. The 12 of PA concrete exhibited maximum flexural strength of 5.49 MPa, 5.6 MPa, and 5.76 MPa. Except for mix 16% and 20% of PA, the flexural strength of PA concrete is higher compared to control mix.
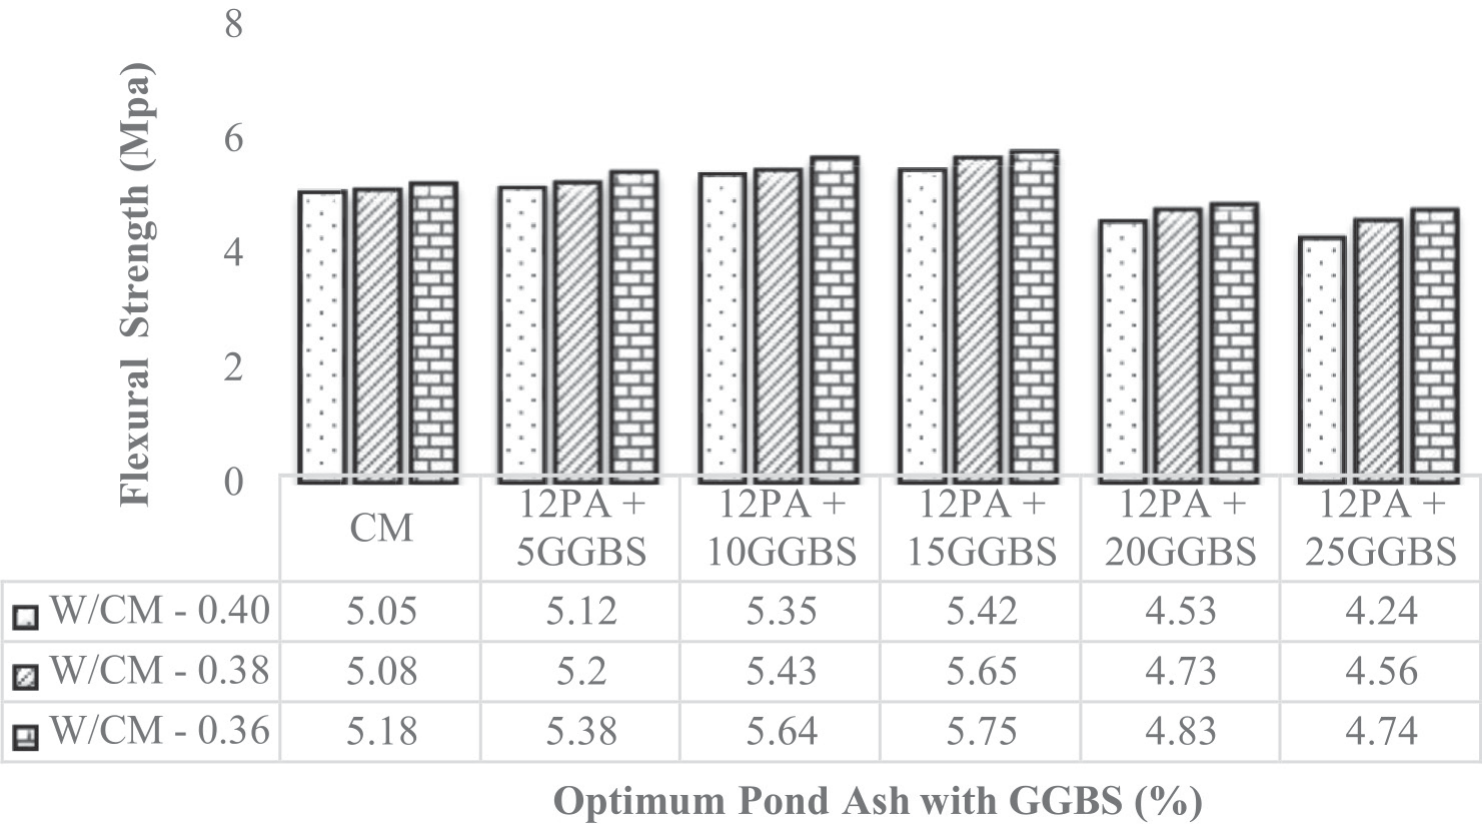
Fig. 7 shows the flexural strength variations of different mixes incorporated with PA and GGBS. 15% GGBS found to be optimal replacement percentage for cement with PA. The 12 of PA with 15 of GGBS concrete exhibited maximum flexural strengths of 5.42 MPa, 5.65 MPa, and 5.75 MPa.
Packing Density and Void Ratio
Packing density (PD) and void ratio (VR) of the optimum PA with different proportions of GGBS added mixes have been calculated. The different water-to-cementitious ratios is essential to determine the packing density. Hence, three different water cement ratios (0.36 to 0.40) have been used in this study. The bulk densities of the mixes for different ratios were calculated to find the solid concentrations.
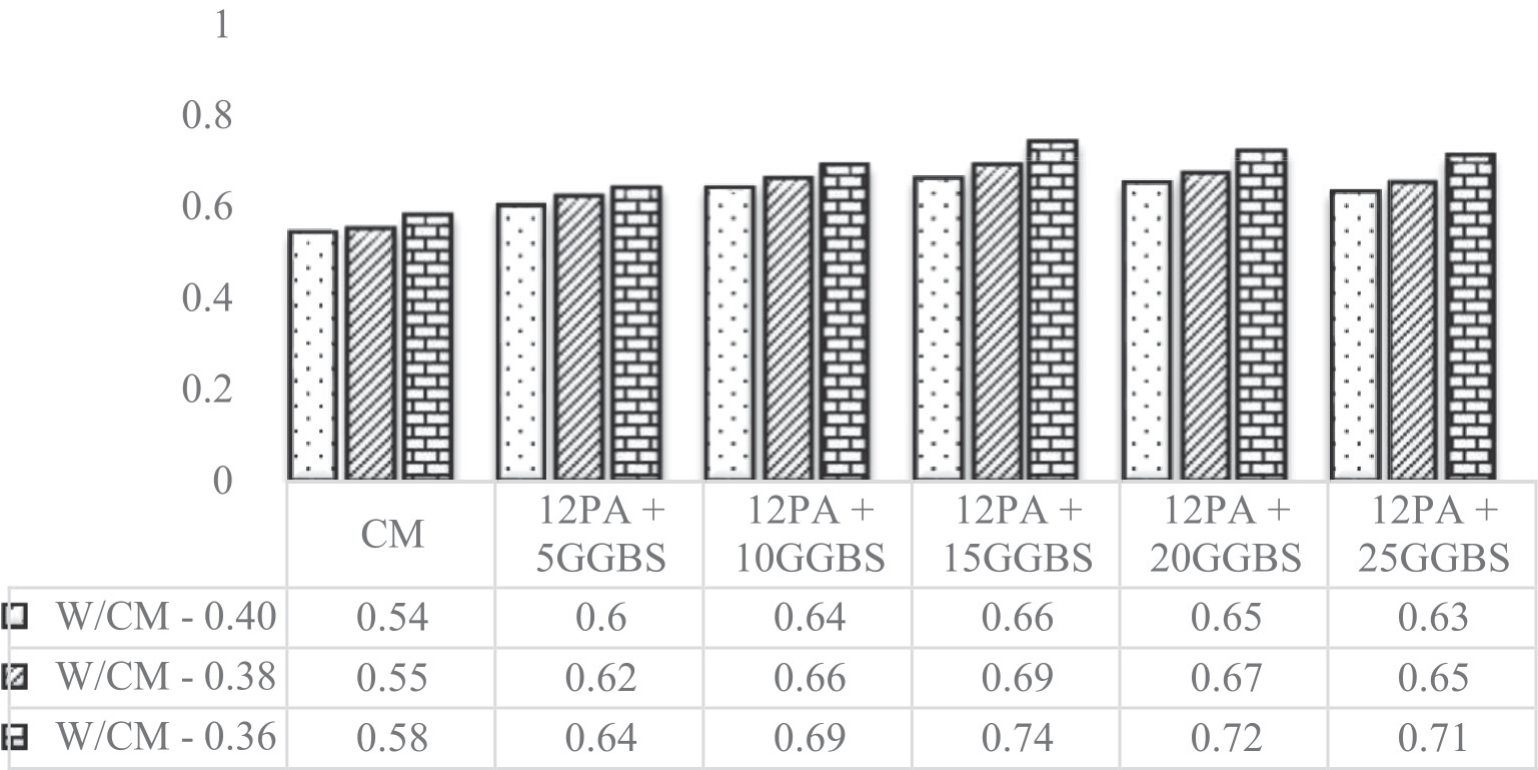
Generally, if the percentage of water increases, the solid concentration would reach a peak value and then decline. The maximum solid concentration value ρmax was taken as the packing density [17]. Fig. 8 shows the packing density variations of cementitious suspension comprising optimum PA with different proportions of GGBS for different water-to- cementitious ratios. Test results indicated that incorporation of TBC considerably increases the PD than CM at all water-to-cementitious ratios. Increasing trend in PD was observed up to 15% replacement in TBC at different water-to-cementitious ratios. Sample PA12+15GGBS obtained higher PD of 0.74 among all the samples tested. At different water- to-cementitious ratios, beyond 15% replacement of TBC, the PD slightly declined to 0.65 and 0.63; 067 and 0.65 and 0.72 and 0.71 for the samples PA12+20GGBS and PA12+25GGBS respectively.
Based on results obtained from the PD test, the voids ratio E (volume of voids to the volume of solid) and the excess water ratio E’ (excess water to solid volume ratio) have been calculated as and mentioned in Equ. (1) and Equ. (2):
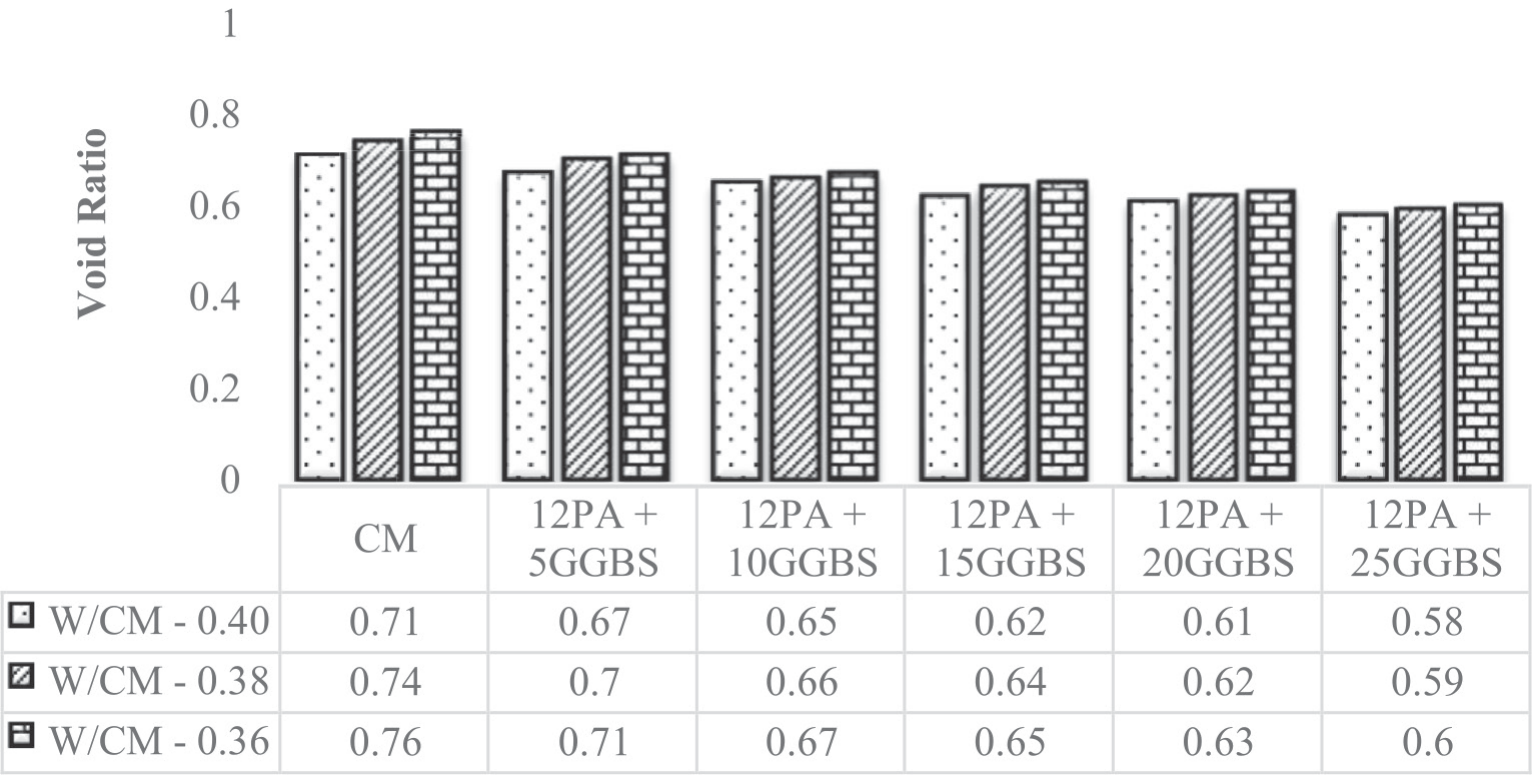
Ew represents water to solid ratio of the cement paste. E’ is the quantity of excess water in the cement paste per solid volume of the cementitious materials [17]. Variations in the voids ratios of the TBC mixes are shown in Fig. 9. Test results confirmed that the incorporation of PA considerably minimized the voids ratio of the cement paste than CM.
Associating the PD variations with relevant VR, the higher increase in PD and reduction in the VR for the TBC. Higher reduction in VR considerably reduces the required quantity of water to fill the voids of cement paste and tends to enhance the free water content. Higher free water present in the cement paste would form water films around solid particles and improves lubrication [56, 57].
Flow Spread
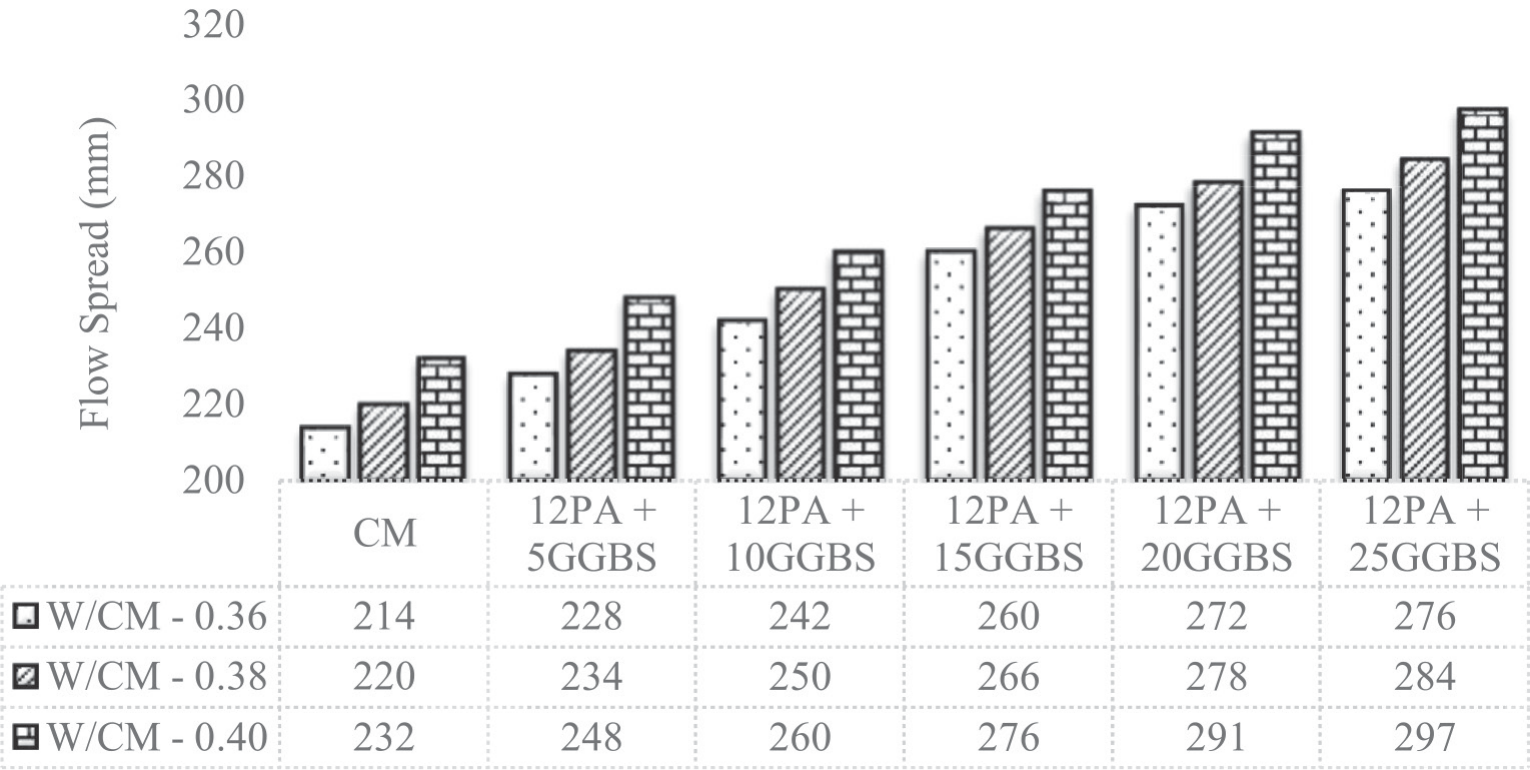
Fig. 10 shows the flow spread variations of the mixes for TBC with water-to- cementitious ratios. Flow test results indicated that the flow spread increases with respect to water-to-cementitious ratios and PA and GGBS content of the mix. Highest flow rate obtained at water-to-cementitious ratios of 0.40. However, water-to-cementitious ratios are not a predominant factor which governs flow spread. Addition of 15% GGBS with 12% PA content escalates the flow spread 276 mm; whereas the flow spread value of the mix comprising 20% and 25% of GGBS with 12% PA found to be 291 and 297 mm. Slight increase in flow spread beyond 25 of GGBS with 12% PA may be due to less water film thickness which tends to restrict the flow ability of the mix.
Flow Rate
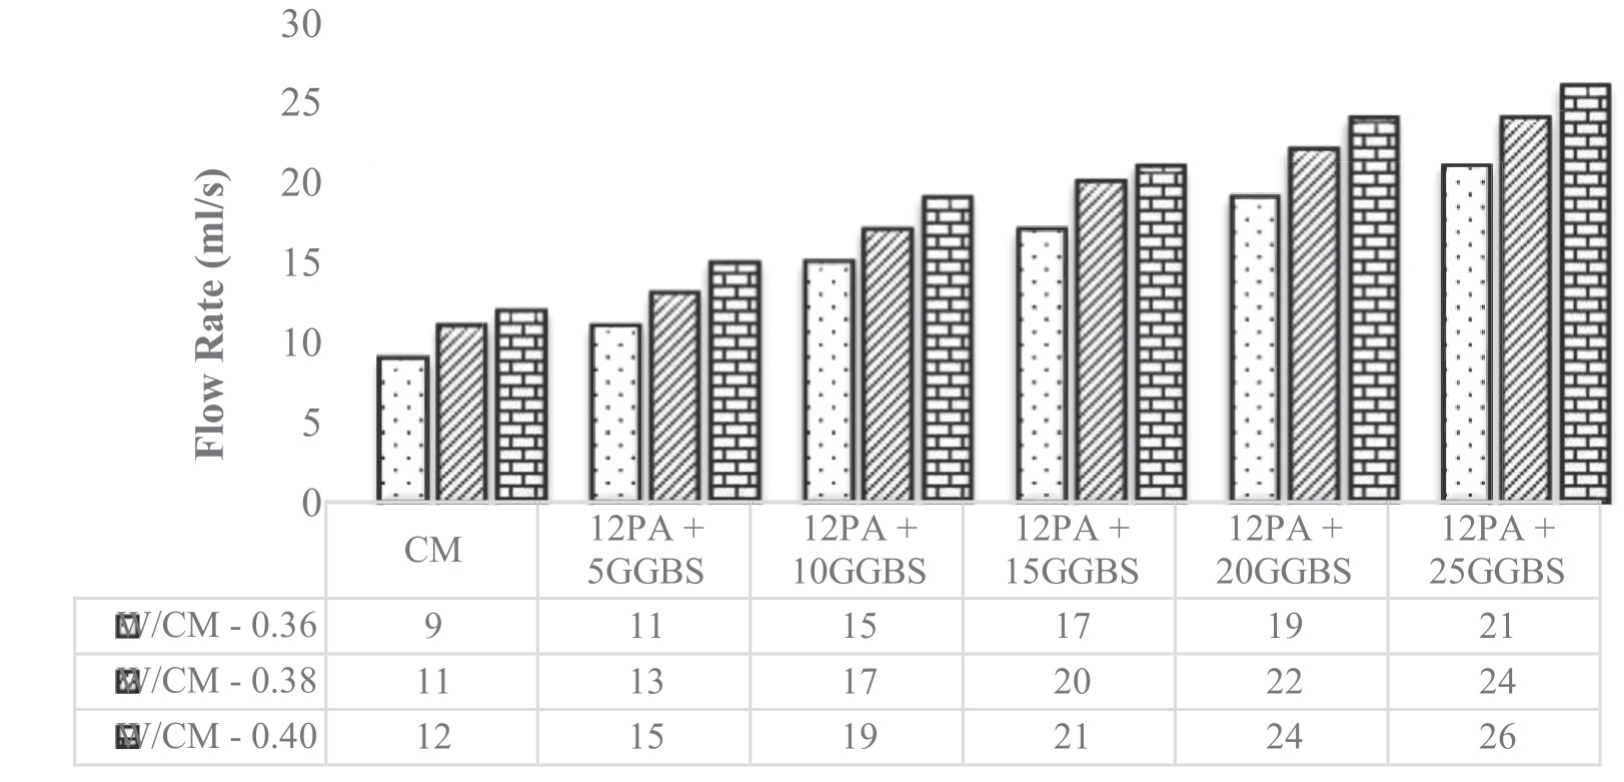
The flow time was calculated during the flow spread test and based on the obtained values the flow rate has been calculated. Fig. 11 shows the flow rate variations of the mixes for different GGBS with optimum PA content. Test results revealed that the increase in water-to-cementitious ratios increases the flow rate but water-to-cementitious ratios alone not a predominant factor which governs flow rate as like flow spread. Highest flow rate was obtained at water-to-cementitious ratio of 0.40 and the flow rate flow rate has significantly improved for the all the mixes than CM. At w/cm of 0.40, the CM had a lower flow rate of 12ml/s and 12PA with 25% of GGBS had a higher flow rate of 26 ml/s.
Micro Structure Properties
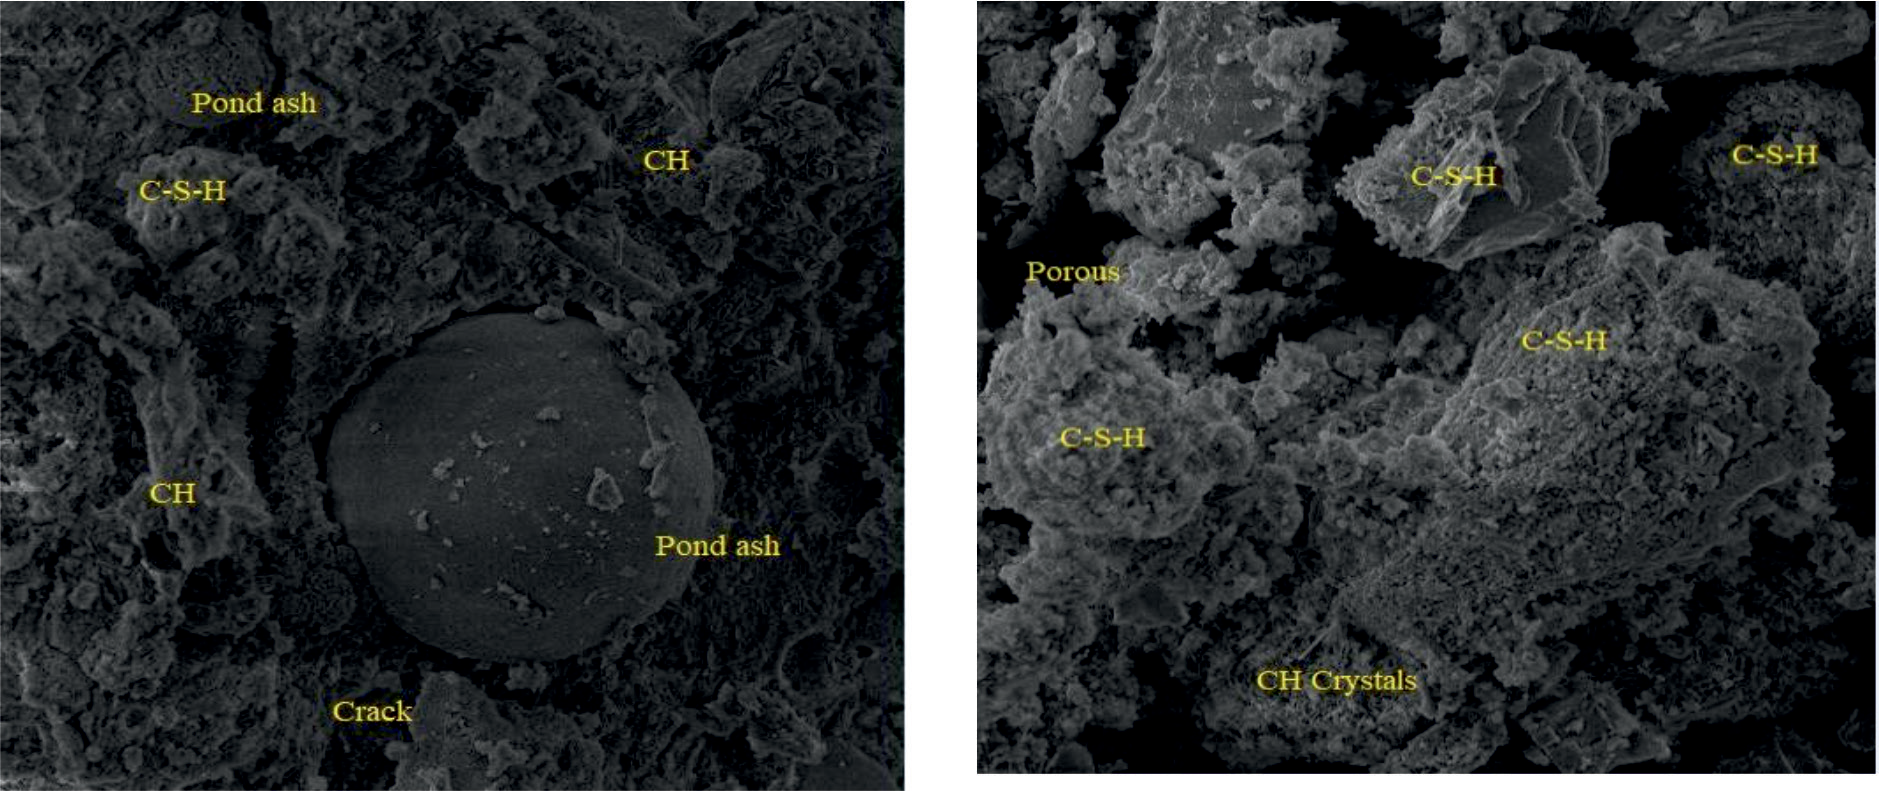
The SEM analysis of CM and 12PA+15GGBS concrete samples after 28 days of curing is depicted in Fig. 12. Calcium–Silica–Hydrate (C–S–H) is the major component found in the concrete matrix of 12PA + 15GGBS mix concrete than CM. The key factors influencing the formation of C–S–H gel are: morphology and particle distribution of ingredients, concentration and orientation of particles, composition and pore structure of the phases [58]. The un reacted PA particle and porous space was observed in CM at 28 days, due to delay of primary hydration [59]. The SEM analysis reveals a denser microstructure in 12PA+15GGBS concrete samples after 28 days of curing, characterized by the depletion of Portlandite (CH) crystals and the presence of additional calcium silicate hydrate gel. At 28 days, the 12PA+15GGBS mix clearly demonstrates a reduced presence of CH crystals compared to CM.
Conclusion
The experimental investigation on influence of PA and GGBS on cementitious suspensions has been conducted and the following conclusions are drawn: – Mix PA12+15GGBS obtained highest compressive,
split tensile and flexural strength value of 28.3, 3.94
and 5.75 MPa respectively. Test results revealed that
the optimal replacement percentage of PA and GGBS
with OPC is 27%. – Test results evident that PA12+15GGBS mix content
could increase the packing density. Addition of
PA and GGBS up to 12% and 15% respectively
considerably increased the packing density and
beyond 15% GGBS addition, slight decrease in
packing density was observed. – For 15% addition of GGBS with 12% PA at water-
to-cementitious ratio of 0.40, the packing density
increase found to be 18.9% than the control mix and
the corresponding void ratio reduction found to be
43.7%. – Increase in GGBS content improved the flow spread
of the mixes. Mix PA12+15GGBS obtained flow
spread of 276 mm. Further, better improvement in
flow rate was obtained for the mix PA12+15GGBS.
Increase in PA content and water- to-cementitious
ratio considerably improved the flow rate of all the
mixes. – The incorporation of PA12+15GGBS mix concrete
leads to the development of a more compact matrix
as a result of reduced (CH) crystal content and
enhanced formation of CSH paste. Moreover, SEM
analysis clearly indicated that the inclusion of PA
with GGBS in concrete does not affect the bonding
characteristics of the concrete during hydration.
PA with GGBS have been proved as a prominent material for improving the rheology, particle packing and mechanical properties of the cementitious suspension. Utilization of PA with GGBS substantially reduces the cement consumption and endorses sustainable development.

