

Introduction
Technological innovation has been a significant activity for enterprises since the concept was introduced in 1912. Companies typically establish R&D organizations to undertake innovation and protect their knowledge. Collaborative technological innovation within companies, such as Edison’s Menlo Park Lab, AT&T’s Bell LABS, and Xerox’s Palo Alto R&D Center, produced groundbreaking technologies in the 20th century. Since the 1980s, enterprises have recognized the importance of external resources and started collaborating with external organizations, referred to as external collaborative technological innovation. As consumer demand for quality consumption increases, enterprises pursue quality investments to gain a competitive advantage. Product quality is a crucial factor affecting consumer purchasing behavior, driving enterprises to make breakthroughs. Collaborative innovation is the latest trend in enterprise technological innovation, which seeks to improve product quality by fostering external cooperation.
Since China’s reform and opening up, industrial clusters consisting of various institutions, including enterprises, specialized suppliers, service providers, and financial institutions, have emerged in various regions. These clusters are concentrated in particular areas and are characterized by competitive and cooperative relationships and interactive business relevance. They are a unique form of spatial economic organization between markets and hierarchical systems. However, small and medium-sized enterprises often lack innovation resources, which can hinder their ability to innovate. Nevertheless, small and medium-sized industrial clusters can form stable and long-term cooperation and communication networks among various actors, which provide an efficient way for cluster enterprises to innovate.
Take the collaborative innovation of the Chongqing motorcycle industry cluster as an example. By the end of 2021, Chongqing had 39 motorcycle production enterprises and 426 supporting enterprises (410 enterprises above the designated size), with an annual output of 10 million motorcycles and 20 million engines. A complete industrial chain and industrial cluster have been formed, from the R&D and production of complete vehicles and key parts to domestic and foreign trade services. As a leader in the Chongqing motorcycle industry, Longxin General Dynamics Co., LTD. (Longxin for short) was founded in 1993. On March 28, 2021, as the result of the collaborative research and development of the high-displacement motorcycle supply chain, “Longxin” launched the Infinity 500ac cross-border retro car with a price as high as 34,980 yuan. For this model, whether it is the design of the motor, interactive AGV instrument, shock absorber, frame, lamps, or other components, “Longxin” will first provide the demand ideas. Then I discussed with the R&D personnel of retailers how to complete the design and form the mass production plan, forming a pattern of collaborative research on the whole supply chain and transforming the pull into interaction, mutual cooperation, and common development. Through the deep interaction at the supply chain level, “Longxin” not only improves the autonomy of the Wuji large displacement motorcycle supply chain, but also enhances its competitiveness in the international high-end market. Xi ‘an Ji Mohui Motorcycle Sales Co., LTD., as the retailer of Longxin Motorcycle, has a long-term cooperative relationship in sales and research and development. In 2020, Wuji’s sales volume in Xi ‘an and even Shaanxi Province was four times that of the previous year. It has been proven that there are deep cooperative activities between the upstream and downstream of the Chongqing motorcycle industry cluster. Coincidentally, as a Zongshen motorcycle retailer, Beijing Hengxin Jucheng International Trading Co., Ltd. has also performed well in recent years. Since 2019, Beijing Hengxin, under the leadership of Zongshen Factory, has changed its original thinking and entered the retail industry, opening five new stores in Beijing within two years. In addition to stepping up efforts in retail, Beijing Hengxin operates Zongshen Motorcycle in synergy, and quality innovation is constantly strengthening.
In conclusion, collaborative innovation in industrial clusters is a key strategy for companies to improve product quality, access new markets, and reduce costs. The Chongqing motorcycle industry cluster is an excellent example of successful collaborative innovation, where companies were able to leverage each other’s strengths to develop new products and expand their businesses. As more industries and regions in China adopt collaborative innovation strategies, we can expect to see more breakthroughs and innovations that will drive economic growth and competitiveness. However, they still face the challenge of figuring out how to collaborate effectively and innovate to achieve these goals.
This paper investigates research and development cooperation behaviors among enterprises to improve product quality in the context of industrial clusters, addressing three key questions. Firstly, is there an incentive for upstream manufacturers to collaborate with downstream retailers in the cluster? Secondly, what is the optimal collaboration approach for the upstream manufacturer: to collaborate with one downstream retailer, both retailers or not at all? Lastly, how do the spillover benefits of enterprise collaboration, industrial innovation level, and sensitivity of consumer demand for quality improvement affect the collaboration model between enterprises? To answer these questions, we construct a three-stage dynamic game model and analyze the equilibrium.
The main findings of this study are that the incentive for upstream manufacturers to cooperate with downstream retailers in an industrial cluster to improve product quality does exist, but the optimal way of cooperating depends on a variety of factors. Specifically, the authors found that working with two retailers is generally better than working with just one or none at all, but it depends on the level of information sharing and the level of competition. In addition, the paper emphasizes the importance of spillover benefits and consumer demand for quality improvement.
Industrial clusters are defined by the concentration of social capital, regular internal information exchange, and symmetric information sharing between firms. Despite extensive and in-depth studies on quality improvement, spillover effects, and R&D collaboration in the existing literature, there are fewer studies on quality improvement co-innovation between upstream and downstream firms in the supply chain within the context of industrial clusters. Furthermore, only a few of these studies consider the spillover benefits of investing in improving product quality. Consequently, this study contributes to the existing literature in two ways. Firstly, it considers the level of industry innovation and consumer sensitivity to product quality improvement, in addition to the spillover effects. Secondly, it provides a deeper understanding of the complex dynamics of R&D cooperation in industrial clusters, offering insights that can help firms make more informed collaboration and innovation decisions.
Overall, the contribution of this study is to provide a deeper understanding of the complex dynamics of R&D collaboration in industrial clusters and provide insights that will help firms make more informed, collaborative, and innovative decisions. The findings of this study also contribute to the broader literature on industrial clustering and innovation, as they shed light on the effectiveness of collaboration as a strategy to improve product quality.
Literature Review
Many scholars at home and abroad have done research on the research and development of collaborative innovation. There are mainly three types of studies. The first type is mostly between horizontal collaboration enterprises. Duysters [1] believes that the relationship between the complexity of alliance members and the innovation capability of alliances presents an inverted U-shaped shape. Amaldoss [2] established a theoretical basis for the research on the R&D input behavior of collaborative innovation. By establishing a game model for two competing alliances, he studied different alliance structures, income distribution situations, and cooperative behaviors of alliance members under the market rate of return. Hou Guangming [3] et al. studied the horizontal R&D innovation collaboration of duopoly enterprises under the duopoly competition environment, assuming that there are exogenous and endogenous mixed spillover effects in the R&D innovation of enterprises. The second type of research is mostly between vertical cooperative enterprises. Cassiman and Veugelers [4] studied the manufacturing industry in Belgium and found that most collaboration agreements are vertical or with research institutions rather than horizontal. They found that vertical collaboration is driven by external and complementary knowledge rather than sharing high costs or high risks. Liu Wei and Zhang Zijian [5] established a two-level vertical collaborative R&D model composed of manufacturers and suppliers, studied bilateral moral hazard, collaborative R&D investment, and other issues, and discussed the design of a cooperative contract and the optimal R&D cost sharing conditions for manufacturers to invest in R&D under the different R&D motives of manufacturers and manufacturers. Xiao Xiangping [6] et al. considered two upstream manufacturers to carry out R&D innovation activities in the two-to-one supply chain system, and the downstream suppliers encouraged the upstream manufacturers to carry out collaborative R&D innovation. The above study analyzes the motivation of manufacturers and retailers for R&D collaboration from different perspectives. The third type of research is mostly between enterprises in industrial clusters. Wang Shuen [7] established a game model of innovation and imitation for enterprises in industrial clusters when carrying out R&D cooperation, calculated the benefits of enterprises under innovation and imitation strategies in different time intervals, and solved the mixed strategy solution of enterprise innovation choice. This paper provides a theoretical reference for the strategic choice of technological innovation by enterprises in industrial clusters and puts forward some policy suggestions for further strengthening the innovation impetus of industrial clusters.
In view of the factors affecting R&D collaboration between enterprises, some scholars have conducted fruitful exploration and research on spillover benefits between enterprises. There are mainly three views. The first view holds that spillover benefits between enterprises have a positive effect on R&D collaboration between enterprises. Yu Yuanyuan et al. [8] believe that the existence of a large number of suppliers enables new enterprises to make use of geographical proximity and frequent social interactions of individuals within the cluster through industrial cluster embedding, which facilitates cooperation, mutual assistance, knowledge spillover, and the spread of tacit knowledge. At the same time, Liu Yu et al. [9]. believe that the more knowledge spillover, the stronger the shared knowledge foundation for cooperative innovation, the stronger the knowledge integration, and the easier the new technology will be produced. Chuang Cao Yong [10] selected effective sample data of 339 managers or R&D personnel from 122 enterprises in strategic emerging industries to analyze the internal relationship among knowledge spillover effect, innovation willingness, and innovation ability under the background of open innovation. The results show that the knowledge spillover effect and innovation ability have significant positive effects. The second view is that spillover benefits bring not only benefits but also challenges to the cooperation between enterprises. Zhao Hua et al. [11]. believed that the characteristics of industrial clusters, such as industrial proximity and geographic concentration, provided a good foundation for generic technology cooperative innovation, while technology spillover brought great difficulty for cooperative innovation, which made cluster enterprises face more special cooperative competition relationships when conducting technology cooperation. Tan Weijia [12] believes that due to information asymmetry and lack of trust, R&D cooperation between enterprises is easy to fall into the “prisoner’s dilemma”. The reasons are as follows: First of all, in the process of R&D cooperation, each partner’s own knowledge may spill over. If a partner’s knowledge spill will obviously improve the competitive position of other partners, or even affect its own competitive position, the partner will choose “no cooperation”. The third type of research is mainly to further study how the spillover effect plays its role. Yi Yuyin [13] et al. studied the finite rational duopoly repeated game model based on the spillover effect. He believes that the rationality of oligarchs determines whether the repeated games of oligarchs can reach Nash equilibrium. The spillover effect will increase the probability that the game will reach Nash equilibrium. Hou Guangming and Ai Fengyi [14] studied the horizontal R&D cooperation game model of duopoly under mixed spillover (that is, endogenous spillover and exogenous spillover) and found that collaborative R&D will lead to the maximum spillover level, while independent R&D will have the lowest spillover level, and the output and profit of collaborative R&D are higher than independent R&D. In addition, Zhou Xiaohan et al. [15]. established a three-stage dynamic game model and found that, first of all, different from the static game, in the sequential output competition, only when the spillover level is in a low range will the leader and follower enterprises establish R&D cooperation. The above research further studies the factors influencing spillover benefits by establishing a game theory model and analyzing empirical data. In conclusion, it is found that there are few studies on the influence of spillover effects on the choice of R&D cooperation between upstream and downstream enterprises under the background of industrial clusters. In the model constructed in this paper, the influence of spillover benefits on the choice of R&D collaboration scenario is considered.
With the improvement of people’s living standards, the price of products is no longer the only factor affecting the purchase decision. When people choose and buy goods, they also put forward higher requirements for product quality. Therefore, in order to meet consumer demand and improve product competitiveness, enterprises need to carry out research and development cooperation to improve product quality. At present, the research on quality improvement is getting deeper and deeper. There are two types of research. The first type mainly analyzes the factors that motivate manufacturers and retailers to improve quality in the single-channel supply chain. Wang and Shin [16] studied contract design, in which manufacturers incentivize retailers for quality innovation. Liu Cong et al. [17] considered the impact of manufacturers’ marketing efforts on manufacturers’ quality innovation. Zhu Lilong et al. [18] studied quality control contract design in a two-level supply chain based on game theory and principal-agent theory. The expected income function model of the producer and the buyer is established. The producer decides the level of investment in the production process and the level of product quality prevention. The buyer makes quality assessment decisions and determines the level of quality inspection of its products. Zhu Lilong [18] established the strategic product quality control model of the distribution channels of duopoly retailers based on the dynamic analysis of the four stages of the Stackelberg game and analyzed the influence of different parameter variables in the structure of traditional and mixed retail channels on the development of the product quality control strategy. It also discusses how to formulate product quality control strategies in different channel structures under distributed decision-making and centralized decision-making. With the rise of the network platform, online channels begin to be included in the supply chain, and more and more enterprises adopt the dual-channel situation to sell products. Therefore, relevant research on quality investment has also expanded to the field of dual-channel. The second type of research focuses on the multi-channel supply chain. Chen [19] found that quality improvement could be achieved by introducing new channels, and the performance of the supply chain could be improved. He also analyzed the influence of three different channel structures (traditional retail channel, direct channel, and dual channel) on price and quality under decentralized and centralized decision-making. Liu Hong et al. [20] set up a random market demand function from the perspective of quality improvement, built a two-channel game model involving manufacturers and suppliers, and analyzed the optimal decision of the two participants. Wang Wenbin et al. [21], based on the perspective of consumer utility, In the dual-channel supply chain, models of no research and development, manufacturers’ independent quality research and development, and cooperative research and development are established, respectively, and comparative analysis is carried out. Finally, a two-part pricing contract is introduced to improve the R&D enthusiasm of upstream and downstream enterprises. All the above studies have studied the factors affecting quality improvement from different supply chain perspectives, but relatively few studies have considered spillover effects in product quality investment improvement, and few studies have paid attention to the collaborative innovation between upstream and downstream enterprises for quality improvement under the background of industrial clusters. In view of this, this paper builds a model of collaborative innovation between upstream and downstream enterprises for quality improvement against the background of industrial clusters.
To sum up, in the existing literature, although research on quality improvement, spillover effects, and R&D collaboration is extensive and in-depth, few studies have investigated collaborative innovation between upstream and downstream enterprises in the supply chain for quality improvement within the context of industrial clusters [22-28]. Moreover, only a few studies have considered spillover benefits in investment improvements in product quality [29-33]. Therefore, in addition to spillover benefits, this paper also takes into account industry innovation levels and consumer sensitivity to product quality improvement. Industrial clusters exhibit the characteristics of social capital agglomeration, frequent internal information exchange, and symmetrical information between enterprises. This paper aims to address this gap by constructing a dynamic game model of complete information to analyze the cooperative R&D situation between one manufacturer and two retailers in an industrial cluster. The upstream manufacturer is considered the “chain master”, and the downstream retailer is the cooperative object. We explore the motivation, object selection, and behavioral mechanisms that influence vertical R&D cooperation between upstream and downstream enterprises in order to fill the research gap.
Problem Description and Hypothesis
This paper analyzes an industrial cluster’s upstream and downstream supply chain, which includes an upstream manufacturer and two downstream retailers. The retailers order products from the manufacturer to sell to the end market. Assuming complete information, the research investigates the risk-neutral vertical cooperation between manufacturers and retailers to enhance product quality. Both players are assumed to be bound by rationality and follow their self-interest to maximize their benefits. Using this assumption, we establish a Stackelberg price competition decision-making model for supply chain R&D collaboration that includes both upstream manufacturers and downstream retailers. There is one manufacturer in the market with a volume of Q1 and two downstream retailers with orders of q1 and q2. So the total output of the two firms is Q = q1 + q2. The inverse demand function of retailers is p = A – Q, where. A>0 is the market size, es4. In this paper, it is assumed that the R&D input function is in the form of a quadratic function, 12̄ kn where k>0 2 is the innovation investment coefficient. The larger k is, the higher the technical level of the industry, and the higher the cost of innovation at a certain level of innovation. High R&D costs have the feature of diminishing marginal returns; that is, unit R&D costs increase with the increase in R&D investment. Thus, if there is no technological mutation, further technological improvement requires more investment in resources. r∈[0.1] is the spillover coefficient, representing the marginal crossover effect of R&D input on enterprise i, which can be understood as the spillover rate or the proportion of shared knowledge between cooperative enterprises. Three scenarios are considered in this paper. The first scenario is the one in which both parties do not cooperate and is represented by coincidence as NN; the second scenario is the one in which the manufacturer collaborates with only one retailer and is represented by coincidence as NW; the third scenario is the one in which the manufacturer collaborates with both retailers and is represented by coincidence as VV.
Based on the background of industrial clusters, the following assumptions are given:
(1) In order to highlight the research focus, this paper assumes that the production cost of the manufacturer, the sales cost of the retailer, and other costs are zero except the innovation cost.
(2) Similar to Liu Wei et al. [5], it is assumed that R&D improves the quality of the final product and therefore does not increase the marginal cost.
(3) The internal information of the upstream and downstream of the industrial cluster is symmetrical, and due to the confidentiality of the upstream and downstream contracts, there is no leakage of wholesale price, innovation strategy, or cost sharing strategy between the supply chain.
The game order of this paper is as follows:
1. Retailers and manufacturers determine their investment levels to achieve quality maximization.
2. After identifying demand, manufacturers adjust their pricing strategy based on the impact of demand and the innovative investments made by retailers.
3. Retailers then simultaneously determine their output levels.
The symbolic meanings of variables and parameters involved in the model are described in the table.
Table 1.
Symbol description of model parameters.
Strategy NN (Uncooperative Situation)
Strategy mix NN means no collaborative quality improvement innovation. The profit function of a manufacturer and retailer can be expressed as:
According to the game order, the order quantity in equilibrium can be obtained as follows:
Wholesale price:
Retailers’ and manufacturers’ profits were:
Strategy VN (Collaboration Case 1)
Strategy mix means that only one retailer (denoted as α1) conducts quality collaborative innovation with the upstream manufacturer, while the other retailer is denoted as α2, and the manufacturer represents s that the profit function of the manufacturer and the retailer can be expressed as:
According to the game order, the order quantity in equilibrium can be obtained as follows:
The profit of retailers and manufacturers is
Strategy VV (Collaboration Scenario 2)
Strategy combination VV represents the situation of innovation in quality cooperation between two retailers and upstream manufacturers. The profit function of a manufacturer and retailer can be expressed as:
According to the reverse solution of the game order, order in equilibrium can be obtained:
Wholesale price:
Retailers’ and manufacturers’ profits were:
The inverse solution method was used to solve the above model, and the optimal decisions and corresponding benefits of members under different strategy combinations were obtained, as shown in the figure below.
The Optimal Decision and Corresponding Income Under Different Circumstances
Analysis and Discussion
By comparing the equilibrium profit of retailers and manufacturers in different situations, the influence of the cooperation situation on the decision-making of supply chain members is analyzed.
Retailer 1 Profit Comparison in Different Collaboration Scenarios
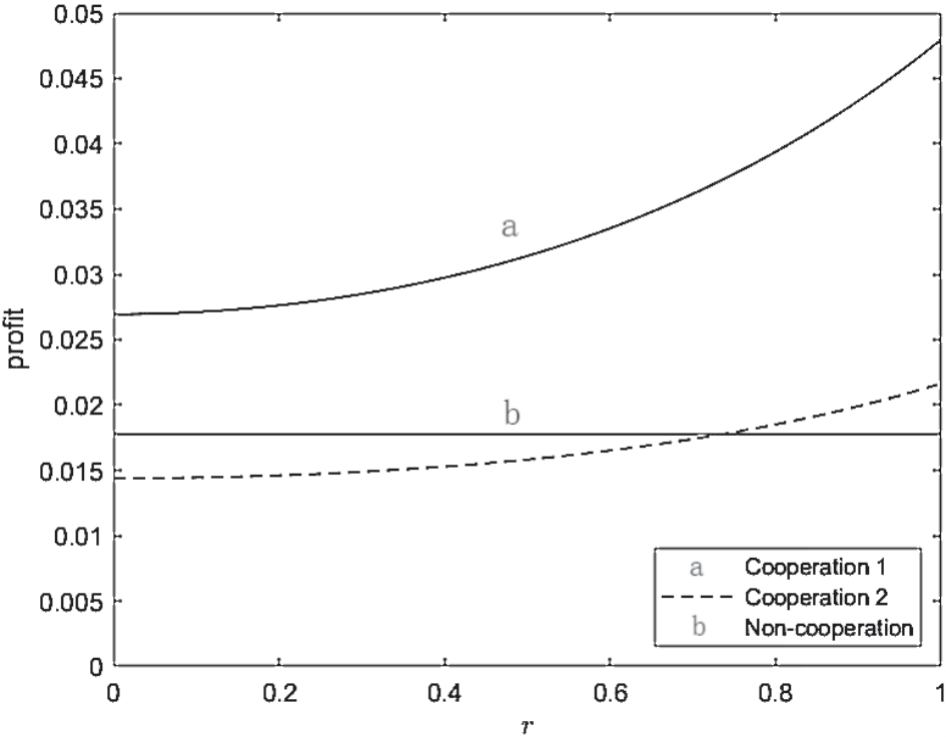
Fig. 1 simulates the expected profit of the retailer. After conducting numerical simulations under different circumstances, it was discovered that the profit for cooperation situation 2 exceeds that of cooperation situation 1. For retailers, the value of the spillover rate between cooperating enterprises, or the proportion of shared knowledge, is crucial. When the spillover rate
is significant, the profit in cooperation situation 2 is
greater than in the non-cooperative case, and the profit
in the non-cooperative case is higher than in cooperative case 1. Retailers should consider the spillover rate when deciding which scenario is best for them. In this case, retailer 1 had the highest profit in the cooperation case and maintained a higher profit than the other cases, despite any fluctuations.
Through numerical simulation, Fig. 2 displays the expected profit of retailer 1 in various circumstances. Retailer 1’s profit in cooperative situation 1 consistently outperforms that of cooperative situation 2 and the non-cooperative situation. In cooperative situation 1, profit decreases with an increase in the innovation investment coefficient, k. Higher k values signify higher industrial technology levels and innovation costs at a certain innovation level. High R&D costs have the characteristic of diminishing marginal returns, meaning that unit R&D costs increase as R&D investments increase. Therefore, in the absence of technological mutation, further technological improvement necessitates more resource investment. In cooperative situation 2, retailer 1’s profit increases with an increase in k. Both retailers participate in the manufacturer’s cooperation under this circumstance, indicating a positive impact. However, it is critical to consider diminishing marginal returns since the effect of the k value is less beneficial in the later period than in the earlier period.”
Fig. 3 simulates the expected profit of retailer 1 under different circumstances through numerical simulation. As can be seen from the figure, the profit of retailer 1 in cooperative situation 1 is always higher than that in cooperative situation 2 and the non-cooperative situation. In cooperation scenario 1, profits increase with the increase of m (the sensitivity coefficient of consumer demand to product quality improvement (innovation premium level). The larger m is, the more sensitive consumer demand is to product quality improvement. Therefore, it is necessary to consider the nature of the product and consumer demand for the product. For daily necessities, consumers are not sensitive to the quality improvement of the product. For example, the quality improvement of rice leads to a premium for the product. However, when considering products with higher technology levels, such as computers and mobile phones, consumers are more willing to pay more for quality improvement. Each new iPhone is accompanied by an improvement in quality or innovation. At this time, consumers are still willing to pay for it, indicating that consumers at this time have a high sensitivity coefficient to product quality improvement. In the case of cooperation 2, the profit of retailer 1 decreases with the increase of m. In this case, both retailers participate in the cooperation with the manufacturer, indicating that m does not play a positive role for retailer 2 in the case of cooperation 2.
Proposition 1: From the profit graph of retailer 1 about below r, m and k obtained by numerical simulation, it can be concluded that in three situations, it is more beneficial for retailer 1 to choose cooperative situation 1. The profit here is higher than in the other two scenarios. This suggests that in the collaboration scenario, the retailer who collaborates first has an advantage, and the retailer who collaborates first does not want other retailers to participate in the collaboration with the manufacturer.
Profit Comparison of Retailer 2 in Different Collaboration Situations
Fig. 4 simulates the expected profit of retailer 2 under different circumstances through numerical simulation. As can be seen from Fig. 1, the profit of cooperation situation 2 is higher than that of cooperation situation 1. For retailer 2, when the value of r is large enough, the profit of choosing the cooperation situation 2 will be higher in the non-cooperation situation. Compared with cooperation situation 1, the profit of the non-cooperation situation is higher than that of the cooperation situation. In collaboration case 1, the profit decreases as the value increases. It can also be understood that in the case of collaboration scenario 1, only Retailer 1 participates in the collaboration with the manufacturer. Therefore, the profit of retailer 1 increases with the increase in value of r, while the profit of retailer 2 decreases with the increase in value of r.
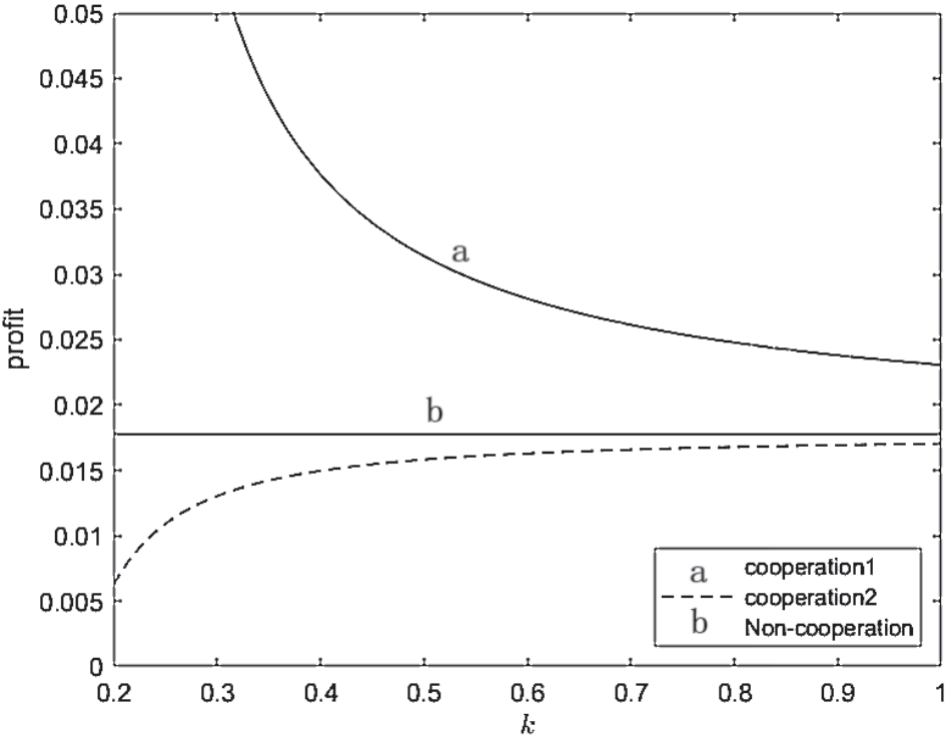
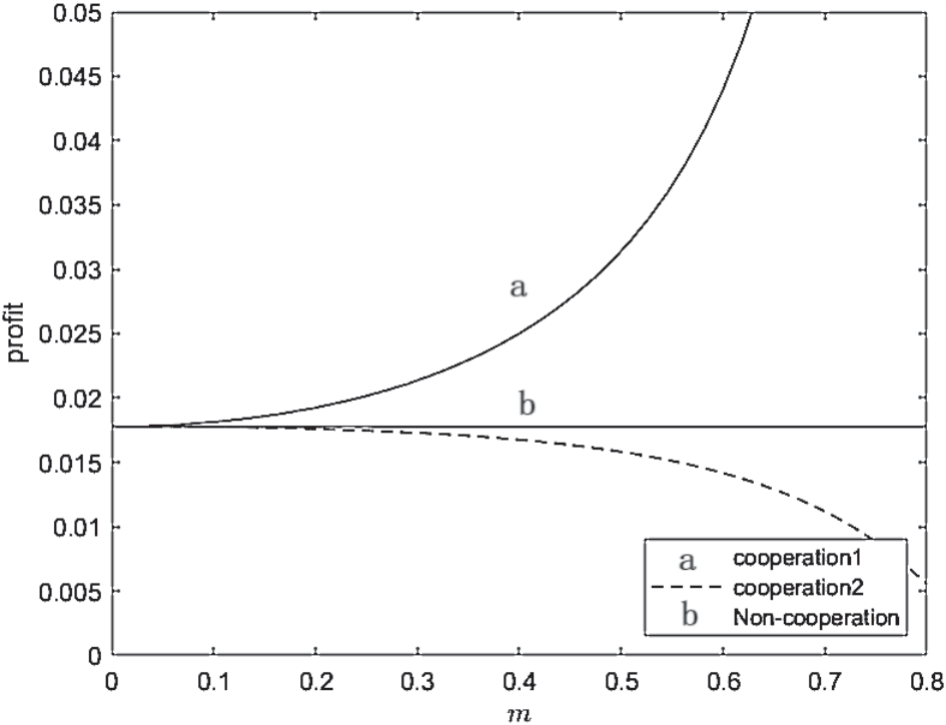
Fig. 5 simulates the expected profit of retailer 2 under different circumstances through numerical simulation. As can be seen from the figure, cooperation scenario 2 has higher profits than cooperation scenario 1. For retailer 2, when the value of “k” is large enough, cooperation scenario 2 will have higher profits than cooperation scenario 1. Considering the non-cooperative situation, the higher profit of retailer 2 indicates that retailer 2 chooses the non-cooperative situation more favorably.”
Fig. 6 simulates the expected profit of retailer 2 under different circumstances through numerical simulation. As can be seen from the figure, the profit of retailer 2 in the non-cooperative situation is always higher than that in the cooperative situation. In cooperation scenario 1, profit increases with the increase of m (the sensitivity coefficient of consumer demand to product quality improvement (innovation premium level). The larger m is, the more sensitive consumer demand is to product quality improvement.
Proposition 2: For retailer 2, the profit is relatively considerable in the non-cooperative situation and cooperative situation 2, because retailer 2 does not participate in the cooperative situation in cooperative situation 1, so the profit is relatively low. But for r, m, k value changes, retailer 2’s profit will also change under different circumstances. For cooperation scenario 2, retailer 2’s profit increases with the increase of r, m and k.
Profit Comparison Between Manufacturers in Different Collaboration Scenarios
Fig. 7 simulates the expected profit of manufacturers in different situations through numerical simulation. As the value increases, the profit of the manufacturer increases in different situations. For manufacturers, the profit in case 2 of collaboration is greater than that in case 1, and both are greater than that in case of non-collaboration. The effect of the r value on cooperation in case 2 is more obvious. This indicates that for manufacturers, the case of collaboration 2 is better than the case of collaboration 1 and is greater than the case of non-collaboration. This indicates that manufacturers are more motivated to promote collaborative case innovation and are more inclined to cooperate with two retailers.
Fig. 8 simulates the expected profit of manufacturers in different situations through numerical simulation. It is known that with an increase in k value, the manufacturer’s profit decreases under different circumstances. It has to do with diminishing marginal returns. For the manufacturer, the cooperative case is better than the uncooperative case, and the cooperative case 2 is better than the cooperative case 1 as the flight value increases.
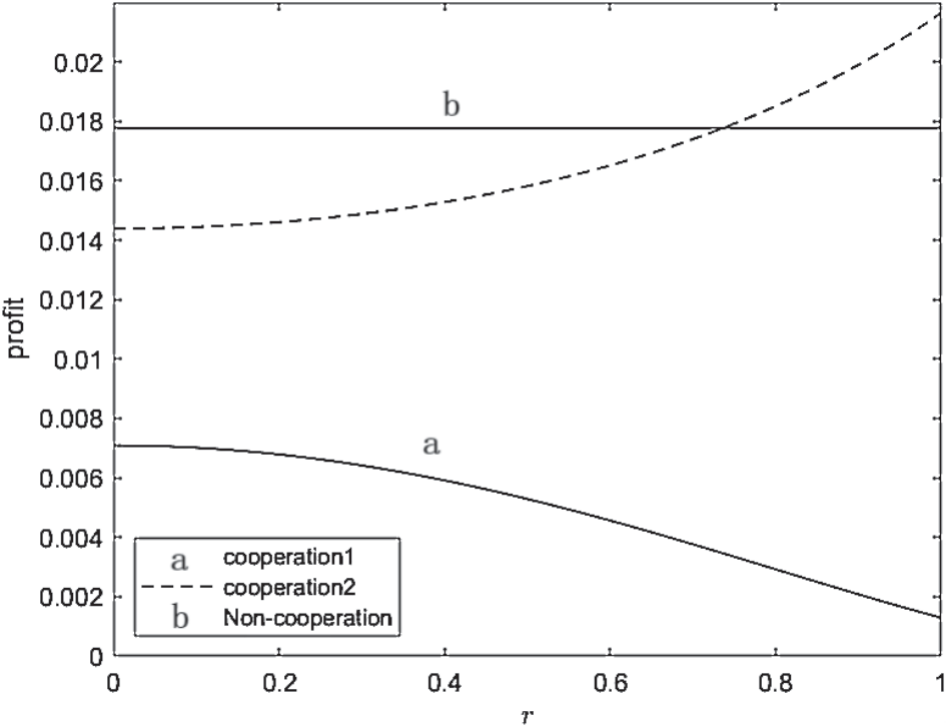
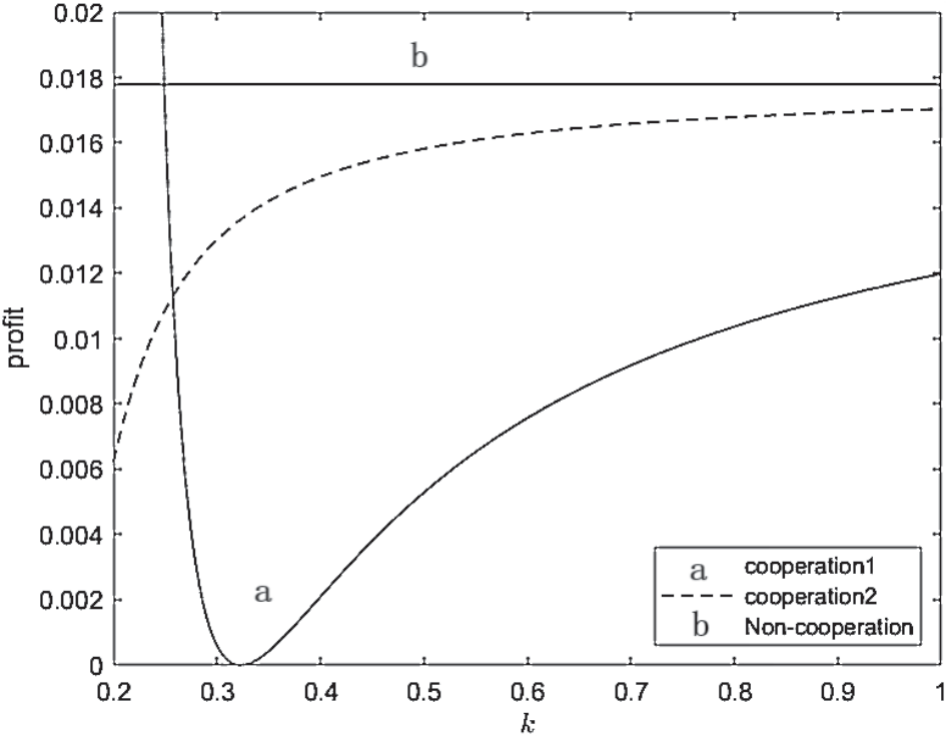
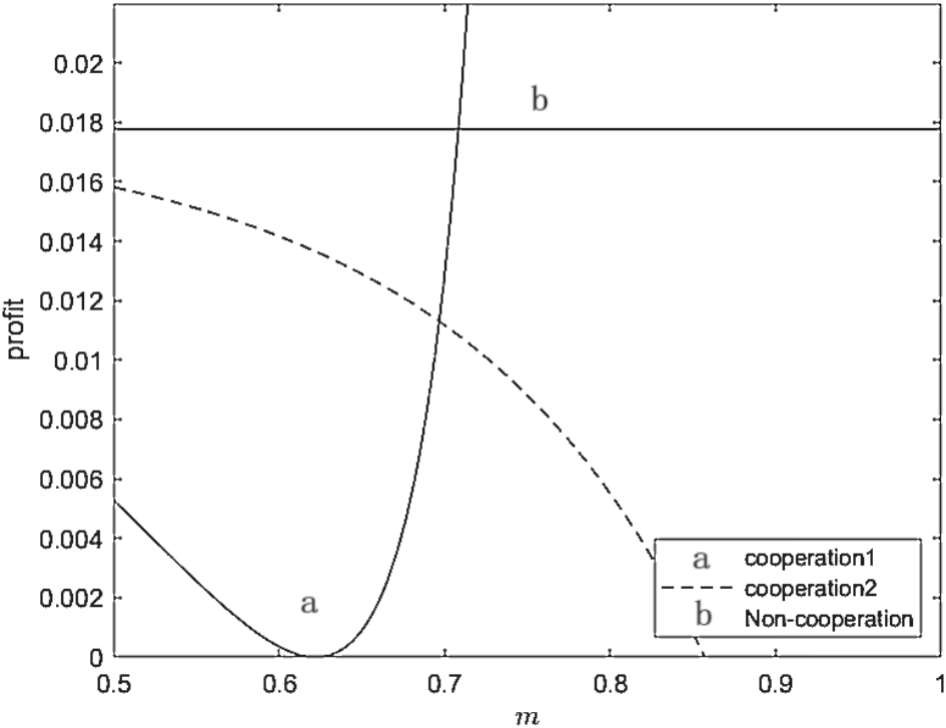
Fig. 9 simulates the expected profit of manufacturers in different situations through numerical simulation. As the m value increases, the manufacturer’s profit increases in different situations. The larger the m is, the higher the sensitivity of consumer demand to the improvement of product quality. This indicates that manufacturers are more inclined toward industries with a higher technological level in the case of innovation and collaboration, and the larger the m value, the higher the profit. In the comparison of cooperation scenario 1 and cooperation scenario 2, when m is small, cooperation scenario 2 is more beneficial, but when m is large, cooperation scenario 1 is more beneficial.
Profit Comparison Between Manufacturers and Retailers in Different Collaboration Scenarios
Fig. 10 numerically simulates the profit comparison between retailer and manufacturer in case 1 shows that the manufacturer’s profit is greater than retailer 1’s profit than retailer 2’s profit, indicating that in case 1’s profit is the largest and the manufacturer is more motivated to promote innovative cooperation. In collaboration scenario 1, retailer 2 does not participate in the collaboration scenario, so the profit is lower. It shows that the profit in the cooperative condition is higher than the profit in the non-cooperative condition. Indicates that retailers are motivated to participate in collaborative situations. The profits of both manufacturer and retailer 1 in the cooperative situation increase with the increase in value r, indicating that the more spillover benefits, the more beneficial to the profits in the cooperative situation of both parties.
Fig. 11 numerically simulates the profit comparison between retailer and manufacturer in collaboration scenario 1. The profit of the manufacturer is larger than that of retailer 1 and larger than that of retailer 2, indicating that in collaboration scenario 1, the manufacturer makes the most profit and is more motivated to promote innovative collaboration. In collaboration scenario 1, retailer 2 does not participate in the collaboration scenario, so the profit is lower. It shows that the profit in the cooperative condition is higher than the profit in the non-cooperative condition. Indicates that retailers are motivated to participate in collaborative situations. The profits of both the manufacturer and the retailer involved in the cooperative situation decrease as the value k increases, which is related to diminishing marginal returns. The profit comparison between retailer 1 and retailer 2 is related to the change of k, and the value of k is small. However, when the profit of retailer 1 with a larger value is smaller than that of retailer 2, the profit of retailer 1 is larger than that of retailer 2.
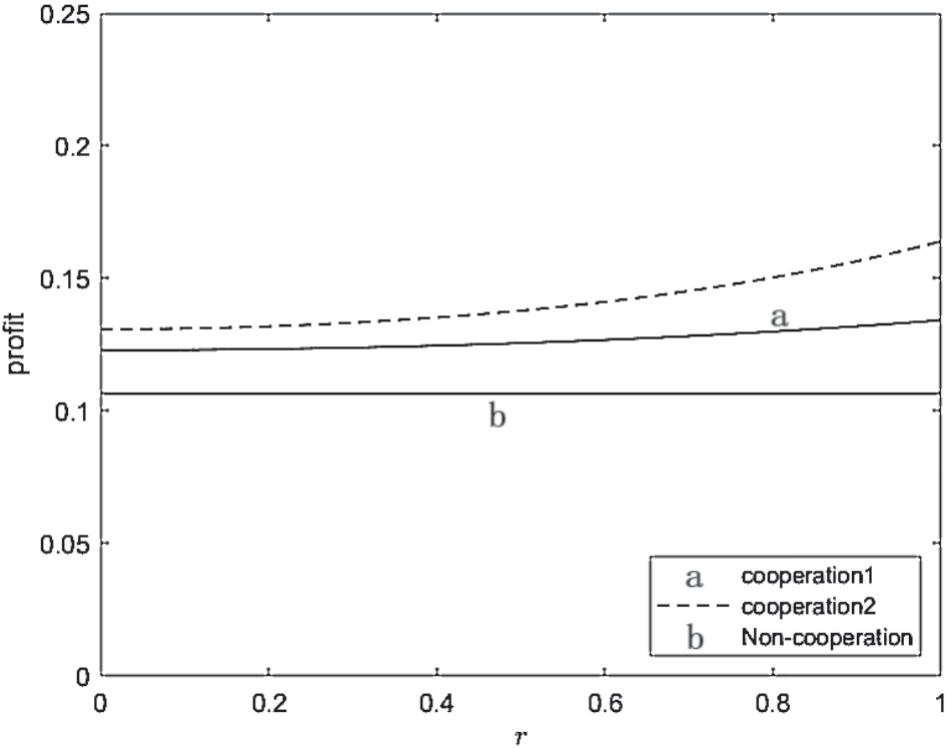
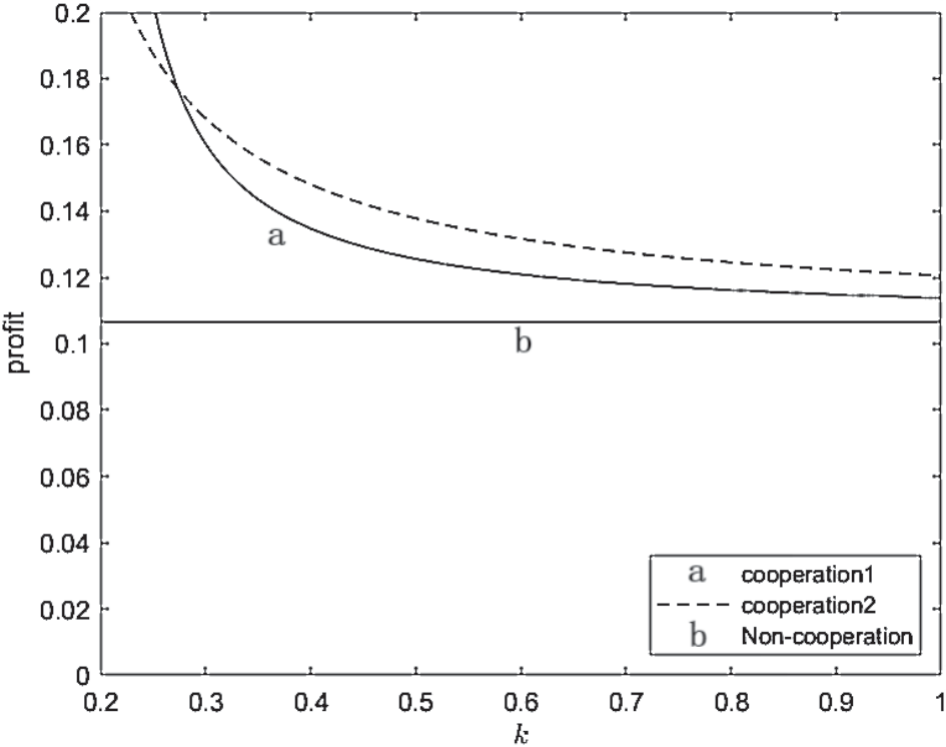
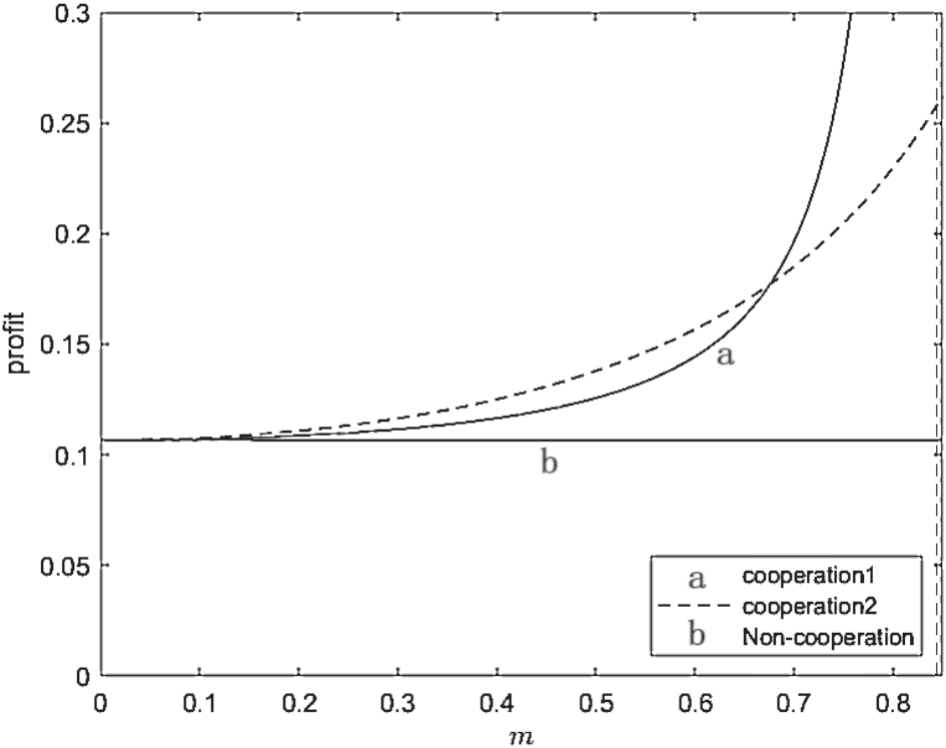
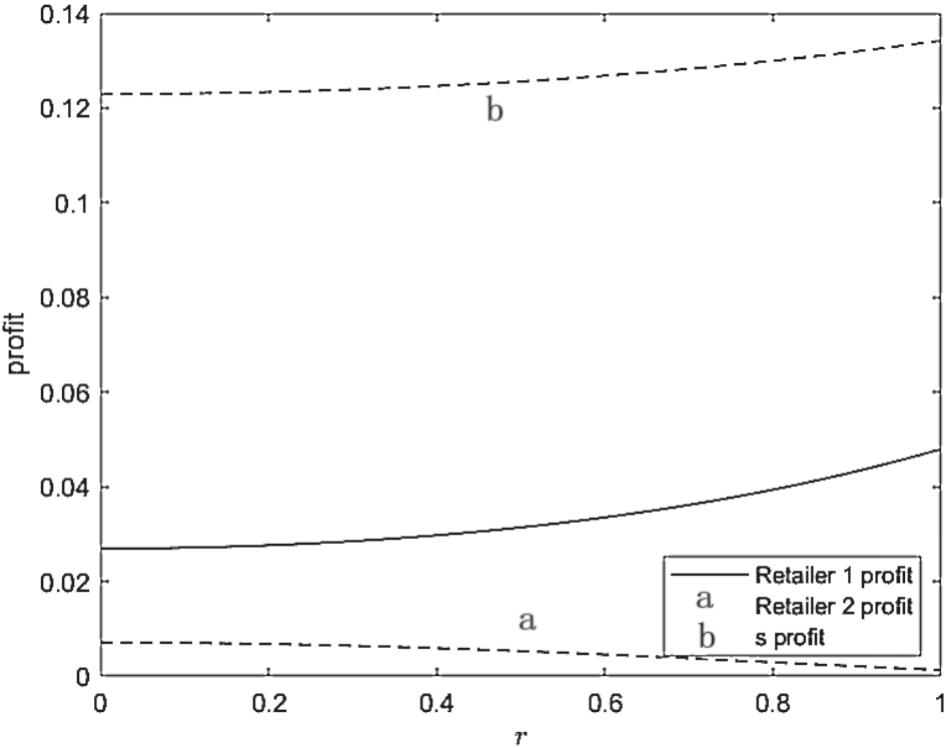
Fig. 12 numerically simulates the profit comparison between retailer and manufacturer in collaboration scenario 1. The profit of the manufacturer is larger than that of retailer 1 and larger than that of retailer 2, indicating that in collaboration scenario 1, the manufacturer makes the most profit and is more motivated to promote innovative collaboration. The profit of both manufacturer and retailer 1 in the cooperative situation increases with the increase in m value. The profit comparison between retailer 1 and retailer 2 is related to the change of m. When m value is large, retailer 1’s profit is smaller than that of retailer 2, but when the value of k is small, retailer 1’s profit is larger than that of retailer 2.
Proposition 3: Manufacturer’s profit is greater than retailer 1’s profit is greater than retailer 2’s profit, indicating that in the case of collaboration 1, the manufacturer makes the most profit and is more motivated to promote innovative collaboration. In general, the profit of retailers in the cooperative situation is better than that in the non-cooperative situation, indicating that retailers also have the incentive to participate in the cooperative situation preferentially.
Fig. 13 simulates the profit comparison between retailer and manufacturer in cooperation situation 2 by numerical simulation. At this time, retailers all participate in the cooperation situation of the manufacturer, and retailer 1 and retailer 2 have the same profit. Manufacturers’ profits are still higher than retailers. The profits of both the manufacturer and the retailer participating in the cooperative situation increase as the value r increases, indicating that the more spillover benefits, the more beneficial to the profits of both parties in the cooperative situation.”
Fig. 14 numerically simulates the profit comparison between retailer and manufacturer in collaboration scenario 1. The profit of the manufacturer is larger than that of retailers 1 and 2, indicating that in collaboration scenario 2, the manufacturer makes the most profit and is more motivated to promote innovative collaboration. The profit of both the manufacturer and the retailer involved in the cooperative situation decreases as the fly value k increases, which is related to diminishing marginal returns.
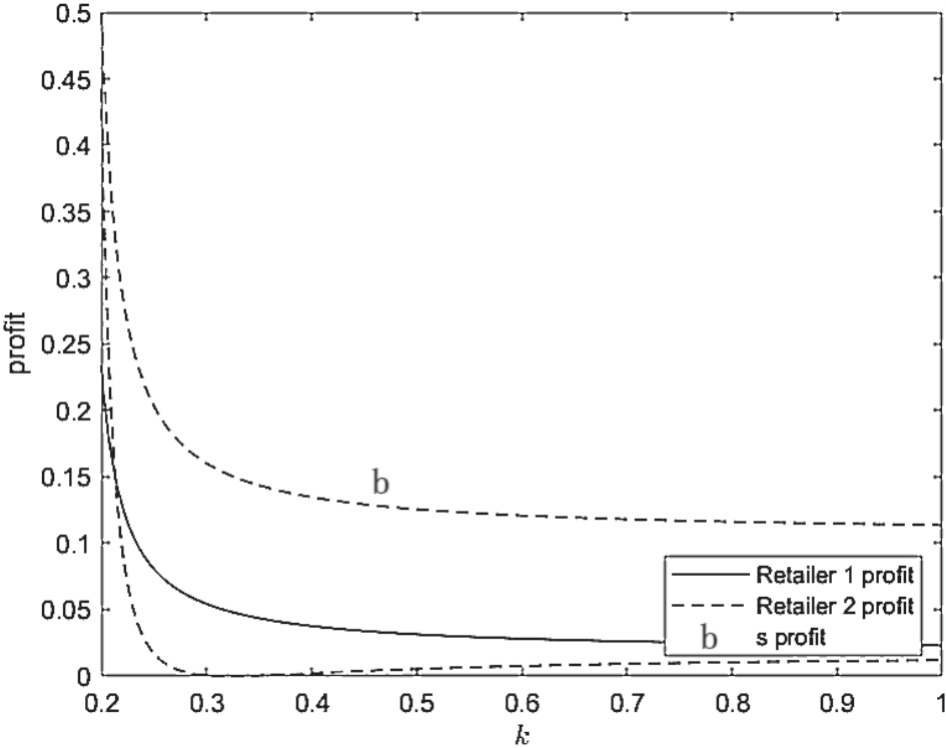
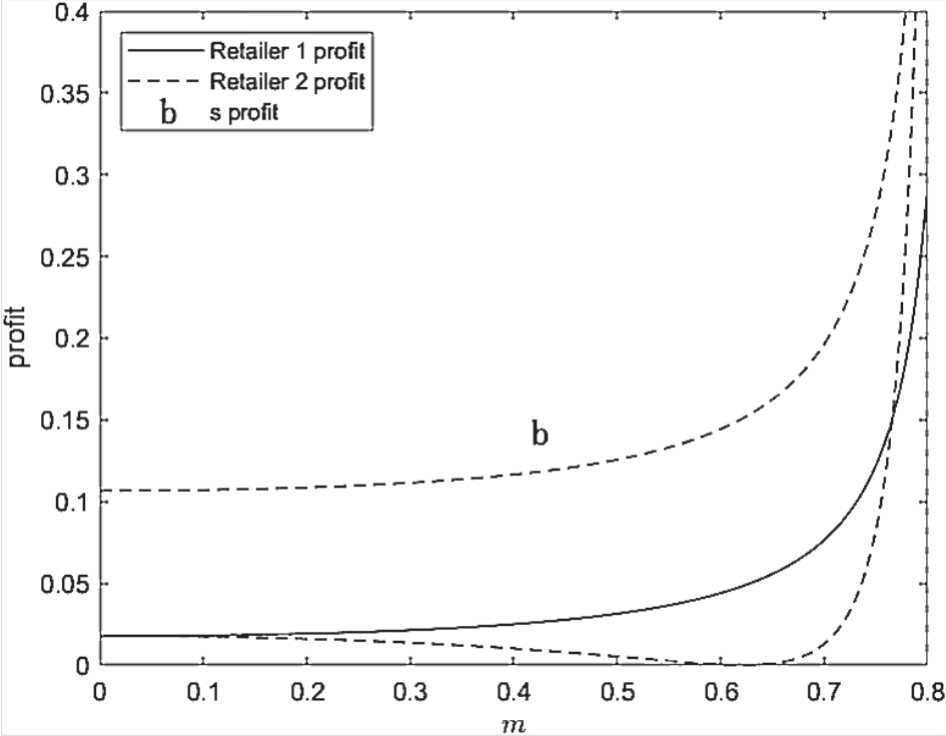
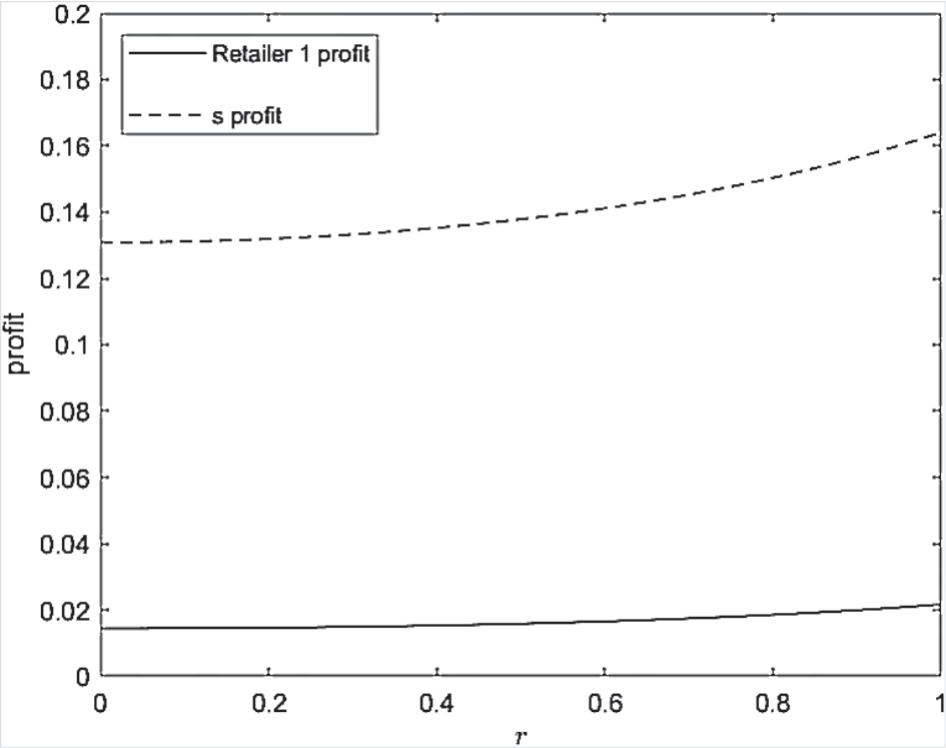
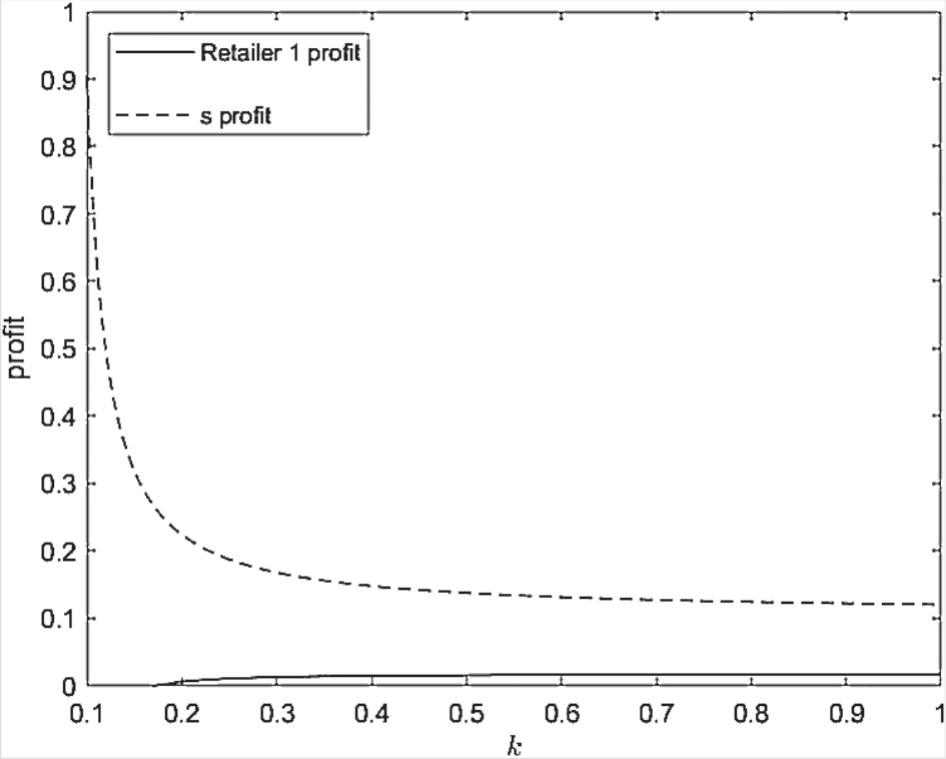
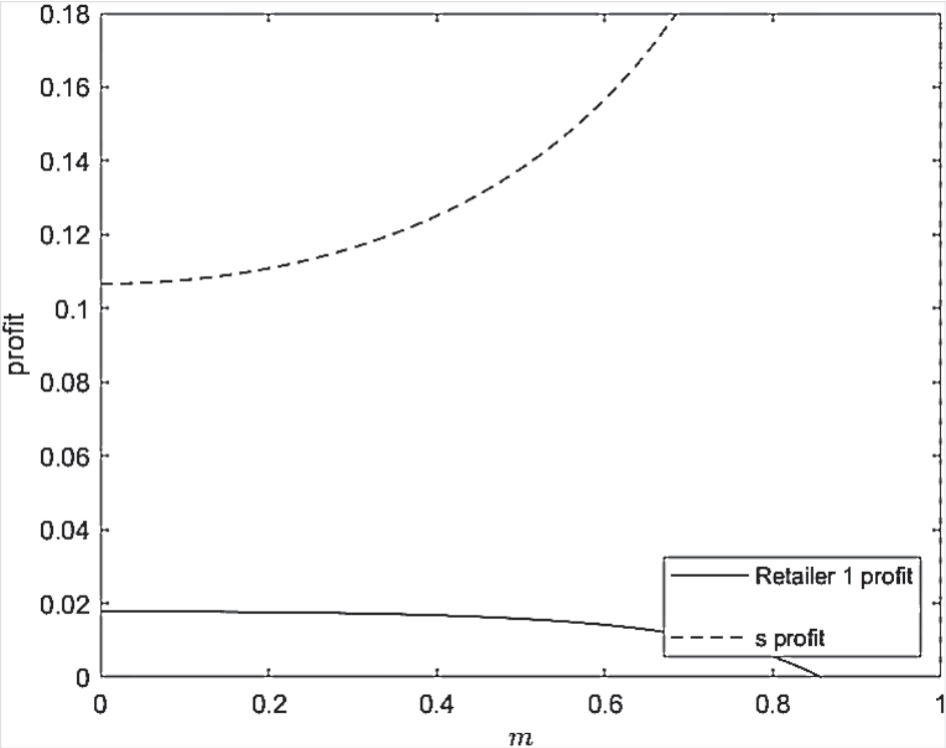
Fig. 15 simulates the profit comparison between retailer and manufacturer in collaboration scenario 1 through numerical simulation. The profit of the manufacturer is greater than that of retailer 1 than that of retailer 2, indicating that in collaboration scenario 1, the manufacturer makes the most profit and is more motivated to promote innovative collaboration. Manufacturers increase with m value and retailers decrease with m value.
A comparison of the equilibrium profits of retailers and manufacturers under different circumstances leads to the following proposition:
Proposition 4: The profit of the manufacturer is greater than that of the retailer and retailer 2, indicating that the manufacturer makes the most profit no matter in the case of collaboration 1 or collaboration 2, and the manufacturer is more motivated to promote the innovative collaboration situation.
Proposition 5: It can be obtained from the comparison between the uncooperative case and cooperative case 1 only when the value is relatively high, that is, when the spillover benefit is large. The profits of manufacturers and retailers in cooperative scenario 1 are better than those in the non-cooperative scenario. In either case, retailers’ and manufacturers’ profits increase as m, a measure of consumer demand’s sensitivity to improved product quality increases. It shows that consumers’ sensitivity to product promotion has a positive effect on product quality improvement.
Proposition 6: The profit of the manufacturer is greater than that of the retailer and retailer 2 in either cooperation case 1 or 2, which indicates that the manufacturer makes the most profit and is more motivated to promote the innovative cooperation situation in cooperation case 1 or cooperation case 2.
Industrial clusters have a distinct “industrial technology level,” and the R&D investment level of high-tech industries often determines their innovation development situation when compared with individual enterprises. For example, innovation-oriented industrial clusters like the Zhongguancun Science Park cluster motivate enterprises through high-intensity, innovative R&D activities, while in labor-intensive industrial clusters like the Yiwu Commodity City cluster, increasing R&D investment does not improve profitability. Collaborative efforts between manufacturers and retailers yield better profits than non-collaborative efforts.
Conclusions
This paper examines the impact of industrial technology levels, consumer sensitivity to product quality, and inter-industry spillover benefits on collaborative innovation and quality improvement in enterprises within an industrial cluster by constructing a supply chain scenario involving one upstream manufacturer and two downstream retailers. Through a comparison of profits among retailers and manufacturers under different evolutionary equilibria, this study identifies the advantages and disadvantages of various collaborative innovation scenarios.
This paper shows that a higher technical level within an industrial cluster motivates manufacturers to pursue quality innovation. Substantial inter-enterprise spillover benefits provide a strong incentive for manufacturers to collaborate with downstream enterprises on quality innovation. Manufacturers choose to collaborate with two downstream retailers for quality innovation when innovations bring a significant premium and consumers are more sensitive to quality. In contrast, if consumers are less sensitive to quality, the manufacturer opts for a quality collaboration with a single downstream retailer. These findings demonstrate that R&D investment levels in high-tech industries affect the choice of collaborative innovation development. In high-tech industries, innovative R&D activities lead to development promotion. However, increasing R&D investment in non-high-tech industries does not improve profitability.
The above research conclusions have certain management implications:
(1) Before the manufacturer decides whether to cooperate in R&D, it is necessary to consider the technological innovation level of itself and the whole industry. It is not necessary to carry out innovation investment blindly. Investment in innovation research and development may not produce great benefits, and it is likely to suffer losses. Careful planning is needed before strategic investment.
(2) When upstream manufacturers choose downstream manufacturers for collaborative innovation quality improvement, they need to select the most beneficial collaborative innovation mode based on the spillover benefits and exogenous environmental factors among enterprises, such as consumers’ sensitivity to product quality innovation.
The main contribution of this study is to shed light on the importance of collaborative innovation within industrial clusters. By analyzing the impact of technology levels, consumer sensitivity to quality, and inter-industry spillover benefits on collaborative innovation, this study provides a framework for understanding the factors that influence the choice of collaborative innovation strategies. Moreover, the study provides valuable insights into the advantages and disadvantages of various collaborative innovation scenarios, which can be used by policymakers and industry practitioners to develop effective innovation strategies. The findings of this study have important implications for industrial policy, particularly in promoting collaboration between firms within industrial clusters. The study emphasizes the importance of inter-industry spillover benefits in driving collaborative innovation and suggests that policies that encourage collaboration and knowledge sharing between firms can be beneficial. Moreover, the study highlights the role of technology levels and consumer sensitivity to quality in shaping the nature of collaborative innovation and suggests that policymakers should consider these factors when formulating innovation policies. Finally, the study contributes to the literature on collaborative innovation by providing a supply chain scenario that captures the dynamics of collaborative innovation within industrial clusters. The results of the study can be used by researchers to further investigate the factors that influence collaborative innovation and develop more sophisticated models for analyzing collaborative innovation within industrial clusters.
Although this study has produced valuable insights into theory, it mainly focuses on analyzing and discussing theory without verifying it through actual cases. Subsequent research can use actual cases and specific data to conduct further in-depth research on investment strategies and cooperative R&D among enterprises within industrial clusters to enhance the research’s realism. When researching enterprise R&D, the government typically provides subsidies to encourage R&D outcomes [34-38]. However, this paper does not consider government behavior, which limits its scope. Additionally, the paper mainly examines upstream manufacturers and doesn’t account for the selection and countermeasures of downstream retailers under information asymmetry. Downstream retailers have access to more accurate market demand information, and it’s important to understand how upstream manufacturers choose whether to collaborate with downstream retailers of low or high type (those who have more market information) [39-43]. In addition to enhancing quality, logistics and inventory coordination between upstream and downstream industrial clusters warrant further investigation. These are the limitations of this paper and offer opportunities for further exploration.
In order to promote green development, future research can introduce green development factors into the analysis framework, including environmental protection, resource utilization efficiency, carbon emission reduction, and other aspects. By integrating green development principles into collaborative innovation strategies, the sustainable development level of industrial clusters can be further improved, and more comprehensive decision support for enterprises and policymakers can be provided. In conclusion, this study not only provides a theoretical basis for the importance of collaborative innovation within industrial clusters, but also provides a new research direction and inspiration for incorporating green development factors into collaborative innovation strategies. These contributions will help promote the sustainable development of industrial clusters and provide useful references for future related research.

