

Introduction
Landslide refers to the whole or local slope sliding phenomenon that occurs along the connected shear zone when the main body on the inclined rock slope is affected by external factors, such as rainfall, water level, and earthquake under the action of gravity [1-3]. Conditions of the landslide body and the surrounding influencing factors, the first is the internal composition conditions of the landslide body itself, which are related to its own structural conditions, geological structure, and composition factors [4, 5]. The second factor is the environment formed by the interaction between the slope and the outside world, which is mainly geological movement and artificial engineering [6, 7]. The formation process of a landslide consists of four stages: landslide breeding, slope deformation, landslide occurrence, and slope stability [1, 8]. A landslide is a kind of natural disaster caused by the combination of natural, economic, and environmental factors and landform [9]. Most of it is an imbalance phenomenon caused by the change in the internal structure of the slope [10]. Landslides occur frequently in the rainy season, and earthquakes occur every year in our country because of its mountainous and complex landforms. Slope activities play a decisive role in landslide formation [11, 12].
Regardless of whether the cause of the slope is natural or man-made, it is unrealistic to take all internal factors into account in the specific construction process [13], because the force analysis between the internal structures of the slope is not simple to consider, and the design of slope protection measures is largely carried out on the simplified calculation. Deformation and cracking may occur in the process of external natural factors or construction [14-16]. Therefore, it is necessary to carry out the necessary slope deformation research to truly sum up the actual mechanical relationship between rock and soil on the slope. In addition, deformation research is also indispensable in checking the safety of slope construction and stability evaluation after dealing with high-risk problems [17]. Secondly, slope research can also provide specific data support for slope construction evaluation and the stability level of the slope in the process of slope use [18]. The influence of slope deformation on its surrounding situation can also be inferred according to the slope deformation trend, and it is also an important basis for the reasonable use of construction means and adjustment of relevant construction technology and steps [19]. To provide reliable data and a scientific basis for analysis, evaluation, and management projects [20], will even threaten the safety of Wuxi County, 50 kilometers away, so the research work on the slope of Zhengjiadagou slope is necessary and imminent. At present, there are many research techniques and theories on slopes, but the research on slope deformation characteristics, deformation influencing factors, and deformation characteristics mainly focuses on geotechnical engineering [20-22], geological engineering [23, 24], and hydrogeology [25], and these issues are rarely discussed from an intuitive perspective. Based on this, this paper proposes to monitor the slope body of Zhengjiadagou in a nitrate tunnel from the perspective of measurement, obtain deformation data in an intuitive way, and make a comparative analysis according to the actual shape variables of the slope, so as to reveal the main control factors affecting the deformation, and finally make stability prediction under the control conditions of this influence factor. It provides theoretical guidance and practical reference for slope research.
The first section of the article is the introduction, which provides an overview of the research background and significance, research questions, research content, main contributions, and chapter arrangement of the paper. The second section discusses the current research status both domestically and internationally, explaining the progress made in research in this field. The third section focuses on the analysis model of reservoir slope deformation, describing the location and overview of the research area, research methods, and the construction of the model. The fourth section analyzes the displacement status, using the model to analyze the displacement status of the front, middle, and rear parts of the slope. The fifth section analyzes the external influencing effects, using the model to analyze the main external controlling factors that affect slope deformation. The sixth section discusses the prediction of deformation status, using the model to make predictions about the future deformation of the slope. The seventh section analyzes the characteristic effects of reservoir slope, discussing the internal and external factors that affect slope deformation based on the analysis. The eighth section is the conclusion, summarizing the main research findings and innovations of the paper. It also discusses the research content and provides an outlook on future work that needs to be done.
The main contribution and innovation of the article lie in the construction of a reservoir slope analysis model from the perspective of hydrological surveying. This model uses the basic changes of the slope to reflect its displacement status, the influencing factors to represent external effects, and the characteristic factors to explain the interaction between internal and external factors. The deformation factors are used to build a predictive model for determining the future trend of the slope. The use of a modeling research approach provides a series of information related to the deformation effect, deformation causes, influencing factors, internal and external mechanisms, and future predictions of the slope. This offers a new approach to the study of slope deformation in reservoirs.
Research Status at Home and Abroad
In the early stage, people’s judgment of slope stability was mainly based on whether the slope deformation exceeded the limit of static equilibrium conditions, so there are many methods developed. At the current technical level, these methods analyze slope stability from a single factor and have certain limitations [26]. The research on deformation monitoring in China can be traced back to ancient times, and the more famous achievement is the seismograph invented by Zhang Heng in the Eastern Han Dynasty to monitor the crustal deformation movement. The seismograph was used more than one thousand years earlier than the western instruments to monitor the crustal deformation movement, and its sensitivity is relatively high. In modern times, slope monitoring has undergone great changes in technology and theory since the watershed in the 1980s. Before that, slope monitoring mainly relied on conventional ground measuring instruments, which mainly measured the specific shape variables at specific deformation points to provide deformation information and then analyzed the state of shape variation [27-29]. In the world, the research on single slopes is mainly concentrated in the 1980s and 1990s of the last century. The main research areas are Plimpton, New Zealand, Hong Kong, San Francisco, Ethiopia, etc. The main research content is the relationship between slope deformation and rainfall in the region, which was studied in China in the late 1990s. The main research areas include the typhoon area and non-typhoon area of Zhejiang Province, the Three Gorges Reservoir area, the Yucheng District of Ya ‘an, Sichuan Province, etc. [30]. Since the country signed the relevant agreement in 2003, regional landslide monitoring and all kinds of individual landslide monitoring have made many achievements.
Slope monitoring at home and abroad mainly relies on contact and non-contact monitoring technologies [31, 32]. Contact technology includes geodesy technology using traditional measuring instruments for slope monitoring [33]. In the development of geodesy technology, the appearance of measurement technology has greatly solved the problems of poor observation ability, unfixed detection period, and low accuracy caused by traditional geodetic technology due to the conditions of the environment and terrain. GPS monitoring technology has also been widely used in many fields, but due to its complex data and relatively high requirements for field environment, its promotion in slope deformation monitoring research is still limited [34]. The internal observation technology to monitor the internal characteristics of the slope, the position of the slip band and the structure type, and the optical fiber monitoring technology based on the light scattering and interference theory to obtain the monitoring information at high speed and accurately make up for the defects of the traditional internal measurement range, low sensitivity, and weak signal [35]. Non-contact technology includes close-range photogrammetry, which is a representative close-range shooting of target information and the establishment of a three-dimensional spatial image model. This technology has the characteristics of fast 3D information acquisition, high information accuracy, large amount of information and intuitive information, etc. However, it is difficult to achieve all-weather monitoring, and there are also limitations in actual measurement due to the influence of field photography conditions. The 3D laser scanning monitoring technology is simple to operate, the repetition observation period is short, and the information obtained in the actual engineering measurement is easier to understand. With the development of technology, slope deformation monitoring has also entered the field of multi-technology mixed application, and has been transformed into all-round and multi-angle monitoring of slope from inside to outside, from whole to local, two-dimensional to three-dimensional, manual to automatic monitoring, and other aspects [36].
Overall, current reservoir slope deformation monitoring still has some technical and management deficiencies. These deficiencies mainly manifest in limited monitoring methods, inadequate spatial coverage of monitoring devices, insufficient data processing and analysis capabilities, imperfect warning mechanisms, and a lack of long-term monitoring and management. Therefore, it is urgent to find a scientific and effective method for monitoring and analyzing. From a modeling perspective, modular solutions can address individual analytical shortcomings, making it particularly important to build comprehensive research and analysis models.
Reservoir Slope Deformation Analysis Model
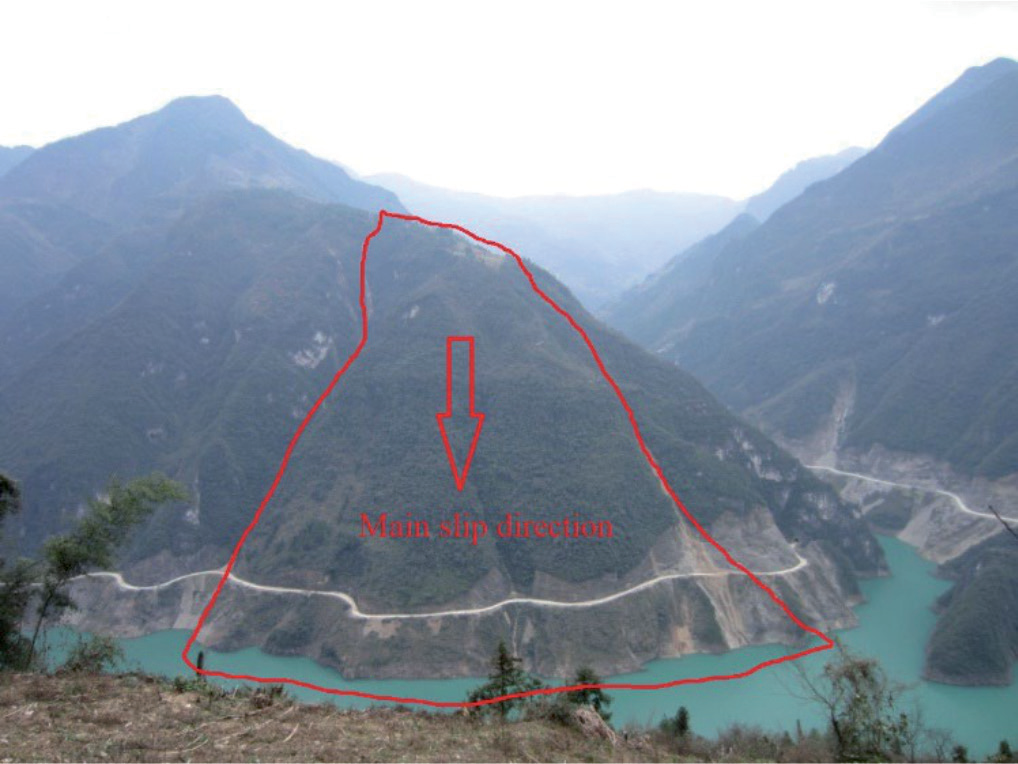
The slope of Zhengjiadagou slope is located 3 kilometers upstream of the Zhongliang reservoir dam area. The slope of the reservoir corresponds to the relative terrain of the reservoir area in the north and south. The slope body has an inverted “U” shape on the plane, as shown in Fig. 1. The main characteristics of deformation are the development of cracks and local slump.
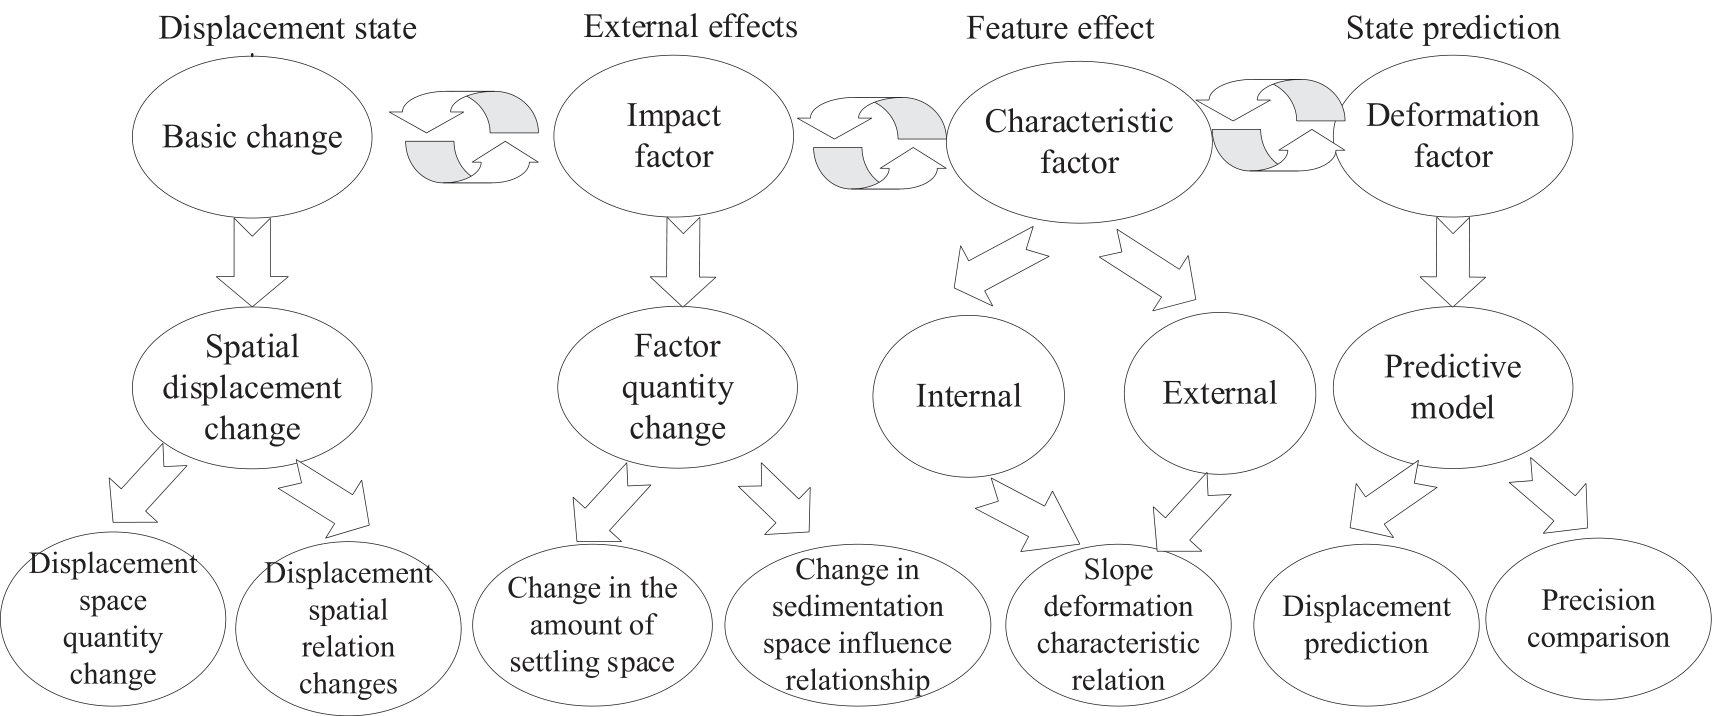
At present, there are few models used to analyze the deformation of reservoir slopes. Most of them use traditional measurement methods to obtain the displacement and settlement of monitoring points, etc., and there is also a lack of analysis of some influencing factors of deformation. The analysis of the influence of internal deformation characteristics on external deformation results is less involved in obtaining deformation control factors by monitoring means and selecting influence factors based on control factors to obtain scores of influence relationships. Therefore, the reservoir slope analysis model is constructed from the perspective of hydrology measurement, and the monitoring points of the front, middle, and back edges are selected as displacement factors, and the basic change characteristics are analyzed from the perspective of deformation. The rainfall and water level were integrated into the model as displacement influencing factors, and the main influencing factors of deformation were revealed through the changing relationship between them. At the same time, a grey model [37- 40] is established to predict the size of possible shape variables. Finally, from the aspect of internal structure, the role of structural characteristics in reservoir landslide movement is expounded. By establishing an analysis model of reservoir slope deformation displacement, external influence factor, internal characteristic effect, and shape variable prediction as the main modules, the information on deformation feature-influence effect-structure effect-prediction results can be systematically obtained. The model structure is shown in Fig. 2.
Displacement State Analysis
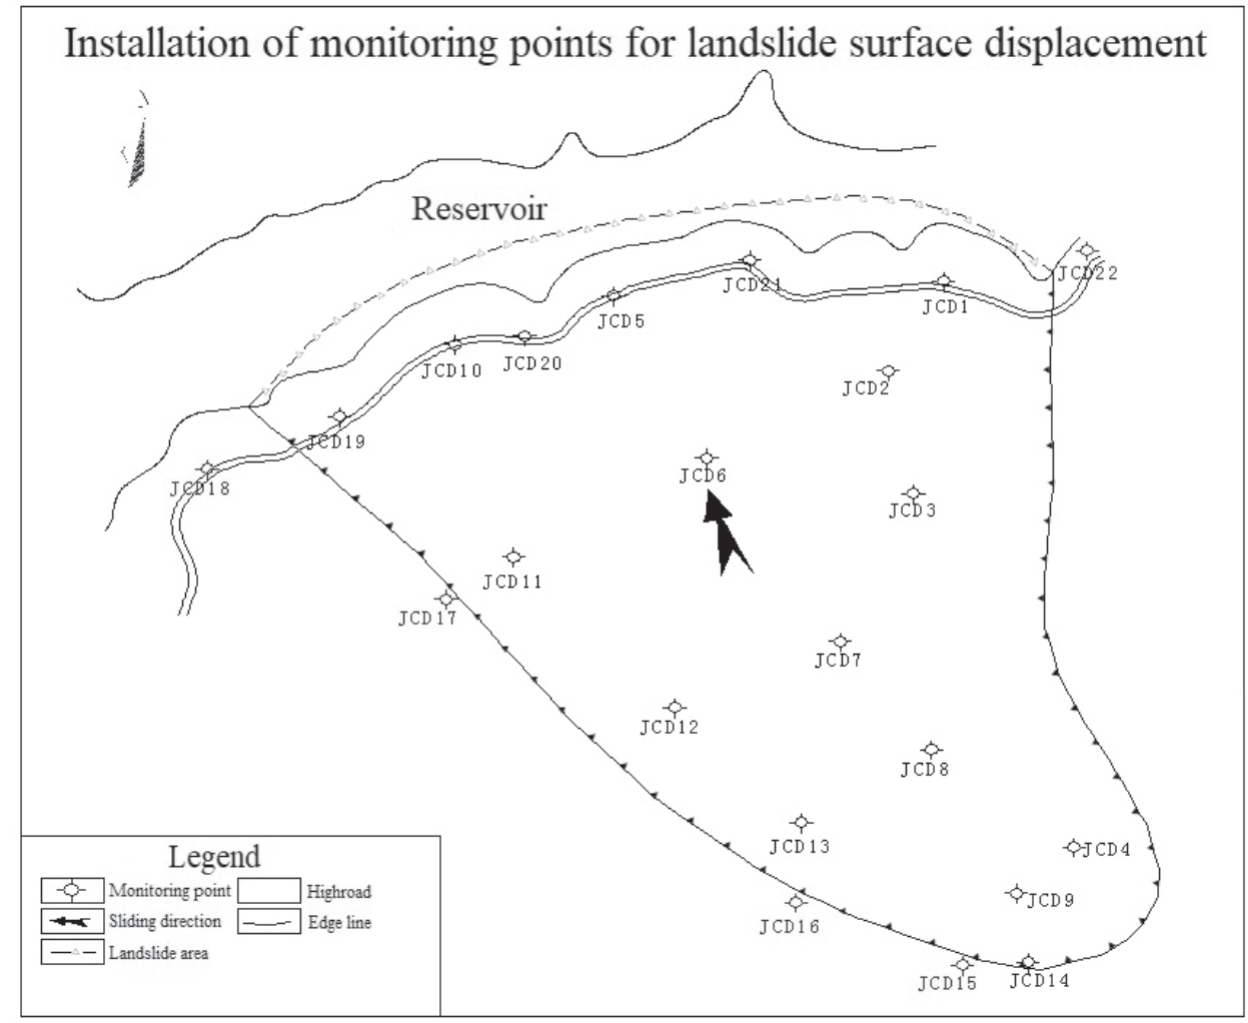
On the basis of field investigation, combined with slope characteristics, meteorological and hydrogeological conditions, as well as the main artificial activities in the slope area, a total of 22 surface displacement monitoring points and 8 slope front monitoring points are arranged, which are as follows: JCD1, JCD5, JCD10, JCD18, JCD19, JCD20, JCD21, JCD22, 7 monitoring points in the middle of the slope, respectively: JCD2, JCD3, JCD6, JCD7, JCD11, JCD12, JCD17, 7 monitoring points at the back edge of the slope, respectively: JCD4, JCD8, JCD9, JCD13, JCD14, JCD15, JCD16. According to the displacement, JCD5, JCD18, and JCD22 are selected as the coordinate research data of the surface front, JCD17 as the coordinate research data of the middle of the surface, and JCD9, JCD15, and JCD16 as the coordinate research data of the surface back edge. As shown in Fig. 3.
Analysis of Leading Edge State
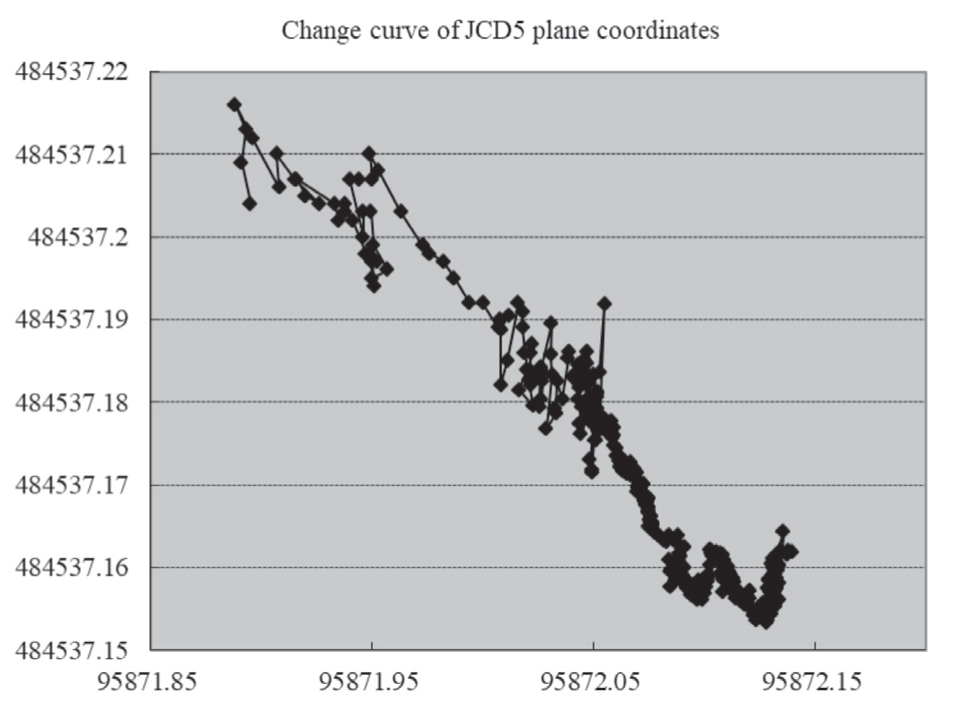
Through the analysis of the data of the front monitoring points, it is found that the cumulative change of the front monitoring point JCD5 is the largest, and the changes of its north-south and east-west coordinate points verify this conclusion. The reason for the largest deformation is that the monitoring point is built on the main sliding direction of the slope and bears the overall downward sliding pressure of the slope, so the change is the largest. The JCD5 coordinate change curve is shown in Fig. 4.
Analysis of Central State
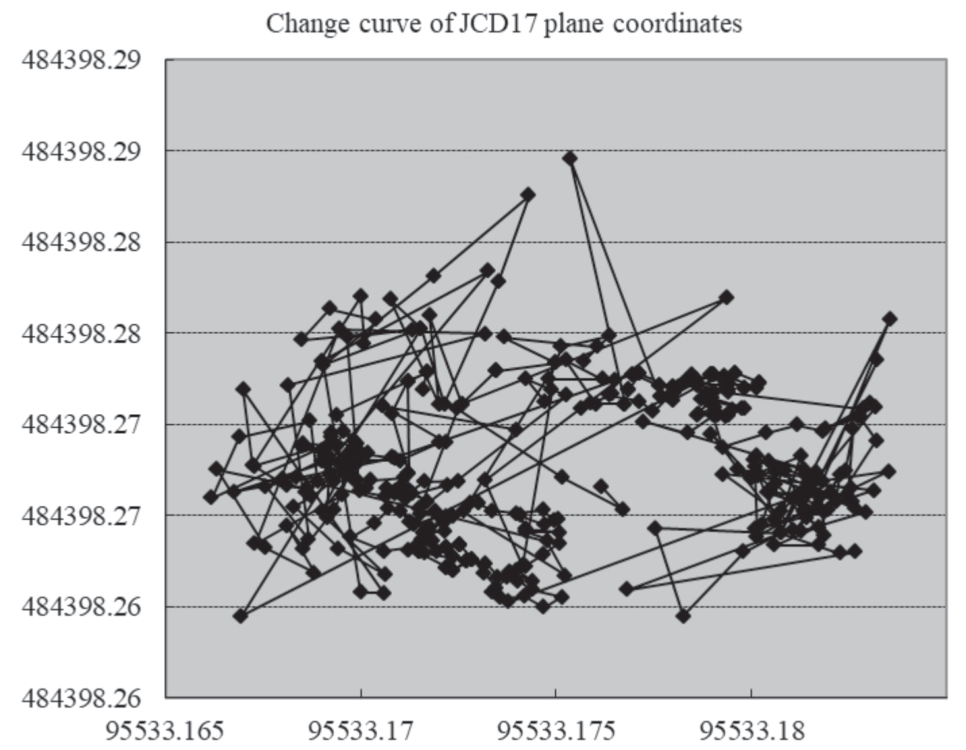
Through the cumulative statistics and comparative calculation of the coordinate changes of control points, it can be seen from the analysis that there is little difference between the north-south coordinates and east-west coordinates of each point in the whole monitoring period. The reason can be understood as that the control points are all established on the sliding surface in the middle of the slope, and the sliding surface declines as a whole, so the sliding pressure of the slope is basically the same. The coordinates of JCD17 do not change much, because it is laid outside the boundary of the slope to judge the position of the slope slide boundary and prove the existence of the slope slide boundary. The specific change curve of JCD17 is shown in Fig. 5.
Analysis of Trailing Edge State
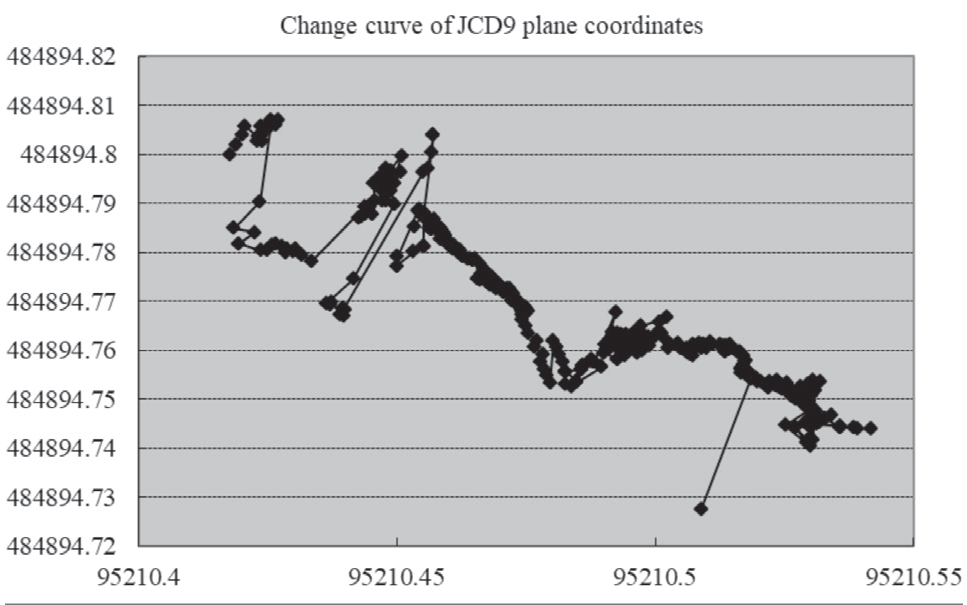
Through the cumulative statistics and comparative calculation of the coordinate changes of the control points, the analysis results show that the cumulative displacement of JCD9 in the entire monitoring cycle is the largest in the trailing edge monitoring points, and the reason can be understood as that JCD9 is deployed on the maximum sliding surface of slope movement. Since it is built on the main sliding direction of the maximum sliding surface, it bears the overall sliding pressure of the rear edge of the slope, so the variation is the largest. The north-south and east-west coordinate changes of JCD9 fully explain this phenomenon, and the specific change curve of JCD9 is shown in Fig. 6.
External Influence Effect Analysis
Analysis of Influence Factor Effect of Leading Edge
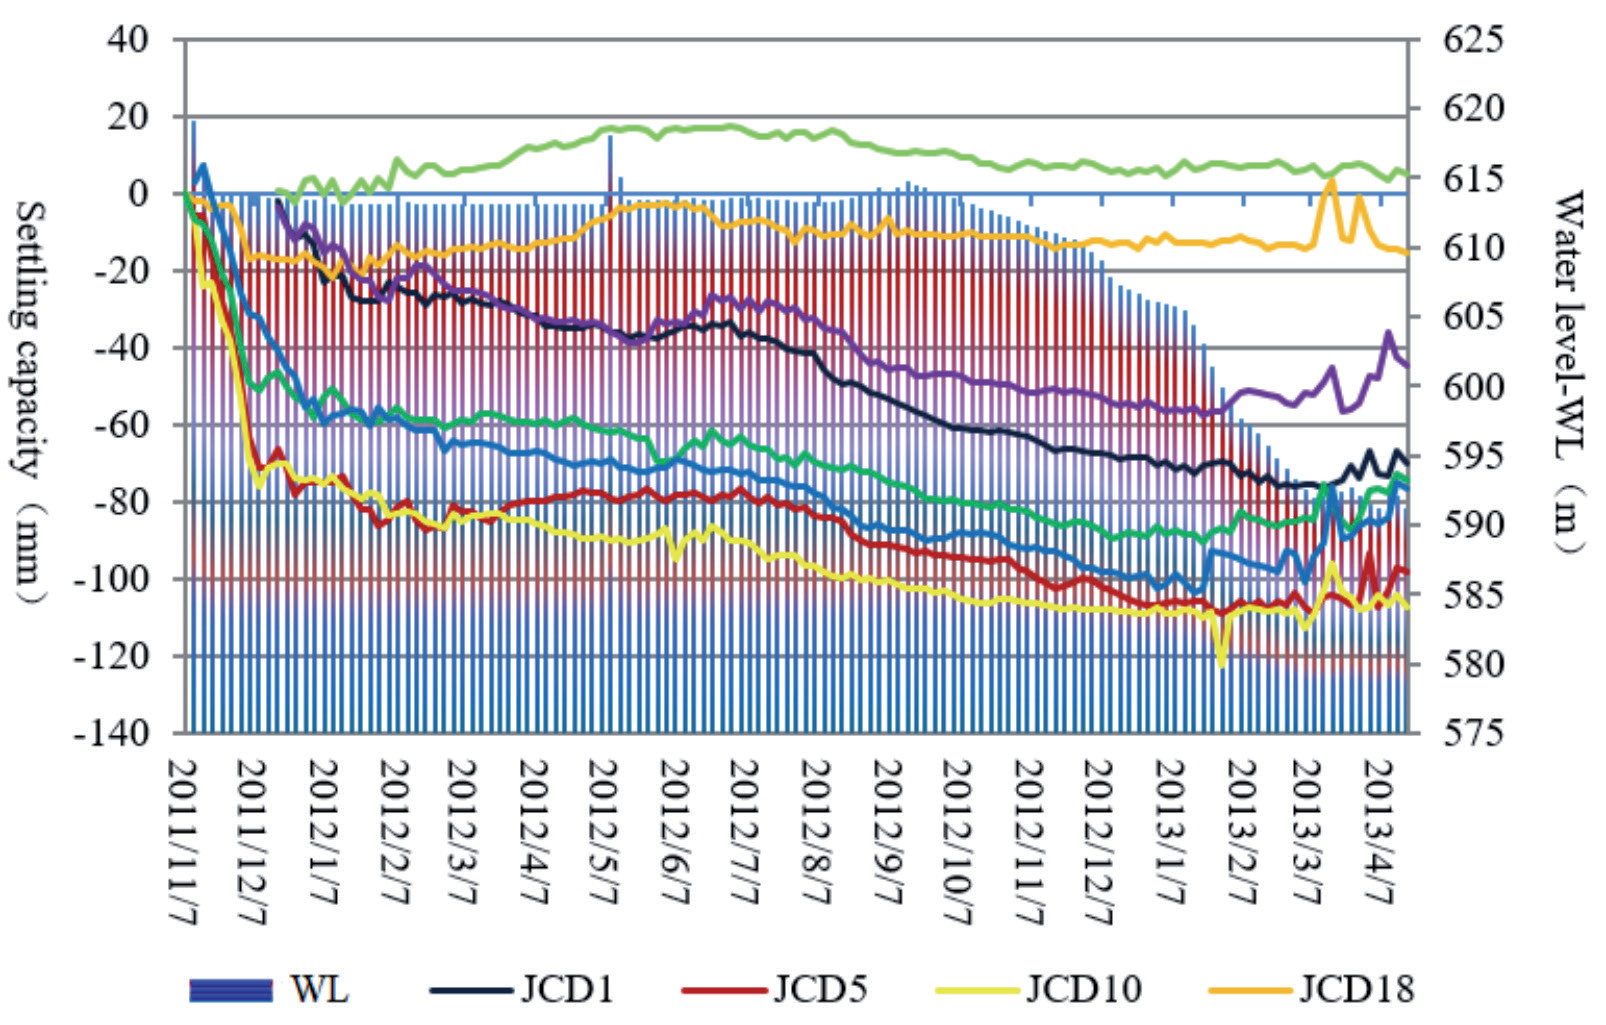
The deformation curve of the monitoring points can be drawn by using the monitoring data of each period, rainfall, and water level of the front monitoring points. The deformation velocity of the monitoring points JCD5, JCD10, JCD19, JCD21, JCD1, and JCD20 from November 2011 to January 2012 can be intuitively analyzed. From the data obtained from January to October 2012, it can be seen that the deformation speed of each monitoring point becomes significantly smaller, and the whole state is in a relatively stable peristaltic state. The settlement curve of each monitoring point fluctuates slightly from May to September when there is heavy rainfall. It shows that rainfall has a certain effect on the stability of the slope front, but it is not the main factor.
From the data obtained from November 2011 to January 2012, it can be seen that the water level of the reservoir in this stage gradually decreased from 625 m to 613 m, and the deformation speed of the monitoring points JCD5, JCD10, JCD19, JCD21, JCD1, and JCD20 was the largest. From January to October 2012, the water level was basically maintained at 613 m, and the deformation rate of each monitoring point became significantly smaller. From October 2012, the water level gradually decreased from 613 m to 591 m in April 2013, it can be seen that the deformation of the monitoring point did not change significantly, and the whole was in a relatively stable peristaltic state, indicating that the changes brought by the water level decline during this period did not have a direct effect on the stability of the front. The comprehensive curve of front settlement deformation, rainfall, and water level is shown in Fig. 7.
Analysis of Influence Factor Effect of Central
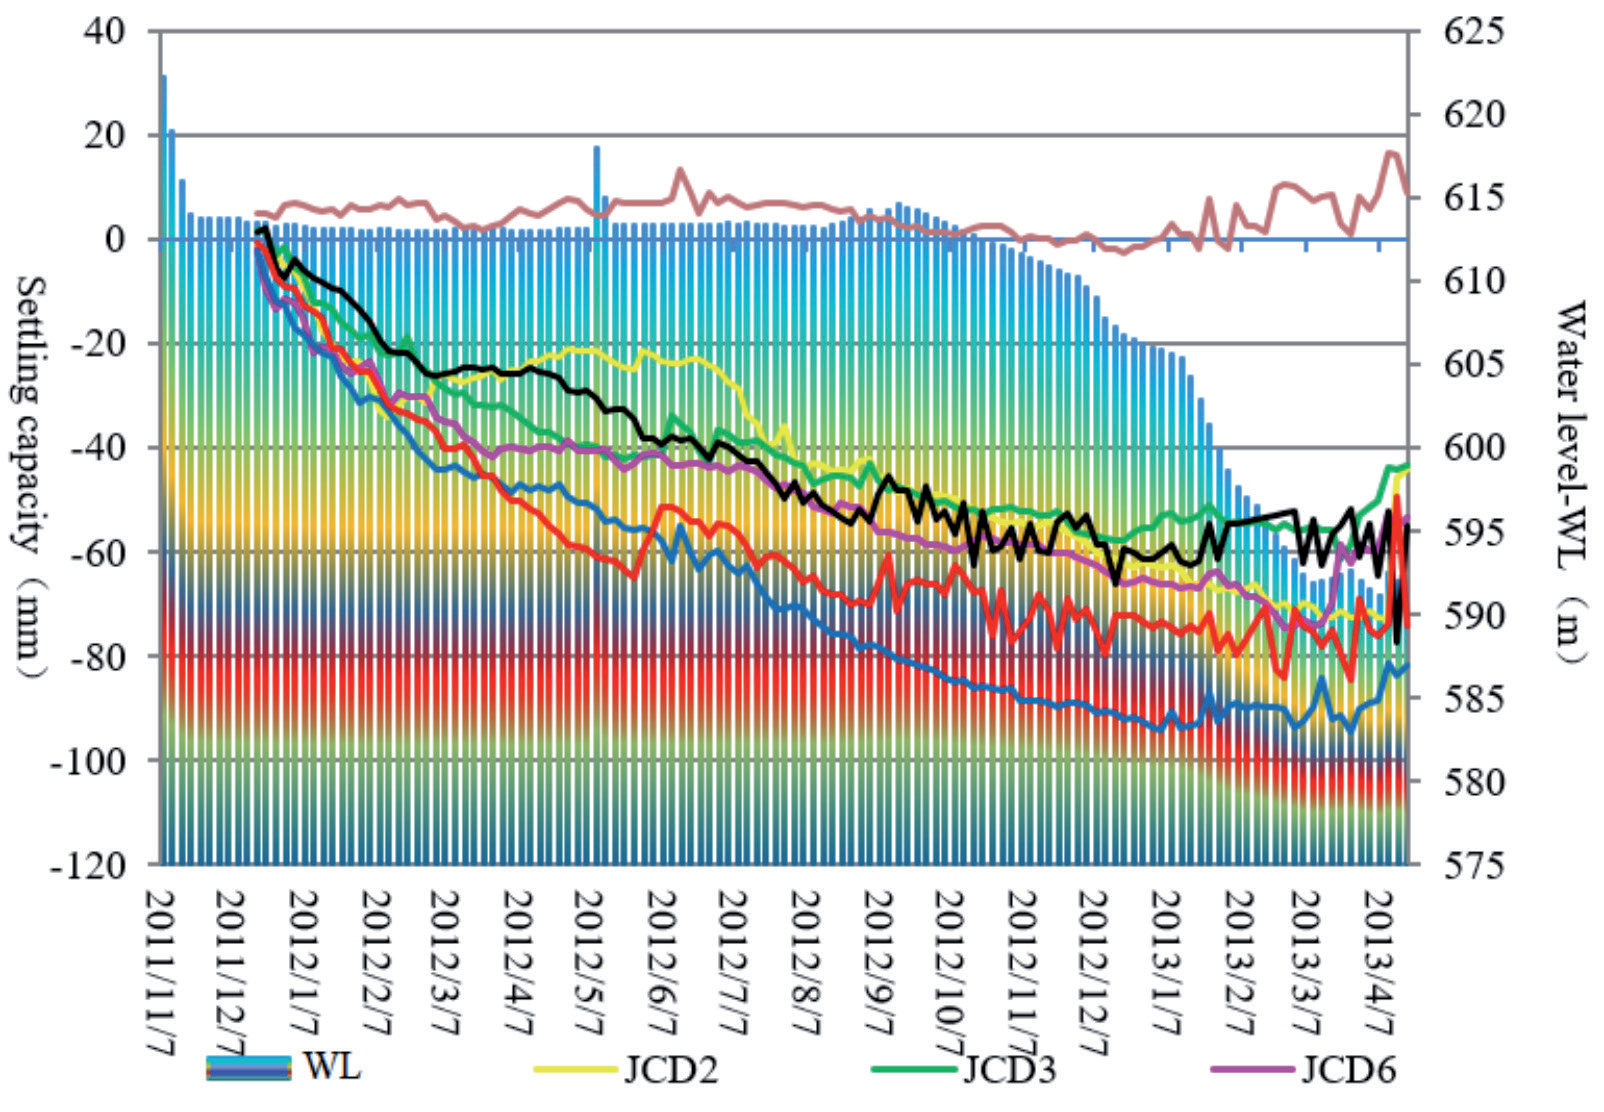
From the data obtained from December 2011 to February 2012, it can be seen that the settlement deformation of JCD2, JCD3, JCD6, JCD7, JCD11, and JCD12 at the monitoring points in the middle of the slope is relatively fast, and there is no large rainfall in the slope region. From February to September 2012, the horizontal displacement and deformation rate of each monitoring point became significantly slower than before. During this period, the rainfall was large, and it could be seen that the deformation curve fluctuated slightly, but the deformation did not increase significantly, indicating that the rainfall had an effect on the stability of the slope to a certain extent. From October 2012 to April 2013, the average monthly deformation of horizontal displacement at each monitoring point was between - 2 mm and -7 mm, indicating that the deformation in the middle of the slope was in a relatively stable creeping state.
It can be seen from the obtained data that the stage when the water level drops from 625 m to 613 m will still have a great impact on the deformation of the monitoring point in the middle of the slope. However, when the water level drops from 613 m to 591 m in the later stage, the deformation effect on the monitoring point in the middle of the slope is not obvious. It shows that the effect of high water level on slope stability is greater than that of low water level. Data taken from December 2011 to October 2012 shows that the water level was basically 613 m. The settlement deformation of JCD2, JCD3, JCD6, JCD7, JCD11, and JCD12 at the monitoring points in the middle of the slope is significantly faster than that of the water level gradually dropping to 591 m after October 2012. From the data from October 2012 to April 2013, it can be seen that the average monthly deformation of settlement displacement at each control point is between -2 mm and -5 mm, so it can be concluded that the deformation in the middle of the slope is in a relatively stable creep condition. The settlement in the middle of the slope and the comprehensive changes of rainfall and water level are shown in Fig. 8.
Analysis of Influence Factor Effect of Trailing Edge
From the data from mid-December 2011 to February 2012, it can be seen that there was no large rainfall in the slope area, and the vertical deformation of JCD4, JCD8, JCD9, JCD13, and JCD14 was the fastest since monitoring. However, from April to September 2012, the rainfall in the slope slide area was the largest in a year, but the vertical deformation of the monitoring point was significantly slower than that in the initial monitoring period, and JCD14 was basically not deformed during this period, indicating that the amount of rainfall is not an important factor affecting the stability of the slope rear edge. From October 2012 to April 2013, there was no abnormal change in the settlement of each monitoring point, indicating that the change in rainfall did not have a significant impact on the slope, and the deformation of the rear edge of the slope was in a relatively stable creeping state.
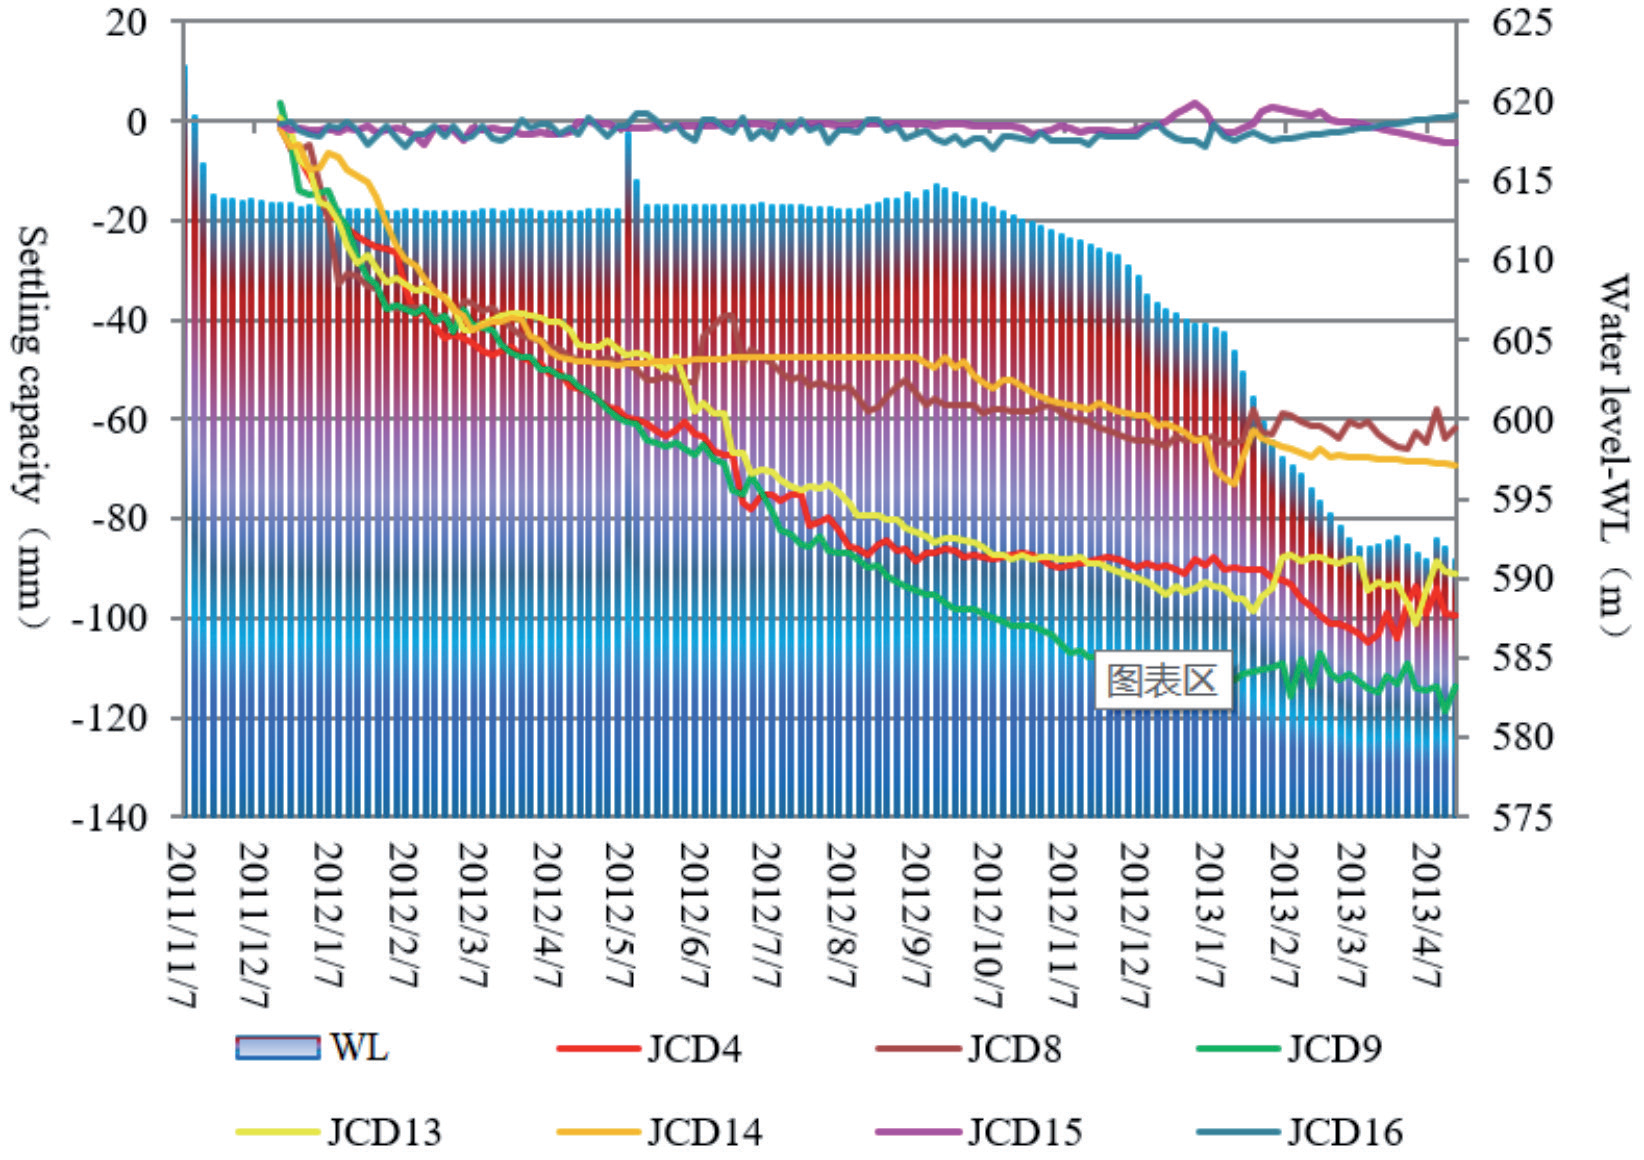
It can be seen from the obtained data that the stage when the water level drops from 625 m to 613 m will still have a great impact on the deformation of the monitoring points at the back edge of the slope. However, the stage when the water level drops from 613 m to 591 m in the later stage has no obvious effect on the deformation of the monitoring points at the back edge of the slope. It shows that the effect of high water level on slope stability is greater than that of low water level. Data taken from December 2011 to October 2012 shows that the water level is basically 613 m, The settlement deformation of JCD4, JCD8, JCD9, JCD13, and JCD14 monitoring points at the rear edge of the slope is significantly faster than that of the water level gradually dropping to 591 m after October 2012, so it can be revealed that the level of water level is one of the main factors affecting the stability of the rear edge of the slope. From the data from October 2012 to April 2013, it can be seen that the average monthly deformation of settlement displacement at each control point is between -2 mm and -5 mm, indicating that the decline of water level in the later period has no obvious impact on the slope, and the deformation at the back edge of the slope is in a relatively stable creeping state. The settlement deformation of the back edge of the slope and the change in rainfall and water level are shown in Fig. 9.
Based on the measurement technology as the theoretical basis, after 16 months of professional monitoring of the slope of Zhengjiadagou in the tunnel trough, the data were obtained through periodic observation of the control points, and then the monitoring data were compared and analyzed with related influencing factors. It was concluded that the water level of the reservoir was the most important factor determining the stability of the slope, and the effect of rainfall on the stability was not obvious. In general, the deformation of the middle and back edge of the slope is smaller than that of the front of the slope. The main reason is that the front of the slope is directly eroded by the reservoir water at a high water level, which leads to the decline of the stability of the front of the slope.
Deformation State Prediction
There are two key causes of slope deformation in the study area: one is the water level of the reservoir, and the other is rainfall. According to the observation results, rainfall plays a weak role, and the main role is the water level of the reservoir. On this basis, the slope front control point JCD5 and the slope back control point JCD8 were selected, and the grey model was used to analyze and predict the data, explore the formation mechanism of the slope under the condition of reservoir level and rainfall, and analyze its deformation characteristics. The monitoring results of the last 15 periods were taken as prediction data, and the slope deformation trend was predicted by using the grey model. The JCD8 results are shown in Table 1 below.
Table 1.
Actual displacement and grey model to predict displacement of JCD8.
It can be seen from the actual displacement of JCD5 and JCD8 and the predicted displacement table of the gray model that the average error of the actual value and predicted value of JCD8 in the latter two periods is relatively larger than that of other monitoring points. The comparison diagram between the predicted curve and the actual deformation curve is made for the measured data and observed data of JCD5. Through the fitting of the change trend of the two kinds of data, it can be seen that the actual change trend of JCD5 is different from that predicted by the gray model. As a whole, it can be seen that the predicted value tends to gradually increase while the measured value tends to gradually decrease, indicating that the front edge tends to be stable and the expected effect of the slope front is obtained under the condition of reinforcement. The comparison between the predicted curve and the actual deformation curve of JCD8 measured data and observed data was made. By fitting the change trend of the two kinds of data, it could be seen that the actual change trend of JCD8 was different from that predicted by the gray model. As a whole, the predicted value tended to decrease gradually while the measured value tended to increase gradually. Considering the error effect of the model, the metabolic GM (1, 1) model and the new information GM (1, 1) model were used to predict the deformation trend of JCD8, and the results showed that the predicted trend of the GM (1, 1) model and the new information GM (1, 1) model were closer to the measured deformation trend. However, the predicted value curve still tends to decrease, indicating that the deformation of the trailing edge gradually tends to increase, indicating that the deformation of the trailing edge of the slope has not achieved the expected effect under the reinforcement condition, which verifies the feasibility of using the GM (1, 1) model to predict the stability of the slope. The specific predicted trend and the actual change trend are shown in Fig. 10, Fig. 11.
The residual, absolute residual, and average error of JCD8 predicted trend and actual trend were obtained by calculation, which verified the difference between the actual deformation and predicted trend, indicating that the actual deformation of the trailing edge did not achieve the expected effect of slope protection, and there was a certain distance from the expected goal, further verifying the urgency of the protection work of the trailing edge slope. The results are shown in Table 2.
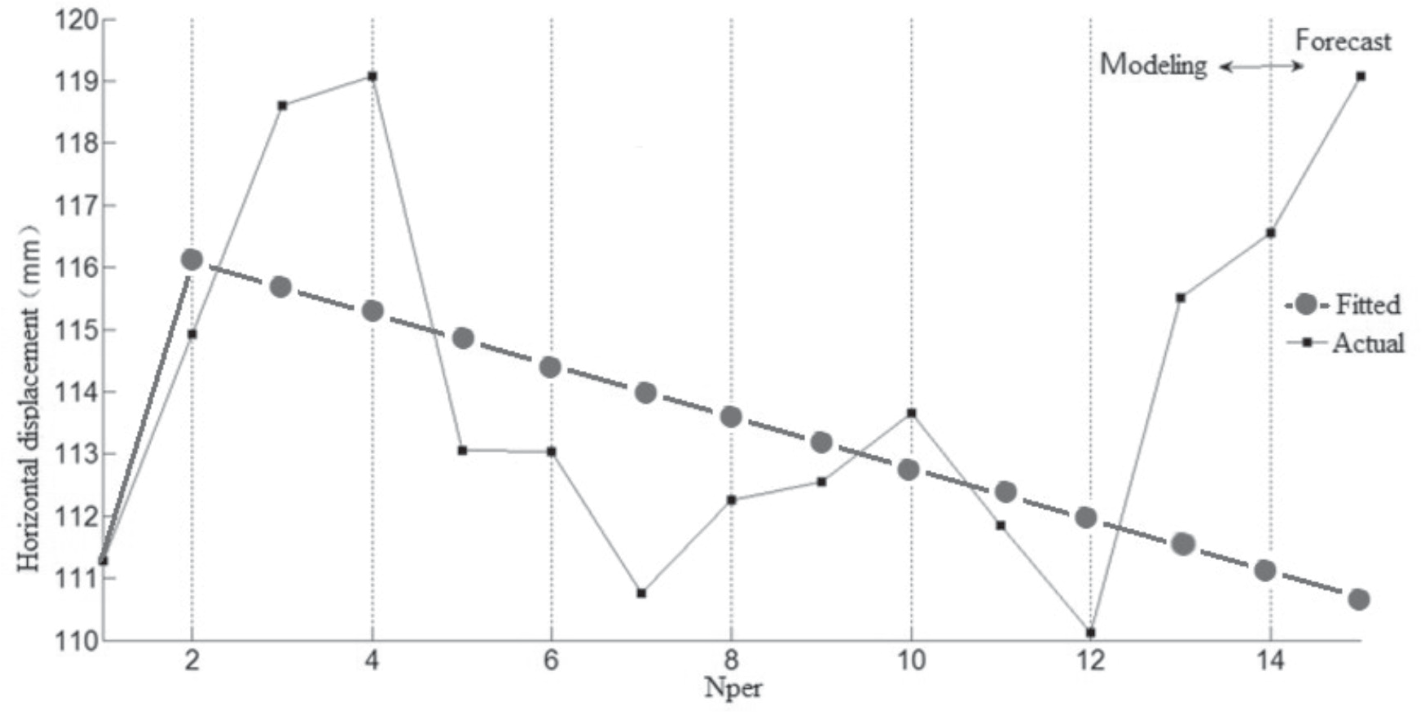
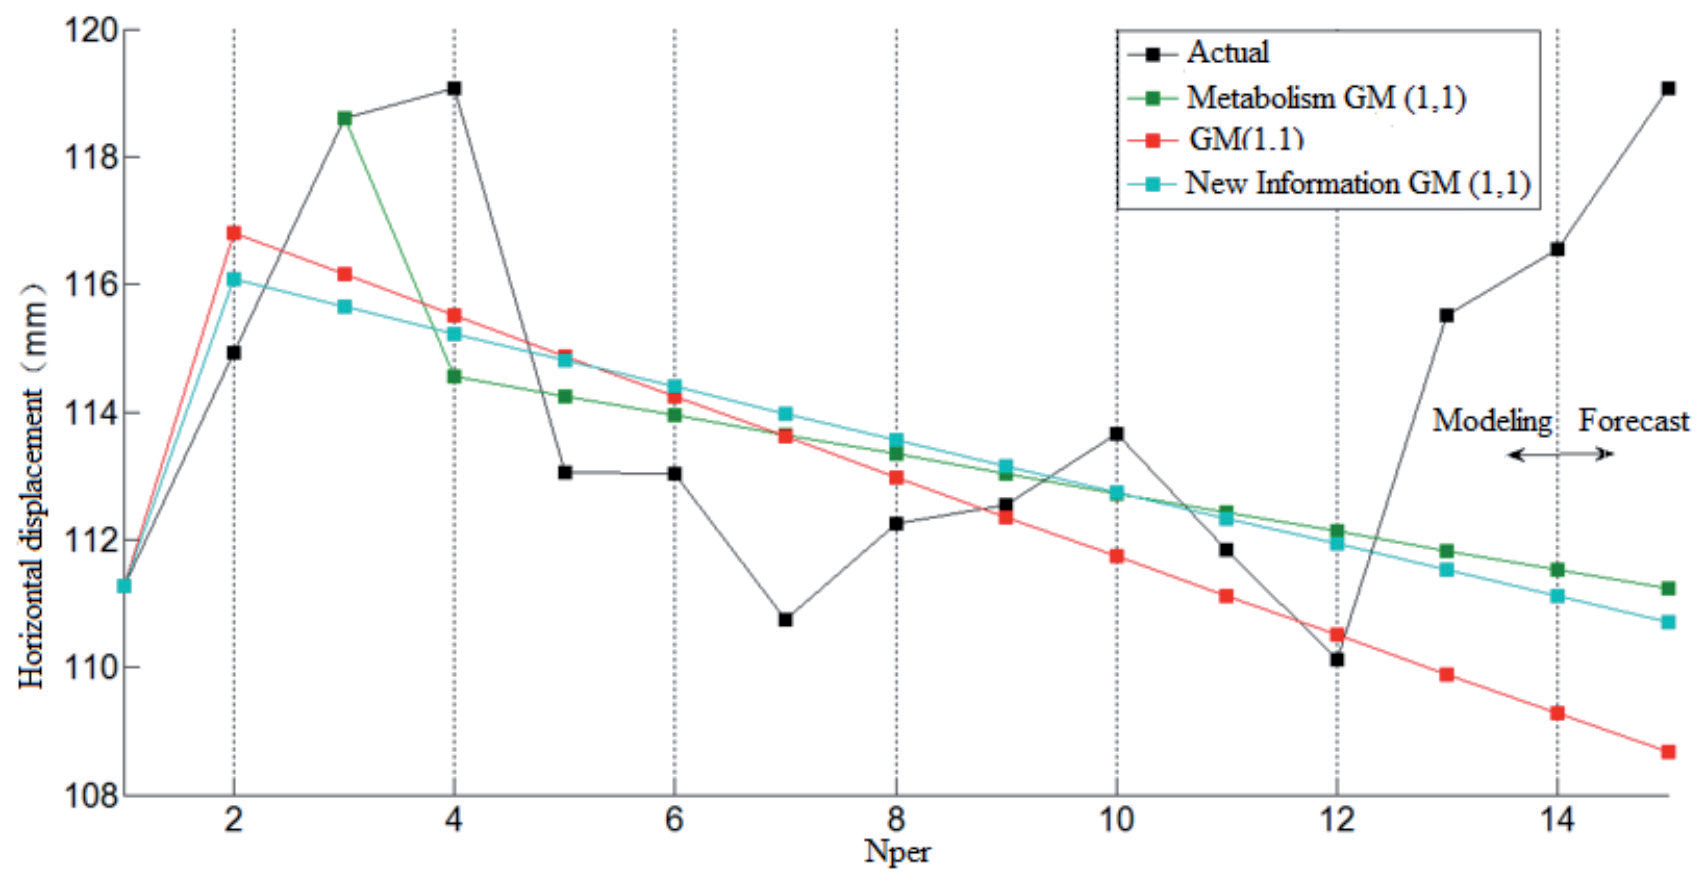
Table 2.
Actual variation trend and model prediction error of JCD8.
Discussion
There are many reasons for the change in slope stability, which can be divided into internal and external reasons. The intrinsic factors include geological structure condition, terrain type, rock, and soil nature category, etc. External causes include the role of water (divided into rainfall and storage water), earthquakes, human economic life project construction, and so on. The internal causes control the stability of the slope, while the external causes often increase the sliding force, which leads to the reduction of the strength of the rock mass and the weakening of the anti-sliding force, thus promoting the occurrence and development of slope deformation and failure.
Internal Factors
The whole terrain of the slope body of Zhengjiadagou is steep on the longitudinal slope, the terrain in the front is steep, and the terrain in the back is slow. The rear boundary of the slope is caused by tension cracking, and the main marker of the boundary is the crack caused by tension cracking, and the front extends into the deep gully (now flooded by Zhongliang Reservoir). There are clear shear-shaped cracks in the back part of the left area and the front part of the left area. The right boundary is a deep gully, and the upper part of the gully and the side of the slope have formed many slumps. With the rise or fall of the reservoir water level, some parts of the slope body are intermittently immersed in water, forming an alternating state from dry to wet and then from wet to dry, and the slope body also becomes soft with the change of this state, especially the decrease in shear strength caused by this process will directly reduce the stability strength of the slope. The slope body is composed of colluvial rubble of the fourth system and powdery clayey soil, which is the cause of slope sliding and accumulation, mixed with gravel. The material covered by the slope body is loose gravel soil with large porosity, which provides a channel for surface water to penetrate to the lower part. The slope formed by clay crushed stone is relatively low physical strength, easy to soften by the action of water, or form muddy clay, in this case, the slope is easy to deform.
External Factors
(1) The influence of reservoir level on slope stability: When the water level rises and falls sharply during the operation period of the reservoir, the groundwater level in front of the slope rises or falls rapidly, while the groundwater level in the rear slope body lags behind. For those cases where the saturation of the water intake parts has a stable influence on the reservoir water, the main influence comes from the pore water pressure inside the slope body, which will change with the change of the reservoir water level. This will cause a change in the effective force of the slope, and then bring about a change in the stability of the slope, and finally cause the deformation of the slope. In particular, the slope body next to the reservoir water body is prone to imbalance in the following situations: the effective supporting force of some parts of the slope body will be reduced when the reservoir water rises and falls greatly, and the permeability force caused by the change of groundwater movement influenced by the reservoir water level.
(2) The influence of rainfall on slope stability: The first is the flow path of rainwater, which includes the rainwater running away on the surface of the slope and the rainwater stored in the slope; second, the influence of rainfall will lead to the rise or fall of the groundwater level; third, the soil storage in the slope during the rainfall process and the pressure caused by it on the whole slope; finally, the increase in rainfall also increases the flow of groundwater. Even in the rainy season, the rainfall in the Zhongliang Reservoir area is not large, so the rainfall has little influence on the slope deformation of the Zhengjiadagou slope.
Conclusion
(1) Distinguished from geotechnical engineering, geological engineering, and hydrogeology, studying reservoir slope issues from a hydrological measurement perspective has certain advantages and can yield intuitive results.
(2) From the analysis of deformation control factors, it can be seen that the water level of the reservoir is the most important factor in determining the stability of the slope, and the effect of rainfall on the stability is not obvious.
(3) Using the metabolism GM (1, 1) model, new information GM (1, 1) model, and GM (1, 1) model to predict the deformation trend, the predicted trend is similar, but the average error is: 5.45%, 5.85%, 7.48%, indicating that the three methods can be used to predict the deformation trend, and the prediction accuracy of the metabolism GM (1, 1) model is higher.
(4) The reservoir slope analysis model proposed from the perspective of hydrological surveying in this paper can effectively study the deformation issues of reservoir slopes. The data analysis conducted validates the scientific validity of this model. The research approach and model serve as references and examples for studying other types of slope problems.
(5) Due to the limitation of monitoring means and methods, it is necessary to increase the data source, which is the direction to enrich and improve the model in the future.
(6) The main starting point of this paper is to explore external factors. The next step could be to discuss the impact of internal factors on slope deformation based on this foundation.

