

Introduction
Promoting the harmonious coexistence of humans with nature, focusing on addressing resource and environmental issues, and undertaking basic ecological planning is essential for sustainable human development [1]. A resilient and sustainable city should aim to provide equitable services for all stakeholders [2]. Urban areas in China have developed rapidly yet face numerous challenges such as enhancing land use efficiency, revitalizing existing land, exploring new development models, and reducing energy consumption in cities [3, 4]. It is imperative to develop strategies that optimize resource utilization in and around urban regions. The ecological footprint method (EFM) serves as an effective tool for assessing the balance between resource consumption and ecological capacity. In recent years, the EFM has been progressively refined and expanded in its applications. Niccolucci et al. [5] expanded the ecological footprint (EF) model into a two-dimensional framework and introduced a three-dimensional ecological footprint model (TEFM). Jin Xiangmu et al. [6] applied the TEFM to evaluate the EF and ecological deficit/surplus of Wenzhou from 2000 to 2012, examining the land carrying capacity (LCC) index of Wenzhou. Nonetheless, the uneven spatial and temporal distribution of natural resources, coupled with varying levels of economic development and technological advancement, impacts natural resource consumption and ecological changes. Thus, highlighting the need for a method to assess the coordination between regional EF and economic growth [7]. The Gini coefficient was utilized to assess the allocation and balance of regional resources more effectively [8]. Cheng Chao et al. [9] analyzed the balance of supply and demand, as well as spatial and temporal balance, in the central Yunnan urban agglomeration using the Gini coefficient. Yang Yiyang et al. [10] employed the TEFM and Gini coefficient to determine the EF and carrying capacity of cities in the central sections of the Yangtze River. Wang Shihao et al. [11] defined and explored the distribution characteristics of the spatial structure of the five megacities in Beijing-Tianjin-Hebei, Yangtze River Delta, Guangdong-Hong Kong-Macao Greater Bay Area, Chengdu-Chongqing, and the middle reaches of the Yangtze River. Wang Zhonghua et al. [12] applied the TEFM and Gini coefficient to measure the three-dimensional ecological footprint (TEF), ecological supply-demand balance, and spatial resource balance in resource-based cities of Heilongjiang Province. Current research by Chinese scholars predominantly focuses on the accounting and evaluation of TEF in coastal and resource-based urban agglomerations. However, studies on TEF in the Central Plains Economic Zone, particularly in ZMA, are sparse, and little attention is paid to the spatial balance of TEF in ZMA. Therefore, it is particularly important to study the TEF in the ZMA area and analyze the spatial balance.
With increasing population and rapid urban development, green spaces are being converted into built-up areas, and the strain on ecological resources is becoming more apparent, posing significant challenges to socioeconomic progress [13]. High population densities and intense resource consumption contribute to rapid land use/land cover changes (LU/LC) [14]. Mehmet Cetin et al. [15-17] used GIS hotspot analysis to assess the impact of urban planning on urban land areas. Dibs H et al. utilized low-spatial resolution remote sensing images to derive precise land use and land cover (LU/LC) data, emphasizing the importance of accurate geospatial information for change detection (CD) in updated land use/land cover studies [18-20]. These studies provide essential technical support for urban planning, development, and rational land use. As China undergoes rapid urbanization and focuses on developing the Central Plains urban agglomeration, with ZMA at its core, it becomes crucial to understand the ecological environment status and development level among ZMA cities and to devise appropriate ecological development strategies.
With urban development progressing in the ZMA, the refinement of urbanization is inevitable [21]. There is a pressing need to introduce a method to assess the coordination between regional EF and economic growth [22]. In this study, the TEFM was used to assess the spatial and temporal variation characteristics of the EF and ECC in ZMA from 2014 to 2021 and to determine the degree of overload of the ECC system. Simultaneously, the Gini coefficient is used to examine the spatial balance of the EF. The Gini coefficient can be used to evaluate the allocation and balance of regional resources [23] and explore the trend of ecologically sustainable development. At the same time, the provincial hectare method was used to ensure that the calculation results more accurately reflected the ecological carrying capacity of the study area. In addition, it could also offer some suggestions for the development planning of ZMA.
Materials and Methods
Selection of Study Areas
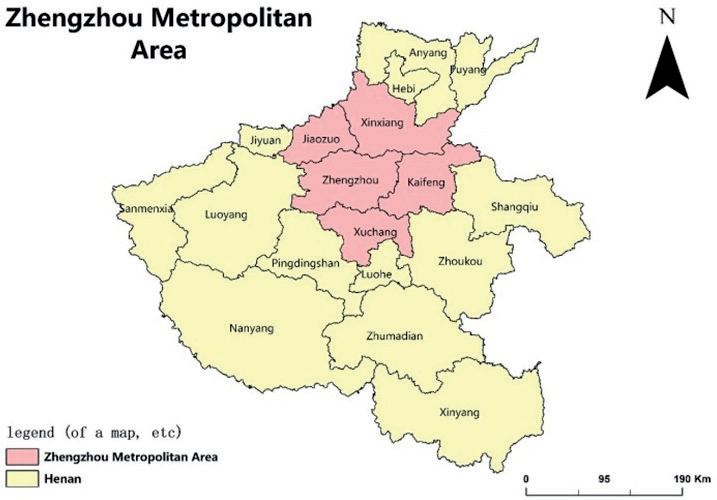
ZMA holds strategic significance for Henan. As outlined in the Central Plains Urban Agglomeration Development Plan by the National Development and Reform Commission, Zhengzhou is designated as the core to facilitate close integration with Kaifeng, Xinxiang, Jiaozuo, and Xuchang, aiming to establish a modern international metropolitan area [24] (Fig. 1). Positioned centrally, ZMA serves as a pivotal link between the southern and northern regions, intersected by key north-south transportation arteries such as the Beijing-Guangzhou and Beijing-Zhuhai routes. Its urban agglomeration construction plays a central role in fostering interconnected hubs and nodes, facilitating the formation of an interactive East-West pattern. With its significant strategic position, ZMA contributes substantially to the concerted development of China’s regional economies. In 2021, ZMA’s population reached 31.601 million, constituting 32% of Henan Province’s population. Its regional GDP stood at 2,427.28 billion, representing 41% of Henan Province’s GDP. ZMA ranks among the regions with robust economic prowess and rapid development in the central and western areas.
Data Sources
The data utilized in this study were sourced from various publications, including Henan Statistical Yearbook, China Urban Statistical Yearbook (2014- 2021), China Energy Statistical Yearbook, Agricultural Technical and Economic Manual (Revised Edition), and Henan Water Resources Bulletin (2014-2021). The calorific value, utilized for calculating the balance factor and yield factor, was derived from the China Energy Statistical Yearbook and Agricultural Technical and Economic Manual (Revised Edition). Population, GDP, Gini coefficient of water resources, and comprehensive Gini coefficient of ZMA were calculated based on data from the Henan Statistical Yearbook and Henan Water Resources Bulletin spanning from 2014 to 2021 [25].
In this paper, consumption is substituted with the output of each city [26]. In instances of missing output data, the average output of neighboring study years is employed. The ECC was computed based on land use planning and general land use planning data in the ZMA.
Methods
Establishing a Consumption Account for Biological and Energy Resources
The natural resources in the EF model are categorized into biological resources and energy resources. Biological resource consumption includes agricultural, forest, aquatic, and animal products, utilizing cultivated land, woodland, grasslands, and water. Energy consumption primarily includes coal, coke, crude oil, diesel oil, fuel oil, electricity, etc. This paper converts the calorific value of fossil fuels, such as coal and oil, into the land area necessary for their production and utilization in construction (Table 1).
The measurement unit for each biological product can be standardized through the “calorific value method” conversion calculation, with calorific values sourced from the Manual of Agricultural Technology and Economy (Revised Edition) [27].
The calculation of the EF for fossil energy consumption in ZMA was conducted employing the carbon sink method [28]. The formula utilized for this calculation is outlined as follows:
where EEF is the energy EF (hm2), Ei is the consumption of energy group i (t), and Mi is the global EF conversion factor (GJ/hm2) for Class I energy fuels.
Table 1.
Energy conversion coefficient and global energy EF conversion coefficient.
Equilibrium Factor and Yield Factor Under “Provincial Hectares”
For a more accurate portrayal of the ecological carrying capacity within the research area, it is crucial to include the five cities of Henan Province in the calculation results. This study utilizes “province hectares” to determine the equilibrium factors and yield factors of the EF within the study area, enabling standardized calculation, comparison, data analysis, and conversion with other units. The term “Provincial hectares” refers to computing EF within an urban region based on the average productivity of each urban region [29].
When computing the equilibrium factor, the equilibrium factor of construction land aligns with that of cultivated land, as the primary source of construction land is typically cultivated land. Similarly, the equilibrium factor of fossil energy land matches that of forest land, given the higher emission of carbon dioxide during fossil energy utilization, with forest vegetation absorbing and converting more carbon dioxide [30, 31]. The calculation of the equilibrium factor and the yield factor proceeds as follows:
(1) Equilibrium factor
The equilibrium factor on the “province hectare” scale is calculated by dividing the average productivity of the same biological type across the entire province by the average of all biological productivity [32]. The precise calculation formula is as follows:
Where qi, pi, p, Qi, Si, Pik, and Xik denote the equilibrium factors of the province category I land, respectively. They represent the average productivity of the province category I land (109 J/hm2), the average productivity of all land in the province (109 J/hm2), the total biological yield of the provincial category I land (109 J), the biological production area of the province category I land (hm2), the yield of biological products in kk of the province category I land (kg), and the unit calorific value of the kth biological product in the provincial category I land (103 J/kg).
(2) Yield factor
The yield factor is characterized as the proportion of the average productivity of a particular ecosystem type within a designated area to the average productivity of similar ecosystem types throughout the entire province. The specific calculation formula is as follows:
Where Yji, Pij, Pi, Qij, Sij, Qi, Si, and Pij represent the yield factors of class I land in city j, the average productivity of class I land in city j (109 J/hm2), the average productivity of class I land in the province (109 J/hm2), the total output of class I land in city j (109 J), the total area of class I land in city j (hm2), the total output of all class I land in the province (109 J), and the total area of class I land in the province (hm2), and the annual production of the k-th product of class I land in city of J (kg).
TEFM
The TEFM was introduced by Niccolucci et al., incorporating both depth and breadth of the footprint and analyzing ecological status from two perspectives: flow capital and stock capital. Fang Kai [33] and Qin Chao [34] developed an enhanced model that conceptualizes EF as a cylinder, with the calculation formula outlined as follows:
where: represents the three-dimensional EF, indicates the depth of the EF, indicates the breadth of the EF, ED is the ecological deficit, and BC is the ECC. Footprint depth refers to the degree of consumption of stock capital, and footprint breadth refers to the actual occupation level of human capital. When EFdepth = 1, the flow capital can only meet the demand for resource consumption. When EFdepth >1, the flow capital cannot meet the demand for consumption, and the stock capital must be consumed.
Drawing from prior research, this paper establishes the land pressure index for various productive lands such as grain, water resources, and carbon sequestration. It then proceeds to analyze and evaluate the LCC of each prefecture-level city within ZMA, incorporating the regional footprint’s depth.
The formula is as follows:
In the formula, the comprehensive LCC index is defined as the depth of the research area footprint, EF is the regional EF, and BC is the area of ecologically productive land in the region.
Evaluation Index of the Spatial Balance of the EF
The Gini coefficient is a widely accepted index utilized to measure income inequality among residents within a country or region. In the context of ecological space, the Gini coefficient assesses the balance, indicating whether the concentration degree of X is reasonable. Ranging between [0, 1], a coefficient closer to 0 signifies a more equitable distribution. According to international norms, a Gini coefficient of 0.4 is generally regarded as the ‘warning line’.
Changes in the Gini coefficient reflect shifts in the regional concentration of factors such as population distribution, economic development, and water resources. Typically, a Gini coefficient below 0.2 indicates “absolute average”, while the range [0.2, 0.3] signifies “relative average”. In the interval [0.3, 0.4], it denotes “relatively reasonable”, and in [0.4, 0.5], it suggests “a large degree of agglomeration”. A coefficient of 0.5 or higher indicates a high concentration of the investigated elements in the region. Three influencing factors – population, GDP, and water resources – are employed as EF evaluation indices. The comprehensive Gini coefficient is calculated to comprehensively analyze the spatial balance of EF in ZMA [35]. The calculation formula is as follows:
Where Gi represents the Gini coefficient, Xi denotes the cumulative percentage of influencing factors like population, GDP, and water resources, and Yi represents the cumulative percentage of per capita EF computed based on the TEFMI serves as the serial number of the area position, and when I = 1, (X, Y) is considered (0, 0). Gt is the comprehensive Gini coefficient.
Results
Analysis of the EF and ECC of the ZMA
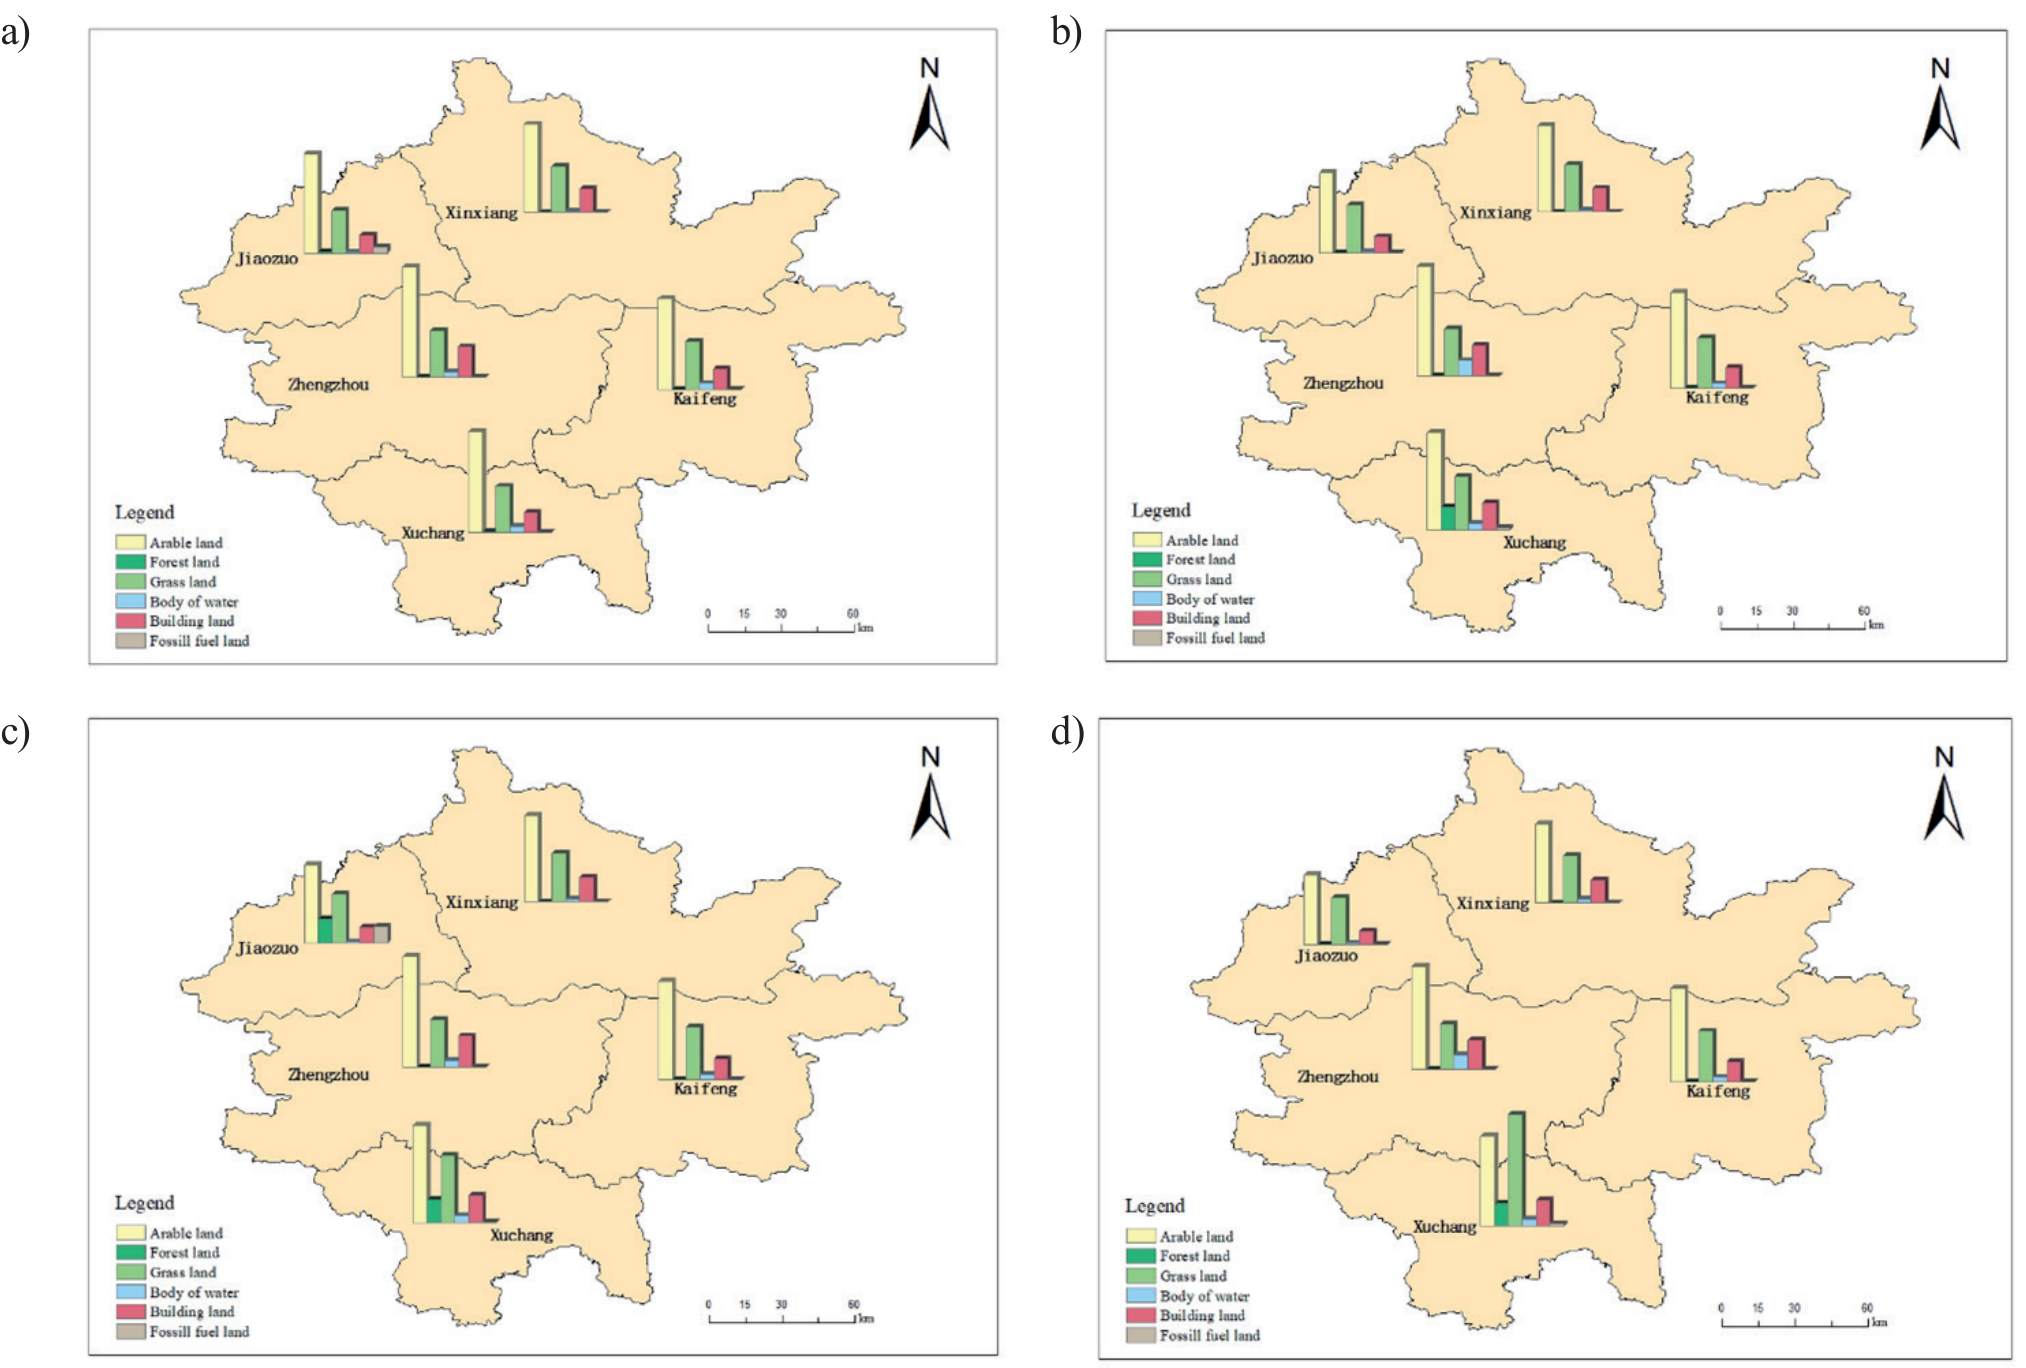
In the ZMA region, Kaifeng stands out with the highest per capita EF of cultivated land, contrasting with Zhengzhou, which exhibits the lowest. Kaifeng benefits from its superior cultivated land quality, favorable production conditions, and significant grain output and consumption. Conversely, Zhengzhou, as the provincial capital, is characterized by its predominantly constructed land and limited cultivated land area. Xuchang offers the highest per capita EF of forest land, while Kaifeng leads in per capita EF of grassland, water area, and fossil fuel land. As for the per capita EF of construction land, Zhengzhou takes the lead. In terms of per capita ECC of cultivated land in ZMA, Kaifeng surpasses others with the highest, while Zhengzhou records the lowest. This high per capita ECC of cultivated land reflects the region’s heavy reliance on grain, a primary consumption product.
From 2014 to 2021, the EF of Zhengzhou and Jiaozuo decreased per capita, that of Kaifeng increased per capita, and that of Xinxiang and Xuchang first increased and then decreased per capita.
Between 2014 and 2021, the per capita ECC of cultivated land and grassland in ZMA experienced an initial increase followed by a subsequent decrease, whereas the per capita ECC of forest land and fossil fuel land decreased steadily. Conversely, the per capita ECC of water area and construction land remained relatively stable throughout this period.
Analysis of Ecological Surplus and Ecological Deficit in ZMA
Fig. 2 illustrates the three-dimensional ecological surplus and deficit per capita in different cities within ZMA from 2014 to 2021. Considering various land types, cultivated land in several ZMA cities experienced an ecological deficit. Conversely, the ecological status of water bodies is satisfactory, with all areas in an ecological surplus state. However, fossil fuel land in various cities predominantly remained in an ecological deficit state. The high energy consumption associated with fossil fuels exacerbates the ecological deficit across different cities, highlighting the significant socioeconomic impact.
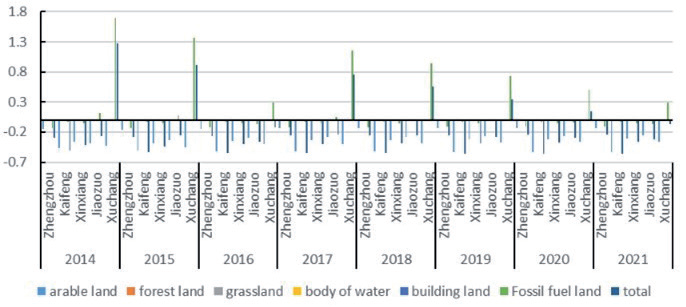
From 2014 to 2021, the overall increase in ecological deficit in ZMA was marginal, affording authorities valuable time to devise and implement necessary remediation measures. However, it is undeniable that the overall development pressure on ZMA is mounting.
Depth Analysis of the TEFM in the ZMA
Fig. 3 illustrates that, apart from Xuchang, all cities in ZMA had a per capita EF depth exceeding 1 from 2014 to 2021. Among these, Zhengzhou exhibited the highest per capita footprint depth in 2014, reaching 9.42 hm2, indicating an exceedance of available natural resources [36]. However, over time, the per capita footprint depth has gradually decreased, suggesting Zhengzhou’s progression towards a development model with comprehensive benefits.
The economic growth in Kaifeng, Jiaozuo, Xuchang, and other areas has resulted in increased demand for construction land, elevated consumption of fossil energy, and a rise in per capita footprint depth. Xinxiang City’s per capita energy value exhibited a pattern of initial increase followed by a decrease, signifying the steady advancement of green development in the city. Moreover, the rapid acceleration of green transformation is evident through the development of green and low-carbon industries.
Evaluation of LCC of Cities in ZMA
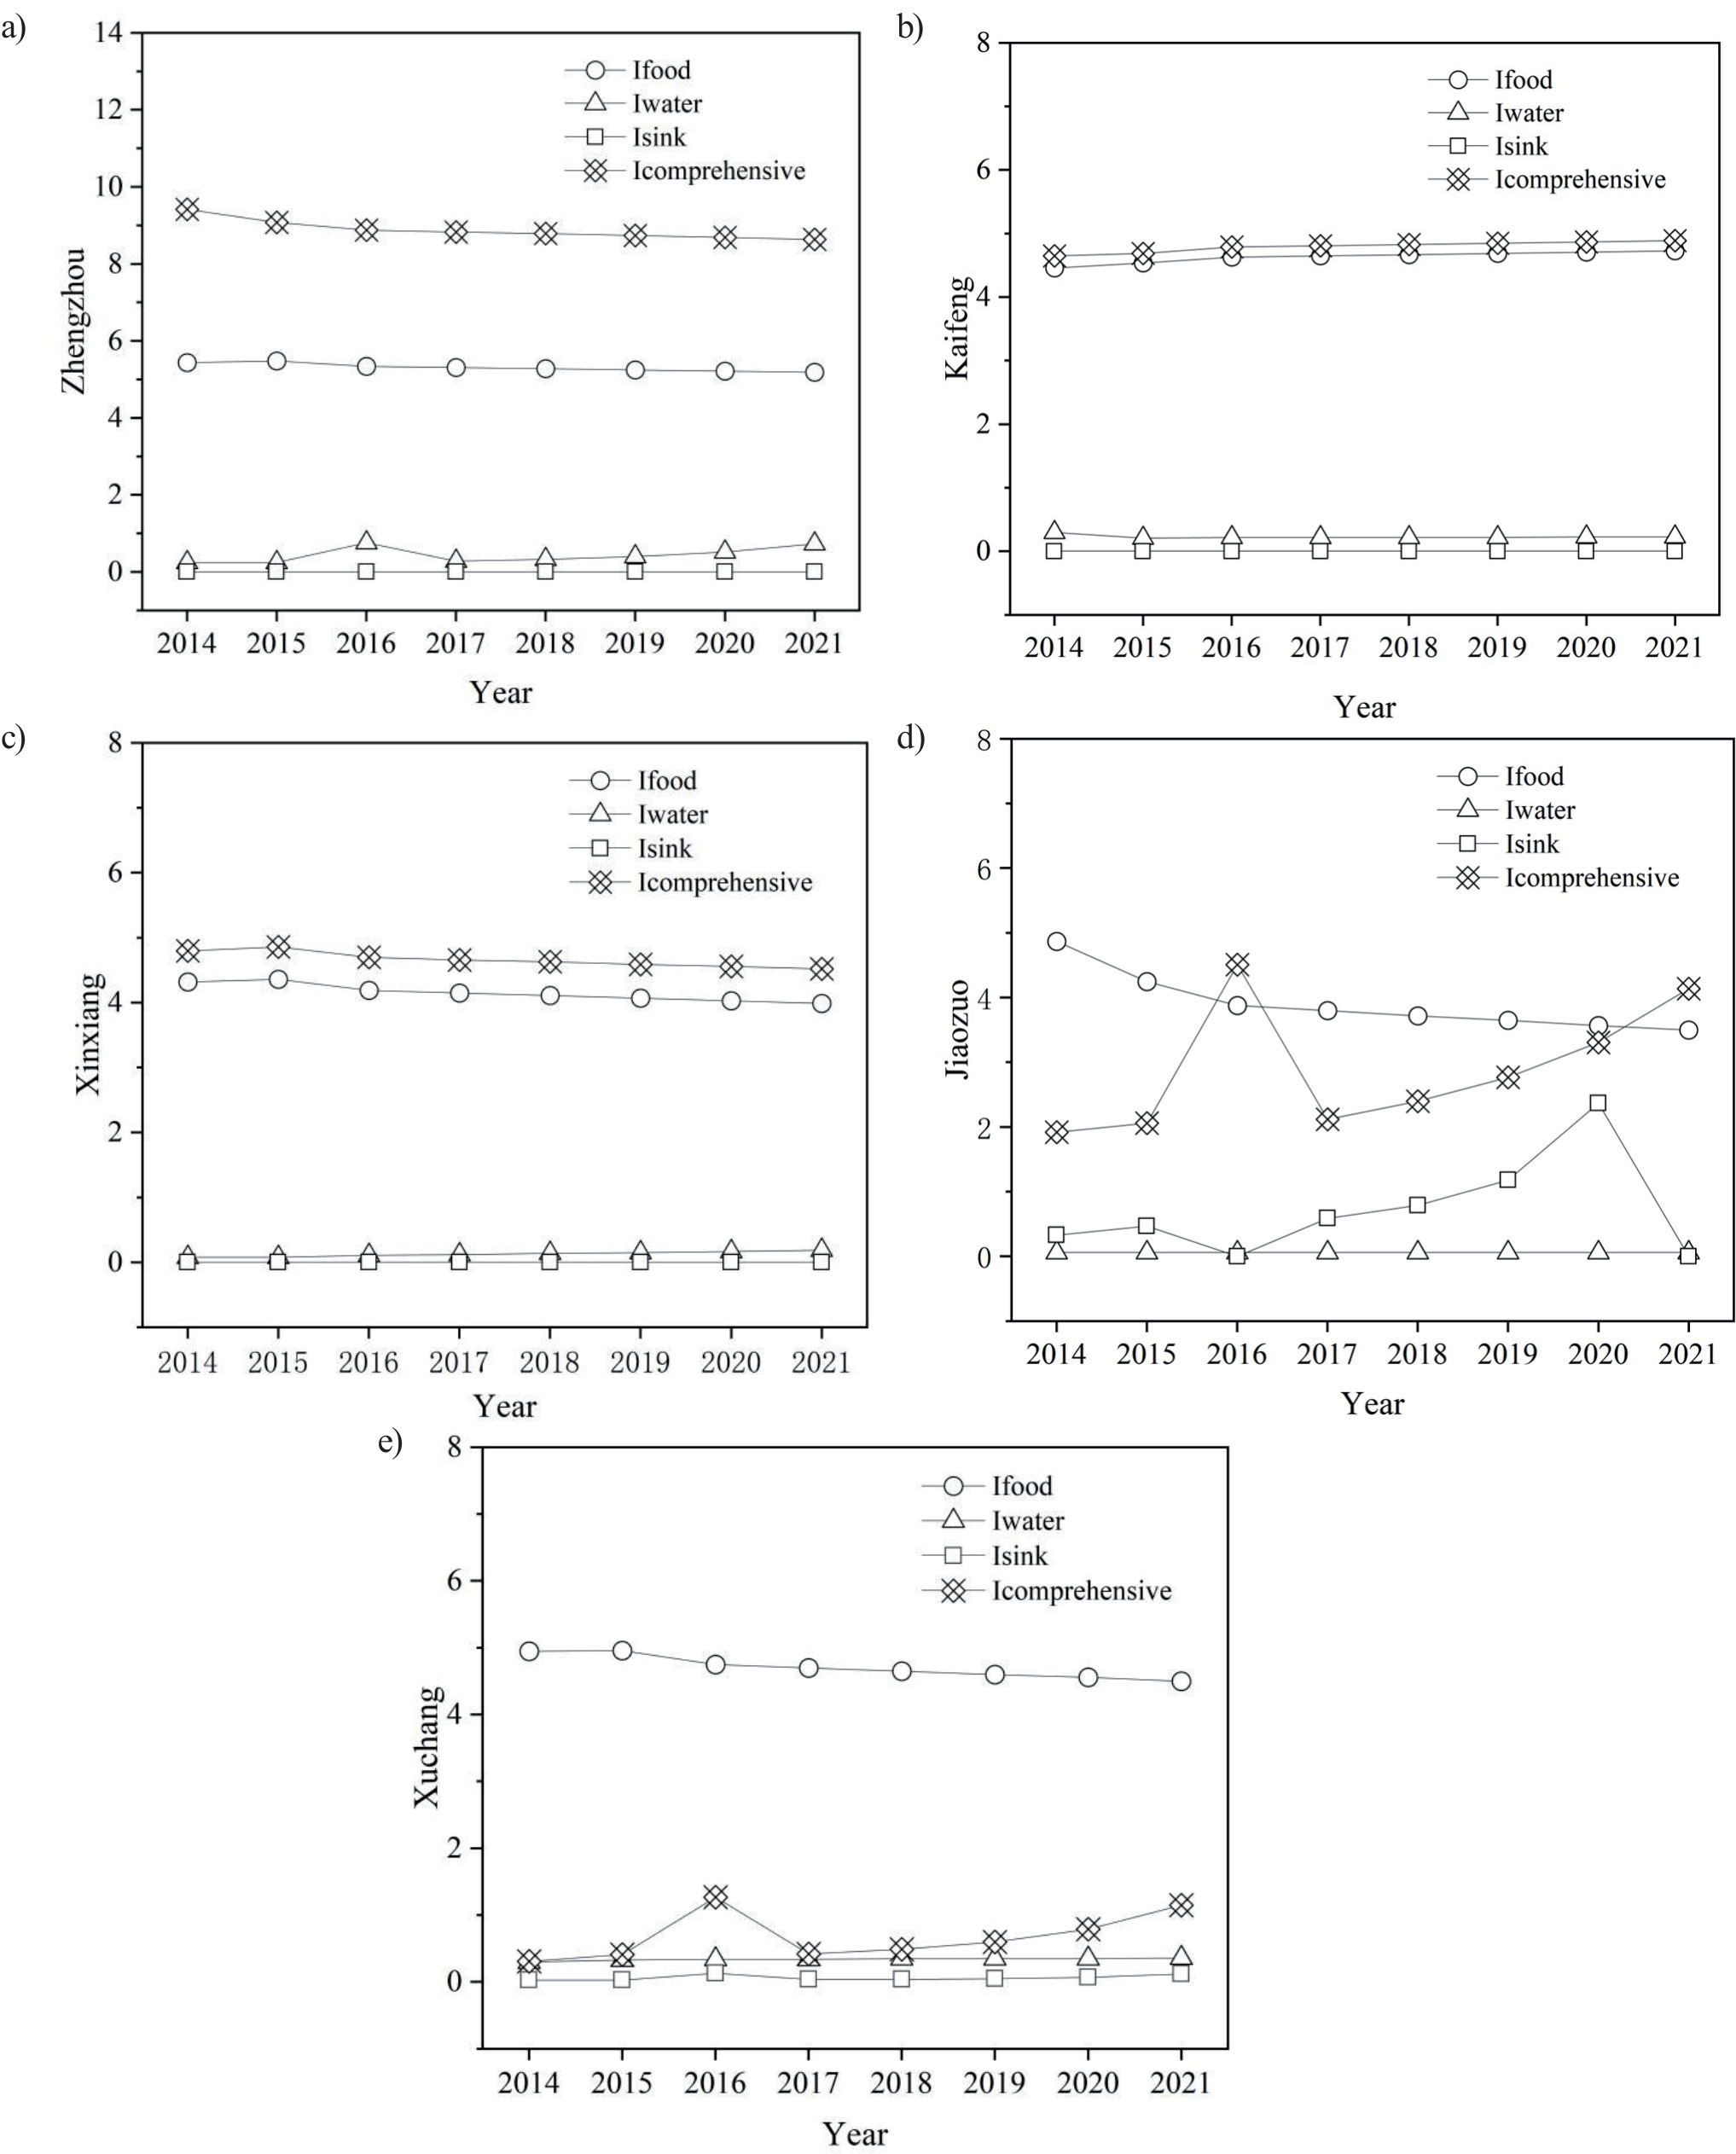
The LCC indices for different cities in the ZMA were calculated for the period of 2014-2021. (Fig. 4). From the index point of view, the comprehensive LCC indices of different cities in ZMA account for the greatest proportion, while those of Zhengzhou and Xinxiang show a decreasing trend, while those of other cities show an increasing trend, while the water resource pressure index and carbon sequestration pressure index account for the lowest proportion. This shows that ecologically productive land consumption in metropolitan areas has caused great pressure on regional LCCs. The land use structure of ZMA needs to be optimized to solve the problem of excessive pressure on LCC.
Fairness Analysis of the EFs
The equilibrium state of the spatial distribution of EFs was reflected by the Gini coefficient. The population, GDP, water resources, and TEFM data of ZMA from 2014 to 2021 were used. The Gini coefficient and comprehensive Gini coefficient among the influencing factors of ZMA are calculated according to equations (8-9) (Fig. 5):
(1) The change in the Gini coefficient of the population reveals a narrow range of fluctuations from 2014 to 2019, all below 0.3, while from 2020 to 2021, there is a clear upward trend, surpassing 0.25. The population’s Gini coefficient exceeding 0.2 falls within the “relative average” range. Conversely, the Gini coefficient of the urban agglomeration population in the central sections of the Yangtze River exceeded the “warning line of 0.4” in 2000, 2008, and 2011-2015, indicating a “greater concentration”. This suggests that compared to the urban agglomeration population of the central sections of the Yangtze River, the central city of ZMA was less appealing to talents from surrounding cities and did not foster its development at the expense of the surrounding areas.
Fig. 4.
LCC index of Zhengzhou (a), Kaifeng (b), Xinxiang (c), Jiaozuo (d) ,and Xuchang (e) in 2014-2021.
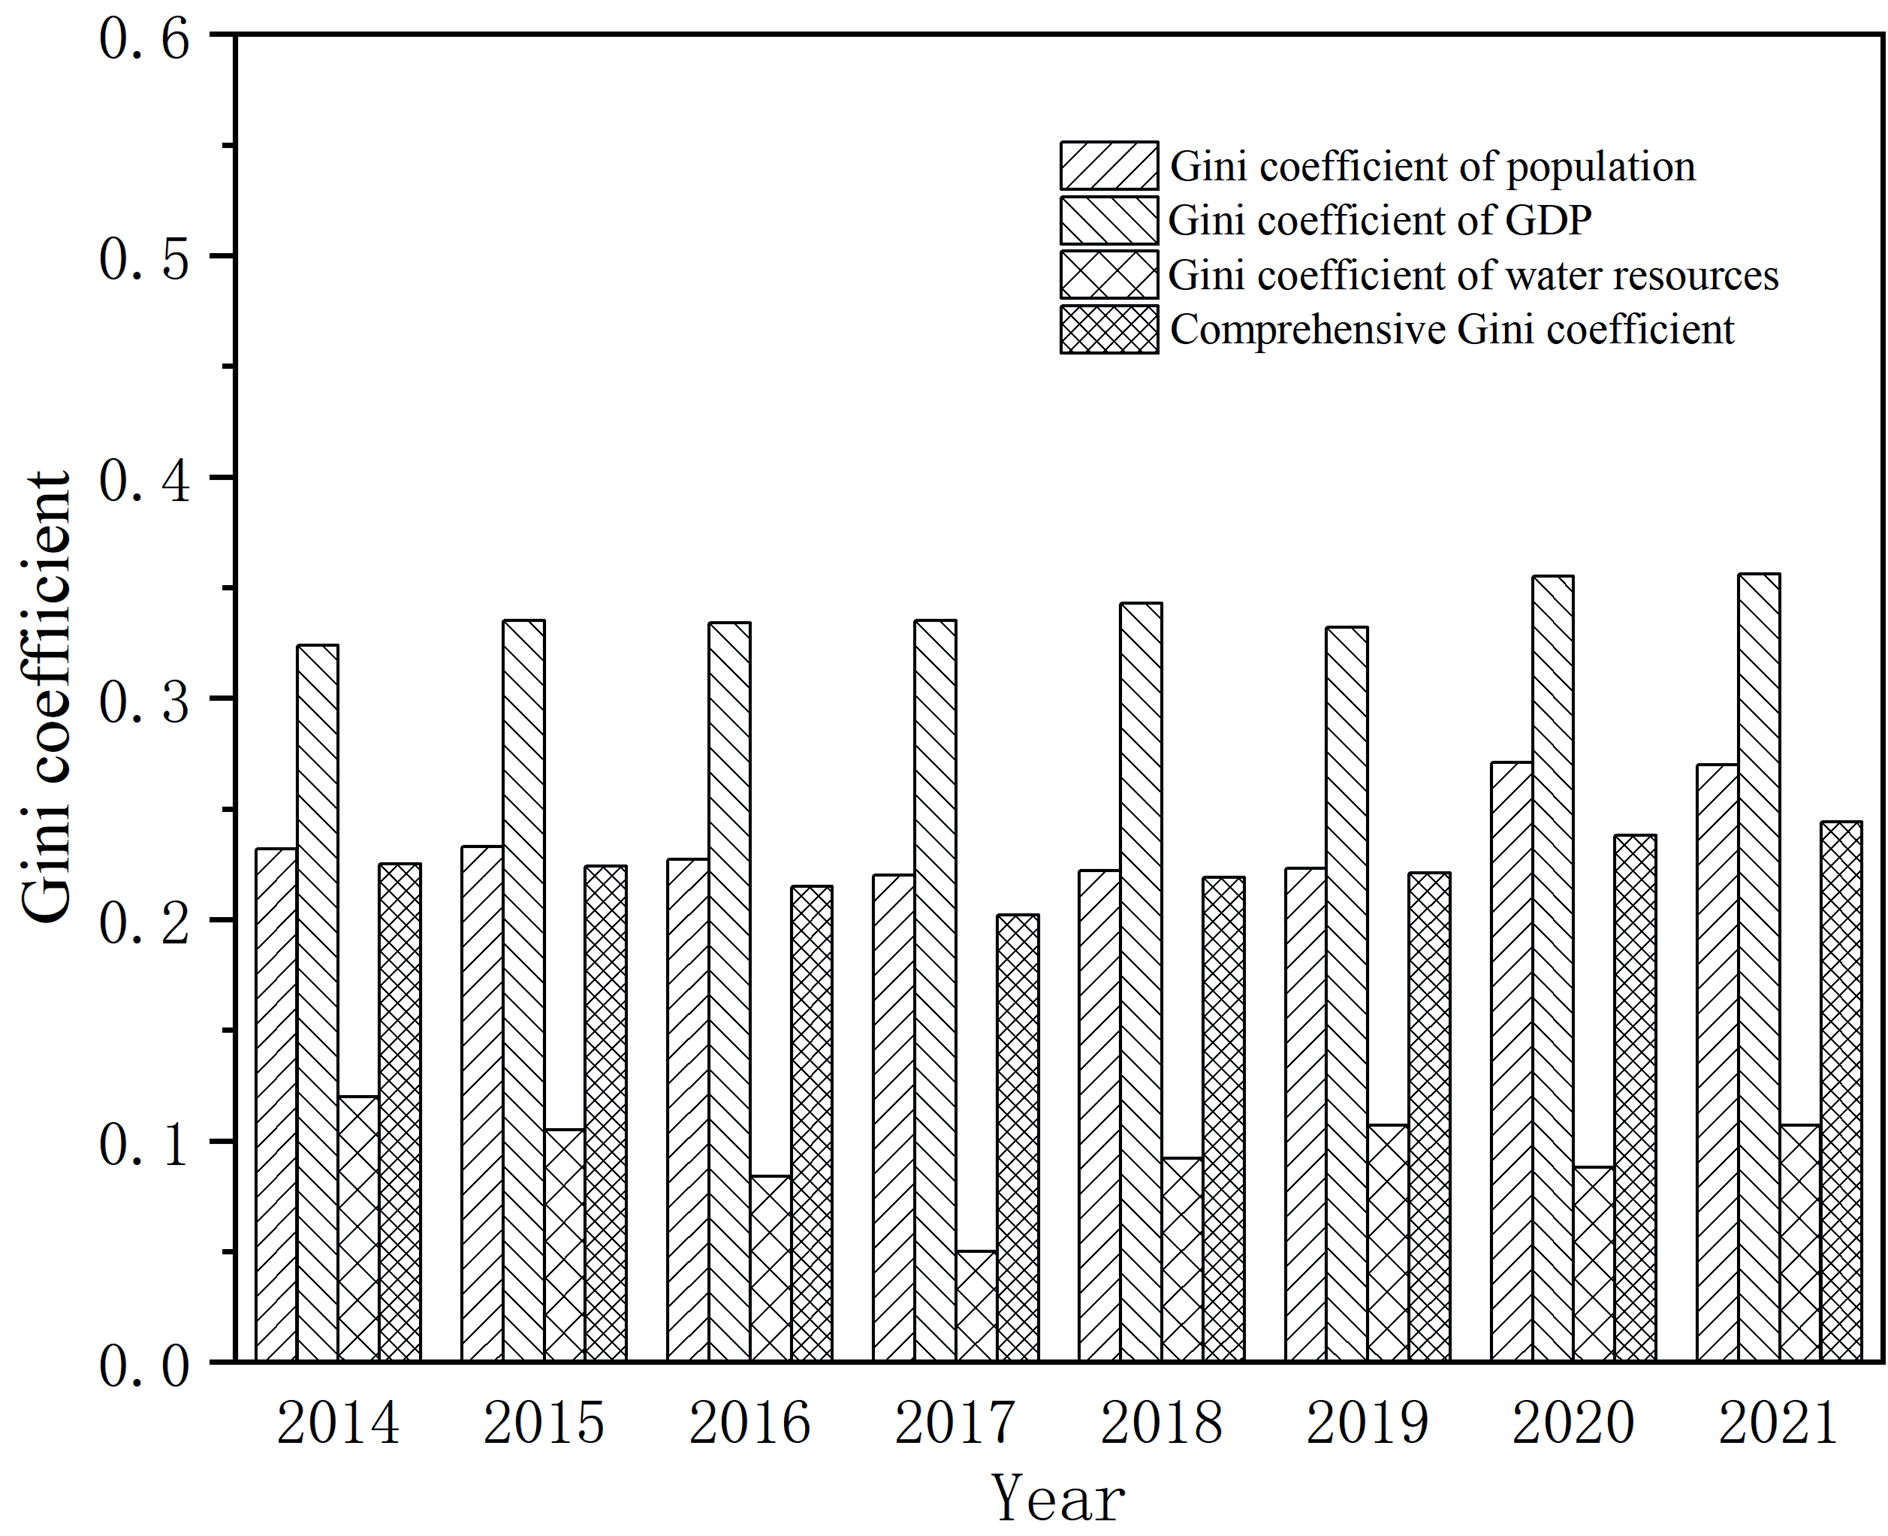
(2) Regarding the Gini coefficient of GDP, the average annual Gini coefficient from 2014 to 2021 stands at 0.339. The highest value recorded is 0.356 in 2021, within a “relatively reasonable” range. Across this timeframe, the Gini coefficient of GDP reflects a state of relative equilibrium. This observation underscores the importance of maintaining a balance between natural resource utilization and economic advancement in ZMA. Notably, the ecological environment in ZMA is gradually rebounding, indicating a reduction in the conflict between economic development and natural capital, a result of the considerable attention given to environmental concerns by both the government and society [37].
(3) From the standpoint of the Gini coefficient of water resources, ZMA’s coefficient values remain consistently low, all below 0.2. They display a “W”- shaped pattern overall, declining annually from 2014 to 2017, with the lowest value reached in 2017. Following this, there was fluctuation during 2017-2020, followed by an uptick in 2021, placing it within an “absolute average” range overall. This trend stems from all five cities in ZMA being water-deficient. Despite their role as transit points for the South-to-North Water Transfer Project and their location along the Yellow River, which serves as a transit river, water resources from the Yellow River are tightly regulated, necessitating state approval for usage. This regulatory framework maintains a state of balanced development overall.
(4) From 2014 to 2021, the overall Gini coefficient of EF in ZMA shifted from 0.202 to 0.244, indicating a V-shaped trajectory. In 2017, the average annual comprehensive Gini coefficient hit its lowest point at 0.202, generally falling within the “relatively average” range. This highlights the high spatial balance of ZMA’s three-dimensional EF, closely linked to the Henan provincial government’s policy of fostering integration and quality-oriented development in the region [38].
Discussion
Using the expanded TEFM and the Gini coefficient, this study examines the LCC, temporal and spatial dynamics, and spatial balance of the ZMA from 2014 to 2021. It has been observed that Zhengzhou, a central national city, serves as the pivotal force in ZMA’s development, with a notable ecological deficit. The per capita ecological footprint in Zhengzhou reaches 9.42 hm2, indicating that the city’s consumption of natural resources surpasses the natural resource flow. Due to varying resource endowments and developmental strategies, other cities within the ZMA also experience ecological strains. Zhengzhou, being the capital of Henan Province, the core of the Central Plains Economic Zone, and a national railway transportation hub, plays a crucial role in the nation’s economic growth during urbanization. Enhancing Zhengzhou’s ecological sustainability is essential for advancing the construction of ecological civilization in the region and beyond [39].
The analysis of the EF and ECC in ZMA reveals that the per capita EF is increasing, LCC is decreasing, and ZMA is generally in an ecological deficit, particularly in the areas of cultivated and fossil fuel land, where the demand for natural resources exceeds supply. Similar ecological pressures are present in other ZMA cities, influenced by their unique resource endowments and development agendas. According to Wang et al., Henan Province faces a substantial deficit due to high consumption of capital stock, particularly in arable and fossil fuel land. Both ZMA and the Wuhan Metropolitan Group are pivotal in China’s urban planning, sharing similarities and differences. These densely populated areas of central China face significant pressures from natural resource consumption and environmental degradation, further compounded by their rapid development [40].
The comprehensive Gini coefficient for the EF of each city in Zhengzhou is below 0.3, indicating a “relatively average” range. The population distribution, economic development, resources, environment, and TEF of ZMA are well-coordinated, with reasonable spatial distribution. The results of the research on the spatial balance of ecological footprints of resource-based cities in Guanzhong urban agglomeration [41] and Heilongjiang Province [42] are consistent. The fairness of the ecological footprint in Guanzhong urban agglomeration surpasses that of the three cases: ecological carrying capacity, economic contribution, and considering both. Additionally, the matching of ecological factors is superior. In Heilongjiang Province, all resource-based cities have a Gini coefficient below 0.3, indicating high spatial balance. Furthermore, the utilization of existing natural resources and energy is maximized. However, the spatial balance of EF in the denser coastal areas of the Beijing-Tianjin-Hebei region, Bohai Bay, Huang-Huai-Hai Plain, Yangtze River Delta, Pearl River Delta, and the coastal areas of Zhejiang, Fujian, and Guangdong shows variability, with fluctuating comprehensive Gini coefficients of the TEF and unbalanced EF distribution, highlighting the need for prioritizing environmental impact and protection [43]. The high spatial balance in the Zhengzhou metropolitan area is closely linked to the integrated urbanization policies of Zhengbian, Zhengxin, Zhengjiao, and Zhengxu, proposed by the Henan Provincial Government.
Based on the conclusions of this analysis, the paper proposes the following policy recommendations to address the ecological deficits and environmental pressures in the Zhengzhou metropolitan area:
(1) It is essential to establish a modern industrial system in the ZMA characterized by a division of labor and coordination. This involves defining the leading industries for each city while promoting differentiated development strategies. Zhengzhou should further enhance its high-end manufacturing sector and foster the growth of a service-oriented manufacturing industry, along with the integration of the tertiary sector. Kaifeng should capitalize on its agricultural and cultural resources to develop urban agriculture and the cultural and creative tourism sectors, aspiring to become an international cultural and tourism city conducive to living, working, and visiting. Jiaozuo and Zhengzhou should enhance their cooperation in tourism, focusing on the development of modern service industries such as cultural tourism, and strive to establish a central hub for the cultural healthcare industry in the Central Plains Economic Zone. Xinxiang should use its manufacturing and innovation strengths to aggressively expand into emerging strategic sectors, including power batteries, new energy vehicles, new materials, and big data, thereby continuously elevating its industrial capacity. Xuchang should prioritize the development of the Xugang Industrial Belt and actively engage in the industrial influence of the Zhengzhou Airport and the Henan Free Trade Zone, aiming to establish itself as an advanced manufacturing and regional logistics hub in the metropolitan area.
(2) Considering the increase in the overall per capita EF and the ecological deficit of the ZMA, it is imperative to achieve a more balanced spatial distribution. This requires the establishment of an integrated development mechanism for the ZMA to ensure sustainable growth and ecological stability across the region. The ZMA integrated development strategy, coordinated land allocation, transportation construction, and industrial layout in the five major areas, accelerated the reform of the household registration system, further relaxed the conditions for settlement in Zhengzhou, and promoted the free flow of population. The industrial division of labor and cooperation mechanism should be established, the industrial layout should be coordinated, the industrial layout should be rationally laid out, a modern industrial system with balanced development should be developed, the spatial and functional layout of Zhengzhou should be improved, the refinement should be continuously deepened, and the advantages and characteristics of the five major cities should be accurately grasped so that Zhengzhou and the other four major regions can achieve dislocation development and complement each other’s advantages.
The provincial hectare method is employed in this study for calculation, avoiding errors arising from fixed average yield computation caused by significant disparities between average yield and the study area. This method offers increased localization and accuracy. Additionally, traditional approaches to yield factor and equilibrium factor determination stem from global-scale research, yielding relatively crude results. In contrast, this study opts for local yield factor and equilibrium factor selection to enhance precision in natural capital utilization estimation within ZMA, thereby reflecting ecological pressure more accurately. Furthermore, traditional EFMs fail to capture the influence of natural capital stock on dynamic environmental changes, unlike the TEFM, which effectively addresses this deficiency and provides a more comprehensive explanation of natural capital utilization efficiency. As indicated in previous research [44], regions with smaller and deeper footprints tend to exhibit less sustainable development. Consequently, this metric can serve as a guiding principle for regional ecological environment assessments and future environmental policy formulations [45]. In addition, this study attempted to evaluate the research methodology, applied the improved TEFM and Gini coefficient to study the balance, and determined that the TEF and its spatial balance are relatively close to reality, which is highly relevant and can provide a methodological reference and reference for relevant research in other regions. This study offers valuable insights for decision-makers to make informed choices in resource allocation, industrial restructuring, and regional development planning. These decisions are based on assessments of regional land capacity and economic potential. However, there are notable deficiencies in model application and data sources. Presently, data primarily rely on existing experiments or statistical findings, lacking sufficient long-term and periodic data. Moreover, several aspects require further exploration. For instance, the study’s focus on limited resource types excludes considerations like water resources. Therefore, future research could explore additional footprint indicators, such as three-dimensional water footprint and carbon footprint, to establish a more comprehensive footprint family system.
Conclusions
Utilizing an expanded TEFM, this study calculated the EF, footprint depth, and ecological deficit surplus of the ZMA from 2014 to 2021. Within the TEFM framework, indicators such as food pressure, water pressure, carbon sink pressure, and the comprehensive land carrying capacity index were established to assess ZMA’s LCC. Additionally, the Gini coefficient model was employed to analyze the spatial distribution of EF within ZMA. The key findings are as follows: (1) Throughout the period from 2014 to 2021, the overall per capita EF depth of ZMA exhibited a declining trend yet remained above 1. Notably, Zhengzhou registered the highest per capita EF depth at 9.42 hm2, indicating more pronounced ecological and environmental challenges compared to other cities in the region. (2) The per capita EF of ZMA increased and the LCC decreased, resulting in an overall ecological deficit. This deficit was particularly severe in arable land and fossil fuel land. Only Xuchang City’s comprehensive land carrying capacity index fell below 1.5, indicating a relatively balanced state, while other cities experienced overload conditions. ZMA’s LCC confronts significant challenges. (3) At the level of ecological balance, the Gini coefficients of ZMA remained below the warning line of 0.4, indicating substantial spatial balance. This balance facilitates the optimal utilization of natural resources and energy within the region. Based on these findings, future research should focus on strengthening TEFM prediction studies and quantitatively analyzing, evaluating, and monitoring the sustainable development dynamics of the research objects. This effort aims to contribute to the sustainable development of the Central Plains urban agglomeration and the realization of ecological civilization, fostering harmonious coexistence between humanity and nature.

