

Introduction
Grasslands occupy about 40% of the planetary land cover [1]. Grazing changes over 60% of the earth’s agricultural land [2], making grazing the most important and widespread use of global grasslands [3, 4]. Knowledge about the influence of grazing on grassland soil is, thus, necessary to enhance the level of grassland management.
Soil extracellular enzymes, mainly secreted by microbes, play crucial roles in degrading organic matter and providing bioavailable nutrients for microbes [5]. For instance, β-glucosidase can hydrolyze simple sugars, providing labile C, N-acetylglucosaminidase can hydrolyze chitooligosaccharides, leucine-aminopeptidase can degrade peptide bonds in proteins [6], providing bioavailable N. Acid phosphatase can hydrolyze phosphate, providing bioavailable P. As investments made by microorganisms to obtain elements, these enzyme activities are useful markers of soil microbial C, N, and P requirements [5]. The vector analysis based on these enzyme activities [7] has been widely used for the quantification of soil microbial elemental limitations [8]. For example, Wang et al. [9] used this method and suggested that soil microbial communities in grazed grassland were under soil N and P co-limitation. Ding et al. [10] showed that grazing exacerbated the microbial carbon limitation of surface soil. Soil extracellular enzyme activity and microbial resource limitation profoundly reflect soil quality [11] and impact the carbon use efficiency of soil microbiota [12]. Therefore, understanding soil enzyme activity and soil microbial element resource limitations can enhance our understanding of soil carbon and nutrition supply from the perspective of microbial communities [9]. Nevertheless, the impact of grazing on soil enzyme activity and soil microbial element resource limitations is still not fully understood [11], especially in the subtropical grasslands of southern China.
Increasing numbers of studies have been implemented to estimate the responses of soil physical environment, chemical properties, and stoichiometry in grassland to grazing [3, 13, 14]. Some studies found that, compared with no grazing, grazing could modify the soil’s physical environment by degrading soil structure, decreasing porosity [15], decreasing the air and water permeability of soil [16], mechanical resistance [17], increasing soil bulk density (BD) [16-18], and lowering pH [19-21], temperature [22], and reduced infiltration rate [18, 23], and soil moisture [18, 20, 24, 25]. For example, grazing increased BD, pH, and temperature by 32.90%, 1.02 units [13] and 9.85% [26], decreased soil WC by 20.75% [27]. The influence of grazing on soil physical environment also differs between soil depths and grazing intensities. For instance, grazing increased the BD (resistance to penetration) of 0-5, 5-10, and 10-15 cm soils by 15.55% (57.74%), 4.69% (23.63%), and 1.23% (2.97%) [23]. Moderate grazing increased the soil BD by 7.5%, whereas heavy grazing increased it by 11.3% [25]. However, it is still unknown whether the changes in soil physical environment induced by grazing affect the limitation of soil microbial elements and the activity of soil carbon, nitrogen, and phosphorus acquisition enzymes.
In addition to changing physical properties, compared with no grazing, grazing changed soil nutrient availability and cycling in several pathways, such as the deposition of urine and dung [15], altering plant community structure, and litter [28]. The negative effects of grazing on grassland biomass are commonly reported [29]. Grazing decreased the vegetation cover, biomass [30], and litter [31]. For instance, grazing decreased plant coverage, aboveground biomass, belowground biomass, and litter by 23.90% [32], 14%-58.34% [20, 29, 33], 38%-45.11% [27, 29, 33, 34], 5.2%-23.13% [27, 29, 34], 51.41%-95.19% [29, 32-34], whereas increased the ratio root to shoot by 17.03%-30.58% [20, 29]. These might lead to reductions in aboveground and belowground plant C input into soils [35]. Soil nutrient concentrations represent the amount of nutrient provision, whereas nutrient stoichiometric ratios reflect nutrient balance [5]. Grazing changes soil nutrient concentrations and stoichiometric ratios [12]. Some studies showed that grazing significantly declined soil organic carbon (OC), total nitrogen (TN) [33], total phosphorus (TP) [20], available phosphorus (AP) [13, 36], and the ratio of soil C and N [22, 27]. In contrast, grazing increased OC, TN, and TP [37], decreased soil available nitrogen (AN), increased the ratio of soil N and P [36], increased the ratio of soil C and P [38], and increased the ratio of soil C and N [38]. Grazing had no significant effects on soil AP [20]. However, no effects on total soil C, N [17, 21], organic C [39], and soil AN, the ratios of soil C and P and soil N and P [22], or the ratio of soil C and N [40] were observed. The promotion and inhibition influences of grazing on calcium, magnesium, and potassium were also reported [13, 21, 41]. This inconsistency implies the importance of further research. However, it is still unknown whether changes in soil chemical properties induced by grazing affect soil microbial element limitation and soil carbon, nitrogen, and phosphorus acquisition enzyme activity.
Altogether, compared with the studies on soil physicochemical properties, the studies on the effects of grazing on ecto-enzyme activities and their influencing factors remain relatively scarce. Shifting soil microbial communities between elemental limitations by grazing has received little attention to date [9]. Therefore, the aim of this work was to compare the effects of grazing and non-grazing on ecto-enzyme activities and microbial element limitations of soils and to identify the influencing factors of enzyme activities and element limitations at five depths of subtropical grassland in China.
Material and Methods
Region Description, Designing and Soil Sampling
The study region was in a 6,000 hectares natural grassland in Longli County (26°19′N-26°24′N, 106°51′E-106°55′E) of Guizhou, SW China. This region experiences a subtropical monsoon humid climate, the annual temperature is ca.14.8°C, and the annual precipitation is about 1100 mm [10]. The regional soil type is Haplic alisols [5, 8]. The grazing and non-grazing areas were distributed in this grassland. The grazing rate is one buffalo/hectare [10].
Between September and October 2017, three grazed and non-grazed sites (i.e., three 1 m × 1 m plots) were set in long-term (two decades) buffalo grazing and non-grazing areas, respectively. Three soil cores were drilled using ring cutting at each site and blended to a composite sample as a replicate, resulting in 30 composite soil samples in all (five soil depth (0-5, 5-10, 10-20, 20-30, 30-50 cm) × three sites (i.e., three replicates) × two treatments (grazing and non-grazing). The composite sample was then separated into sub-samples for the following determination.
Assay of Soi Physicochemical Attributes and Ecto-Enzyme Activities
Soi physicochemical attributes and ecto-enzyme activities were assessed based on the approach described in our earlier works [5, 10]. Briefly, soil bulk density (BD) was tested using a cutting ring. Water content (WC) was tested in an oven at 105ºC. pH was tested using a pH meter. Organic carbon content (OC) using an elemental analyzer, inorganic carbon content (IC) using the HCl method, total nitrogen content (TN) was tested by sulfuric acid digestion, nitrogen availability (AN) was analyzed by the Alkali diffusion approach, total phosphorus content (TP) was using sodium hydroxide digestion, phosphorus availability (AP) was determined by the NaHCO3-ultraviolet spectrometer subsystem, potassium availability (AK) was by a flare photometer, calcium availability (ACa) and magnesium availability (AMg) were by an atomic absorption spectrophotometer. Total carbon content is the sum of OC and IC. Four extracellular enzyme (β-glucosidase (βGC), Leucine aminopeptidase (LAP), N-acetyl glucose aminidase (NGA), and acid phosphatase (ACP)) activities were determined by Shanghai Enzyme-Linked Biotechnology Co. (CN) [42].
Statistical Analysis
The soil nutrient stoichiometry ratio was represented as a mass ratio. Vector analysis was applied to measure the limitations of soil microbial carbon, nitrogen, and phosphorus based on the four extracellular enzyme activities [5]. A two-way ANOVA was used to determine the influences of soil depth, group (grazing or non-grazing), and the interaction between soil depth and group on the soil physicochemical attributes, the ecto-enzyme activities, the stoichiometric ratio, and the length and angle of the vector using the R function “anova”. The Wilcoxon test or t test was used to determine the significance of differences in the soil physicochemical attributes, the ecto-enzyme activities, the stoichiometric ratio, and the length and angle of the vector, by using the R function “wilcox.test” or “t.test”. Random forest analysis with 20-fold cross validation was applied to identify the important factors that significantly explained the variation of soil ecto-enzyme activities and soil microbial elemental limitations using the R packages “randomForest” and “A3”. The R package “ggplot2” was applied for the visualization of results. These analyses and visualizations were performed in R v4.0.5 (https:// www.r-project.org/).
Results and Discussion
Grazing Changes the Nutrient Contents and Stoichiometric Ratios of Soil.
Two-way ANOVA showed that soil depth, group (grazing and non-grazing) and the interaction between soil depth and group significantly changed soil AP (p = 0.00641, 0.01317, 0.04739), AK (p = 9.367e-07, 0.01463, 0.00911), ACa (p = 6.702e-09, 3.757e-11, 3.537e-07), AMg (p = 1.592e-08, 1.019e-06, 9.355e- 07), BD (p = 0.0017002, 0.0001306, 0.0042800), WC (p = 0.0041843, 1.917e-05, 0.0001234), βGC (p = 8.652e-09, 1.221e-05, 0.002097); the group and the interaction, but not soil depth, significantly changed pH (p = 1.327e-06, 0.002312, 0.285276); soil depth rather than the group and the interaction significantly changed TC (p = 2.375e-05, 0.81663, 0.08621), OC (p = 9.292e-05, 0.9670, 0.1229), TN (p = 5.269e-07, 0.4947, 0.7745), AN (p = 1.842e-06, 0.0812, 0.5216), NAG (p = 0.01019, 0.13498, 0.52822), soil depth and the interaction rather than group significantly changed TP (p= 9.576e-07, 0.87907, 0.00438), and ACP (p = 9.456e-06, 0.287338, 0.002756). However, soil depth, group, and the interaction did not significantly change IC (p = 0.4034, 0.1025, 0.6166) and LAP (p = 0.3916, 0.2046, 0.2180).
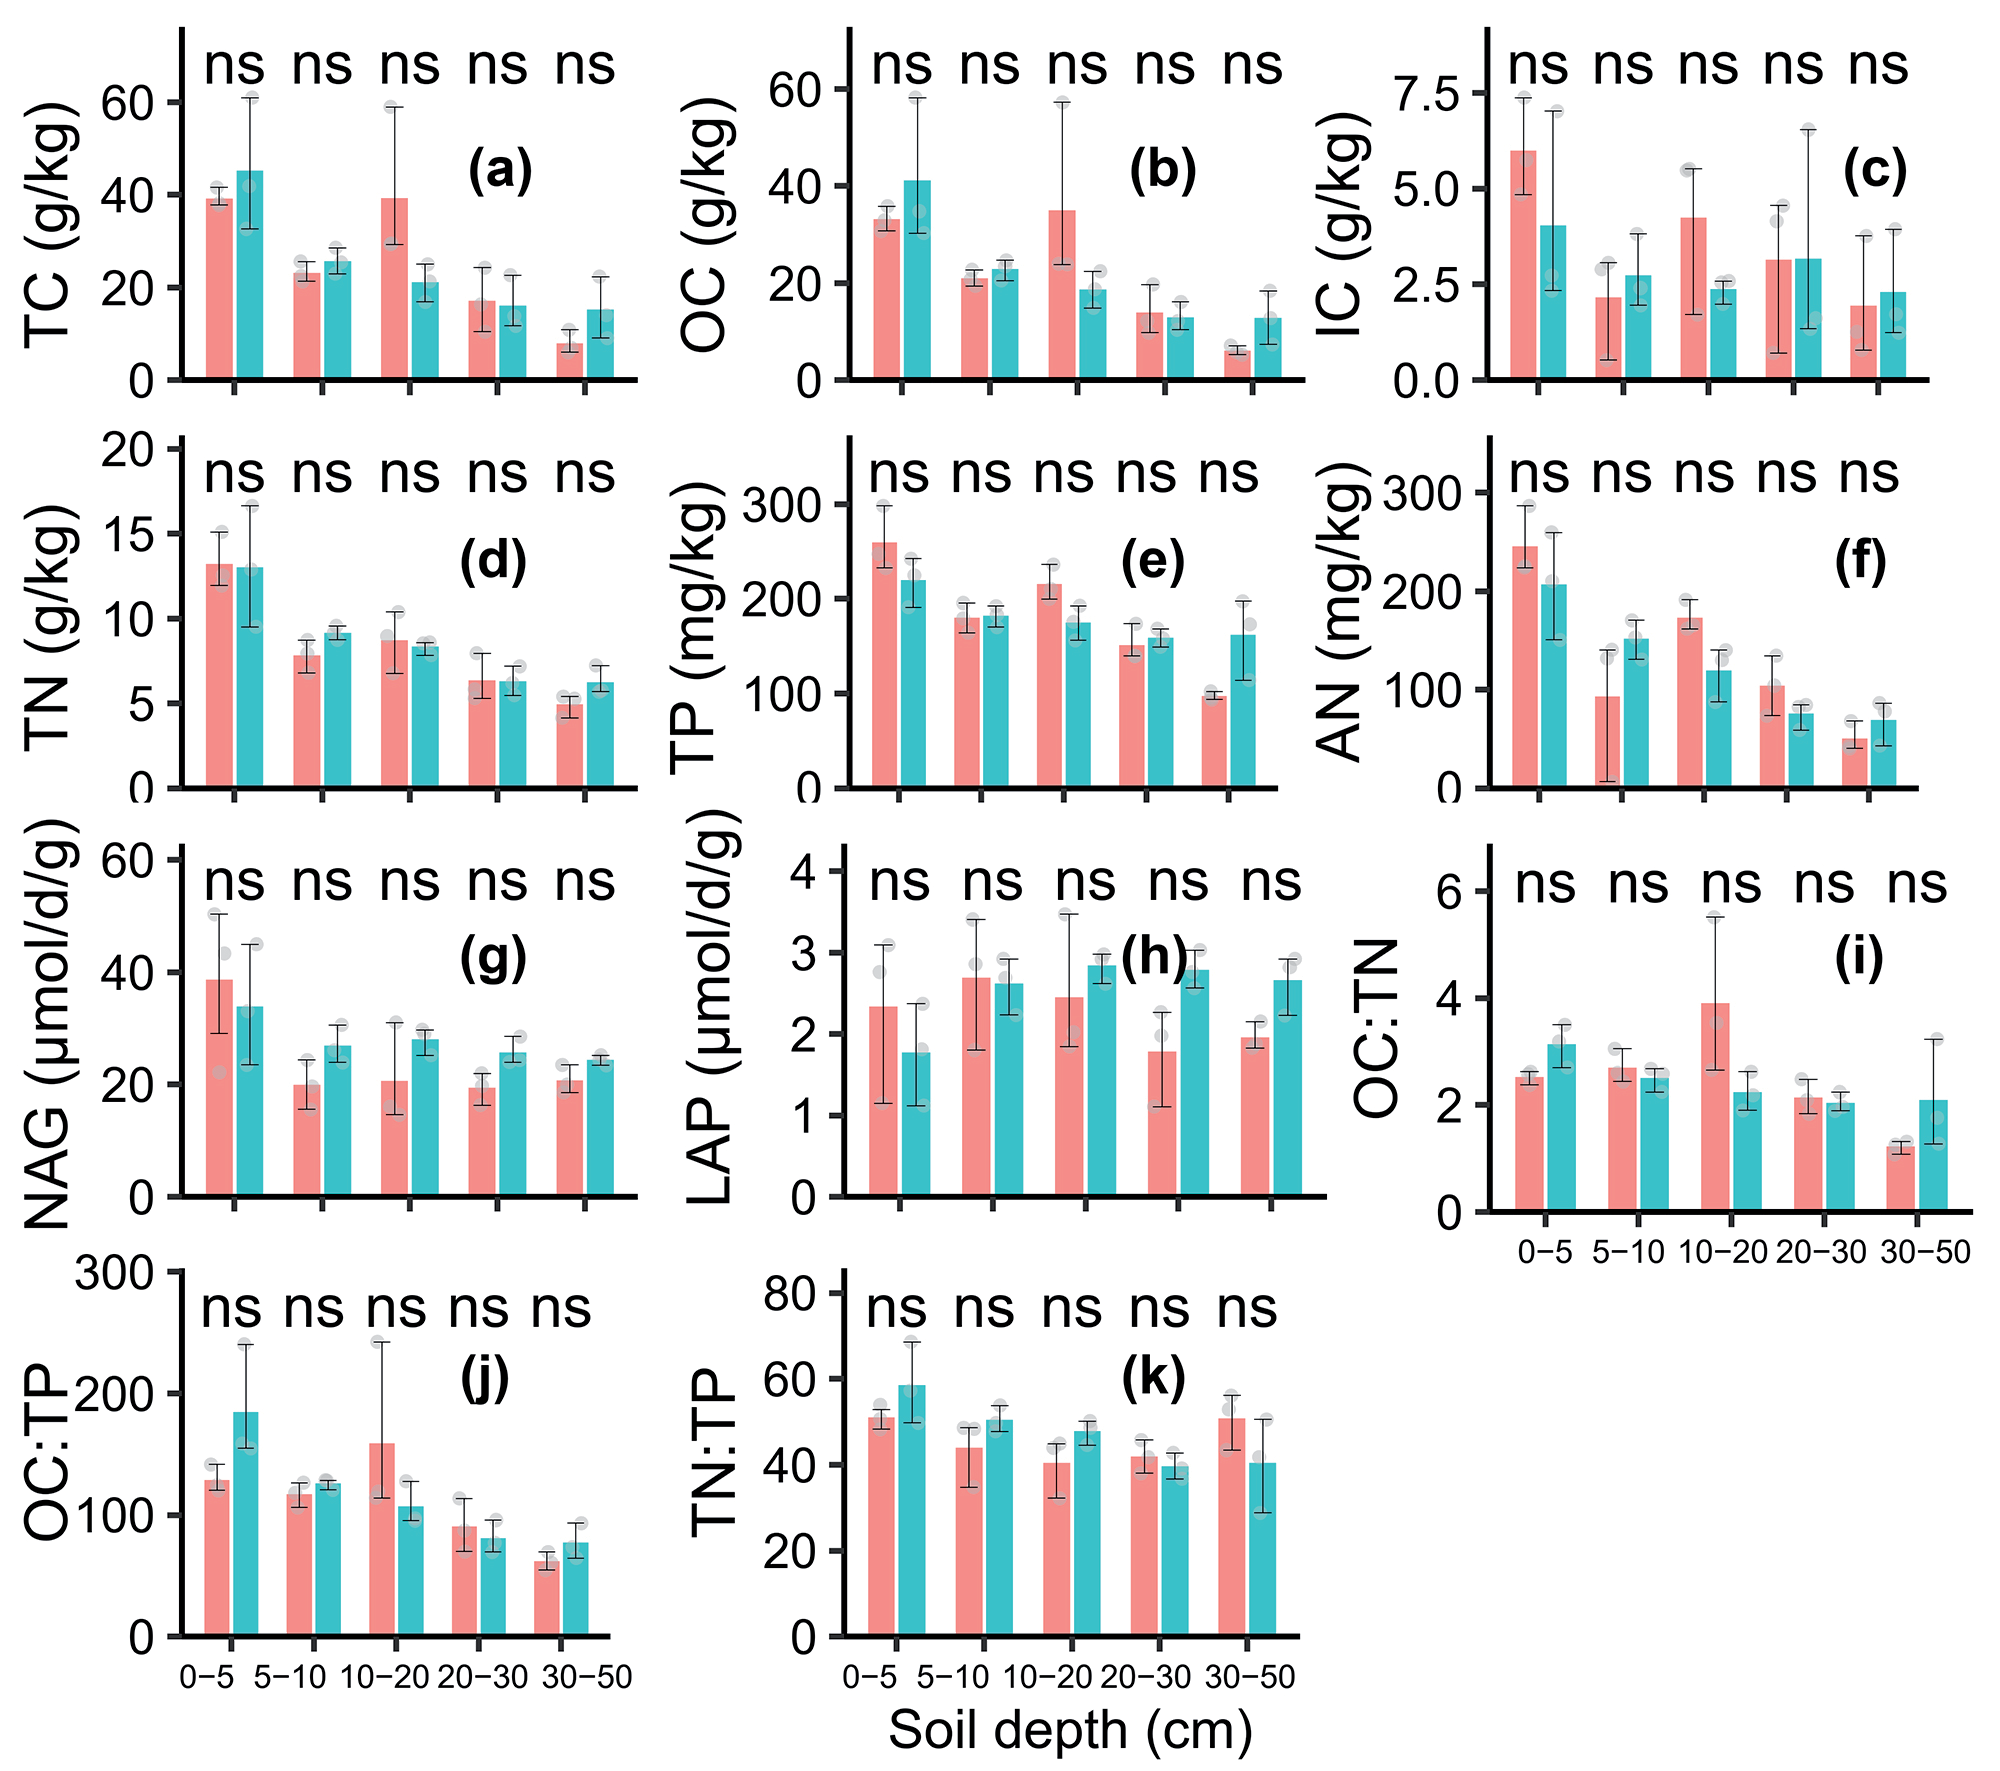
Our work described that grazing has an influence on soil nutrient contents and stoichiometric ratio at five depths. Compared with no grazing (Fig. 1), grazing significantly declined the 0-5 cm soil AP (p = 0.0250) by 73.10%, the 0-5 (p = 0.0042), 5-10 (p = 0.0090), 10-20 (p = 0.0034) cm soil WC by 47.19%, 37.19% 30.80%, however, grazing significantly increased the 0-5 (p = 7.9e-05), 5-10 (p = 0.0177), 10-20 (p = 0.00067), 20-30 (p = 0.01368) cm soil ACa by 188.76%, 93.24% ,84.18%, and 38.77%, the 0-5 (p = 0.0016), 5-10 (p = 0.0109) cm soil AMg by 186.69%, 78.89%, the 0-5 cm soil βGC by 89.49% (p = 0.0011), the 0-5 (p = 0.0300), 5-10 (p = 0.0240) cm soil ACP by 7.87%, and 6.57%, respectively. However, consistent with some previous findings but likely going against our intuition, this study showed that grazing did not alter soil total carbon content [43], organic carbon content [24, 43, 44], inorganic carbon content, or total nitrogen content [24, 44], available nitrogen content, total phosphorus content [24, 44, 45], available potassium, OC:TN [44, 46], OC:TP [44, 46], and TN:TP [44] at different depths, indicating neutral effects of grazing. However, other previous studies suggested significantly negative [13, 20, 46-50] and positive [51-53] effects of grazing. The reasons for this inconsistency could be explained by the variation in grazing intensity, climate background, and scales. The stoichiometric ratios of soils C, N, and P have long been considered a crucial factor shaping nutrient limitation [37]. Our results showed that soil depth and the interaction rather than group (grazing and non-grazing) significantly changed OC:TN (p = 0.004944, 0.669023, 0.017570), OC:TP (p = 0.0004231, 0.7369789, 0.0733796), TN:TP (p = 0.01630, 0.46398, 0.09694, Fig. 2). Although grazing did not significantly change soil stoichiometry, the OC:TN is almost half the value of 10.1 in global grassland soils, and the OC:TP is ca. two times the value of 24.9 in global grassland soil, TN:TP are ca. 16-times the value of 2.5 in global grassland soil [54]. This suggested that this ecoregion’s soil is under N saturation but P limitation for the vegetation [55]. The total and available nitrogen have not been changed by grazing (Fig. 2). Two potential reasons can explain this situation. On the one hand, N is saturated in this land; on the other hand, the majority of N is returned to the soil as excrements [51]. Furthermore, in this study, OC:TP is <200, implying soil P mineralization [37, 56]. Grazing lowered the OC:TP of 0-5 cm soil by 30.24% (Wilcox test p = 0.1, Fig. 2). This indicated that grazing enhanced the phosphorus mineralization of 0-5 cm soil. This situation may lead to a reduction in available phosphorus due to runoff, leaching, and plant intake. Grazing increased foliar P [50, 57], which indicated an increase in the intake of available phosphorus by plants. As is well known, in an ecosystem, the runoff and leaching induced-loss of available phosphorus may lead to a decrease in total phosphorus, but the total phosphorus in our study did not decrease (the mean value increased, Fig. 2), it could be speculated that the available phosphorus was likely reduced by the plant’s intake. As expected, consequently, grazing decreased the available phosphorus content [13, 21, 50, 58] of 0-5 cm soil. Interestingly, contrary to previous findings [58], grazing increased the available calcium and magnesium contents [57, 59]. Two potential mechanisms may simultaneously explain the increasing effect of grazing on available calcium and magnesium. (1) Excretion could elevate the soil’s calcium and magnesium availability [60]. (2) Grazing accelerates soil weathering [61], which enhances the availability of calcium and magnesium. Besides, the higher availability of calcium and magnesium in grazing soils was conducive to the improvement of soil pH (Fig. 1). Collectively, grazing mainly affected topsoil chemical properties [62], which confirms previous findings [53, 61].
Fig. 1.
Soil physicochemical attributes and ecto-enzyme activities (that changed significantly by grazing) under grazing and no grazing. AP, phosphorus availability; AK, potassium availability; ACa, calcium availability, and AMg, magnesium availability; BD, bulk density; WC, water content, βGC, β-glucosidase activity; ACP, acid phosphatase activity.
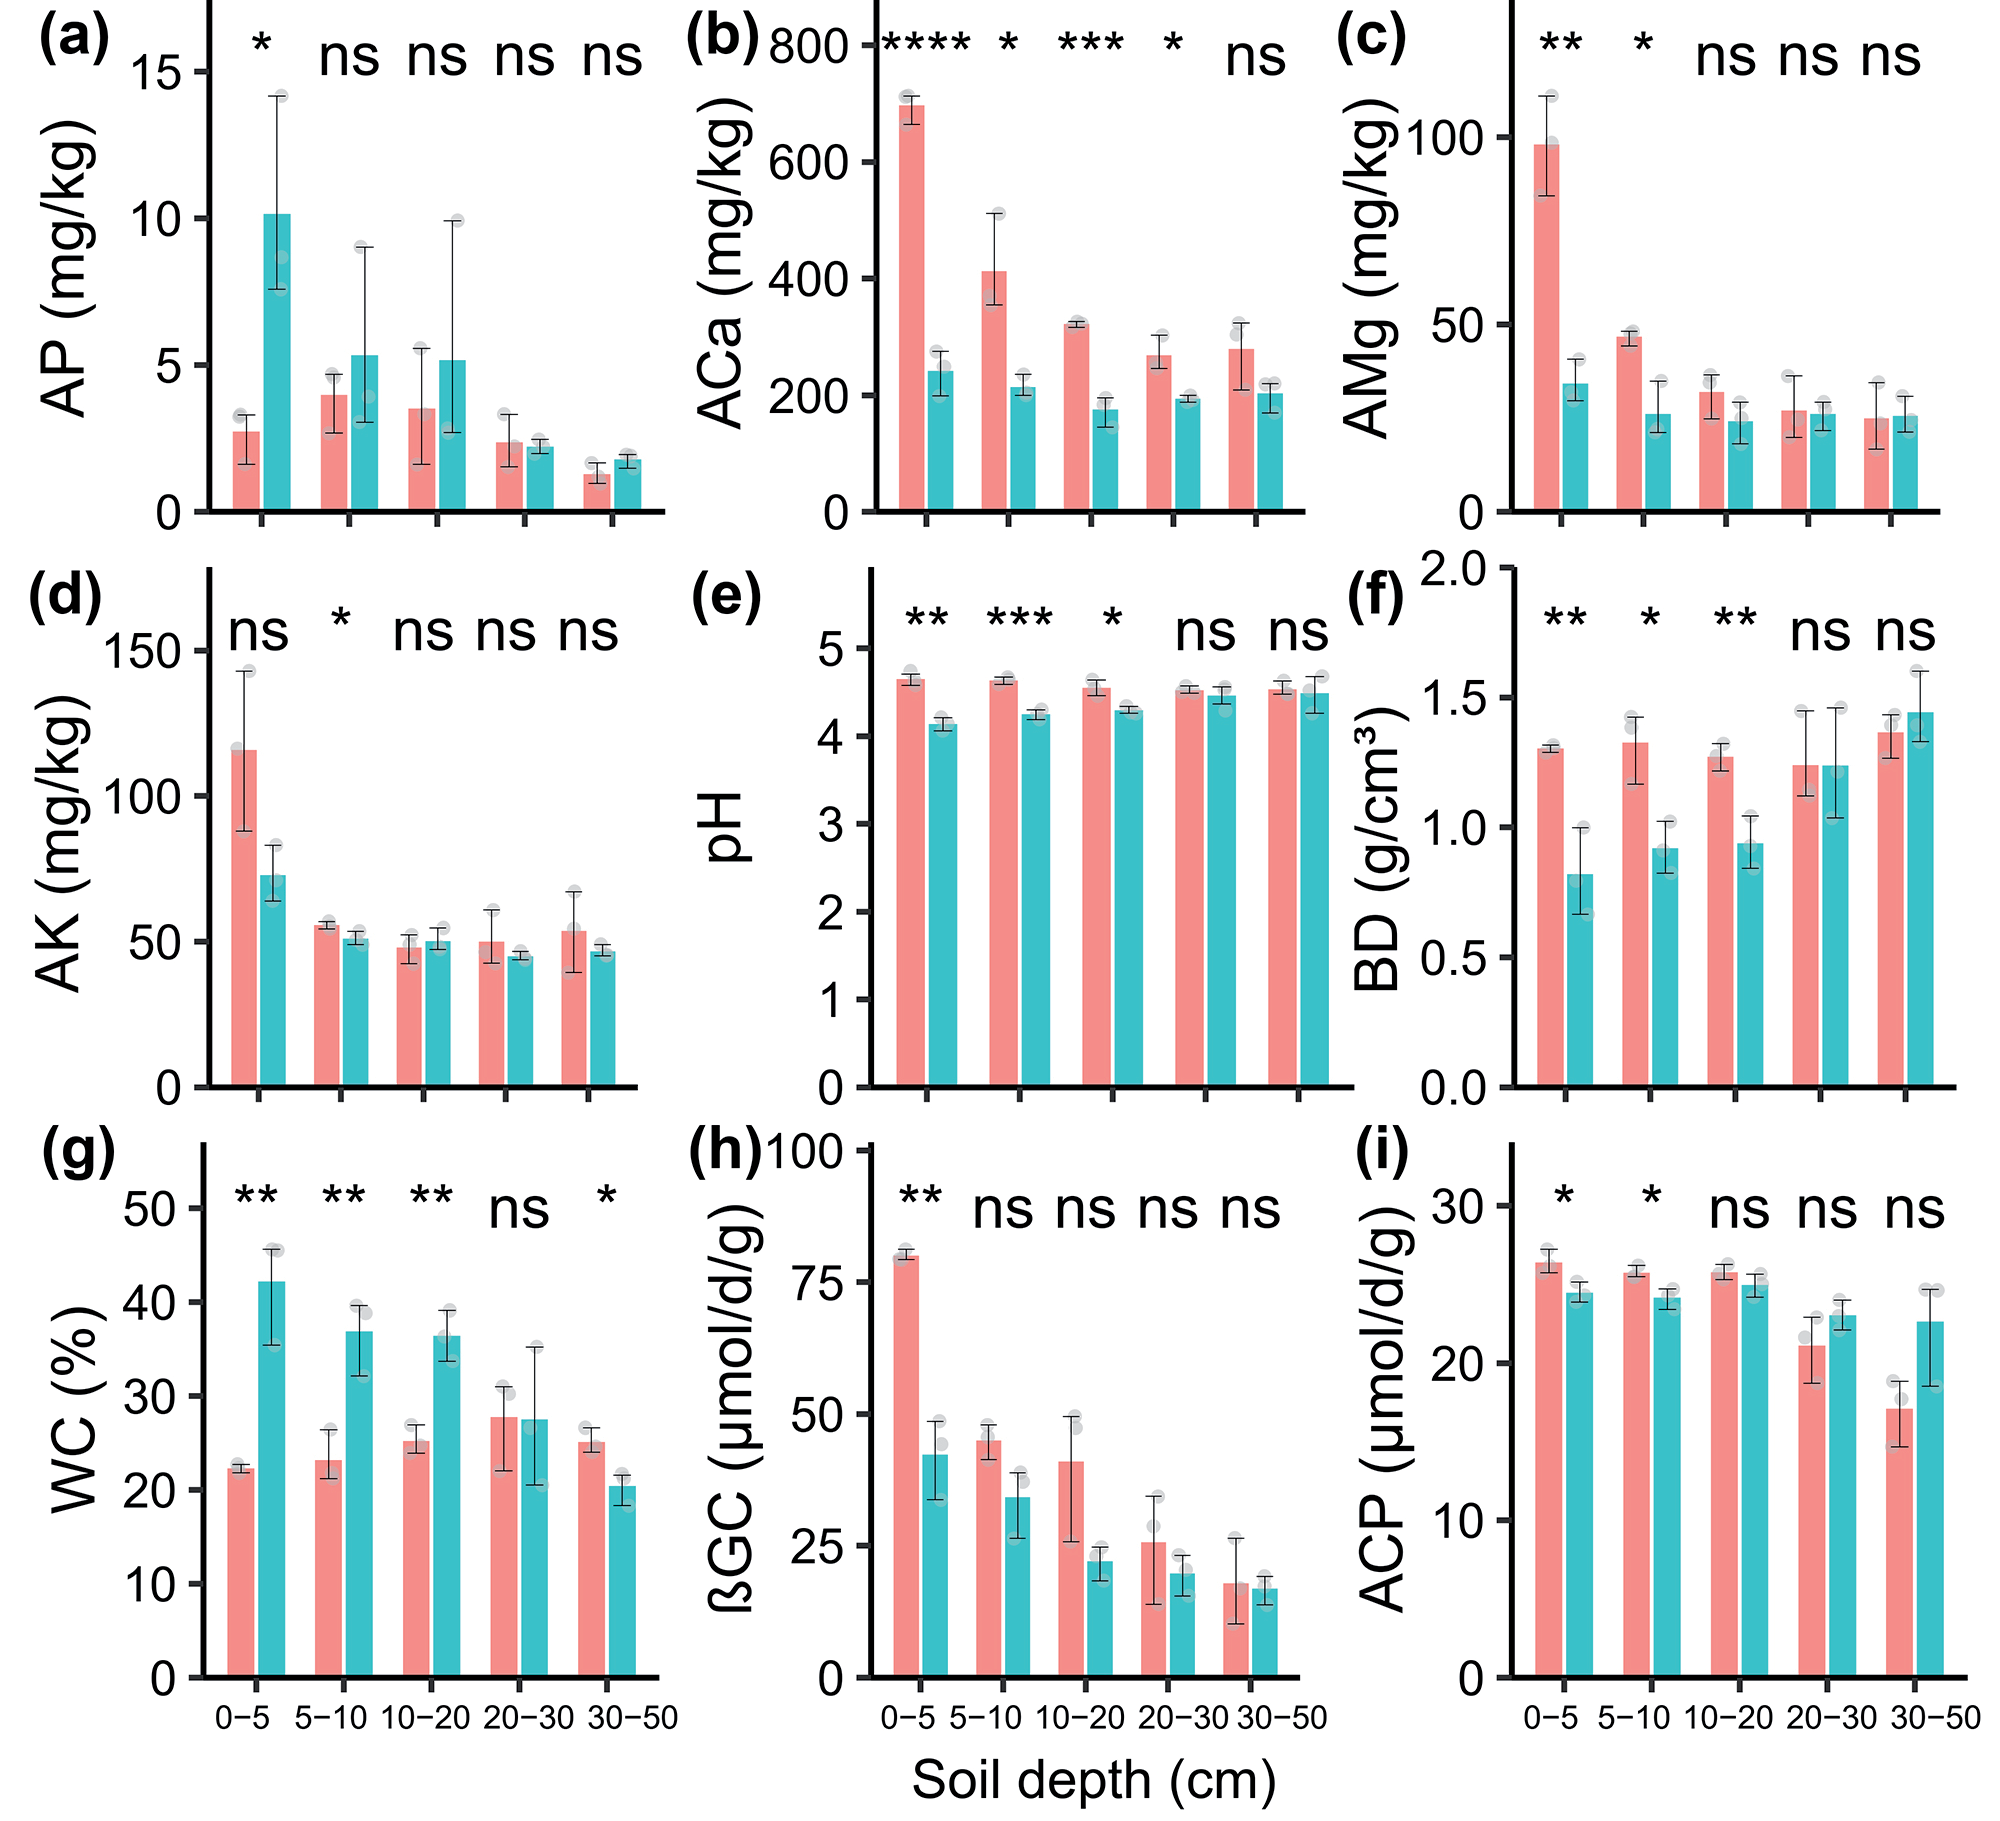
Fig. 2.
Soil chemical properties and enzyme activities, and chemical stoichiometry (that changed by grazing insignificantly) under grazing and no grazing. TC, total carbon content; TN, total nitrogen content; TP, Total phosphorus content; OC, organic carbon content; IC, inorganic carbon content; AN, available nitrogen content; LAP, Leucine aminopeptidase activity; NGA, N-acetyl glucose aminidase activity.
Grazing Alters the Physical Environment of the Soil
Grazing not only affected soil nutrients and stoichiometry, but also altered the physical environment of the soil [46]. Especially, grazing significantly increased the 0-5 (p = 0.0013), 5-10 (p = 0.0006), 10-20 (p = 0.0114) cm soil pH by 0.51, 0.37, 0.27 units, the 0-5 (p = 0.0077), 5-10 (p = 0.0147), 10-20 (p = 0.0071) cm soil BD by 59.03%, 44.14%, and 35.55%, the 30-50 cm soil WC by 22.88% (p = 0.0241). This was consistent with the previous findings that grazing increased soil pH [20, 53, 59] and bulk density [13, 23, 43, 45] but decreased soil water content [20]. However, these effects are only in the topsoil [23]. The buffalo squeezed the topsoil pores that include those pores that originally store water [16] through treading, which caused soil compaction [63, 64], elevated the bulk density [65], and increased resistance to penetration [23]. Furthermore, buffalo grazing decreased the vegetation cover [66] through eating and treading, enhanced soil temperature (Liu et al., 2021a), and evaporation of topsoil water [65]. All eventually depleted topsoil water content (Fig. 1). Surprisingly, the water content of deep soil (30-50 cm) in grazing was remarkably higher than that in non-grazing. This may be caused by the typical dual structure of surface and deep soil in this area. However, further verification is still needed.
Grazing Changes Soil Microbial Element Limitation
The group (grazing and non-grazing) and soil depth rather than the interaction significantly changed the vector length (p = 0.000197, 8.885e-05, and 0.619125), the group marginally changed the vector angle (p = 0.06451, 0.19606, 0.30958, Fig. 3). In details, the vector length declined with soil depth; however, the vector angle did not show a similar trend. Compared with the non-grazing, grazing remarkably increased the vector length of 0-5, 10-20 cm soils by 20.51% and 40.38% (p = 0.0078, 0.0209) also insignificantly reduced that of 5-10 cm soils by 16.68% (p = 0.0890). Grazing significantly increased the vector angle of 5-10 cm soils by 9.31% (p = 0.0390), whereas it did not significantly change that of 0-5 and 10-20 cm soils (p = 0.8880, 0.0950). Besides, grazing did not significantly change the vector length and angle of 20-30 and 30-50 cm soils (p>0.05). In short, grazing exacerbated microbial C limitation (Fig. 3), as indicated by increases in investment in C-acquiring enzyme activity (Fig. 1). However, this exacerbating effect was almost limited to the topsoil. This discovery was different from the results of chicken grazing, which showed that chicken grazing alleviated the soil microbial C limitation [67].
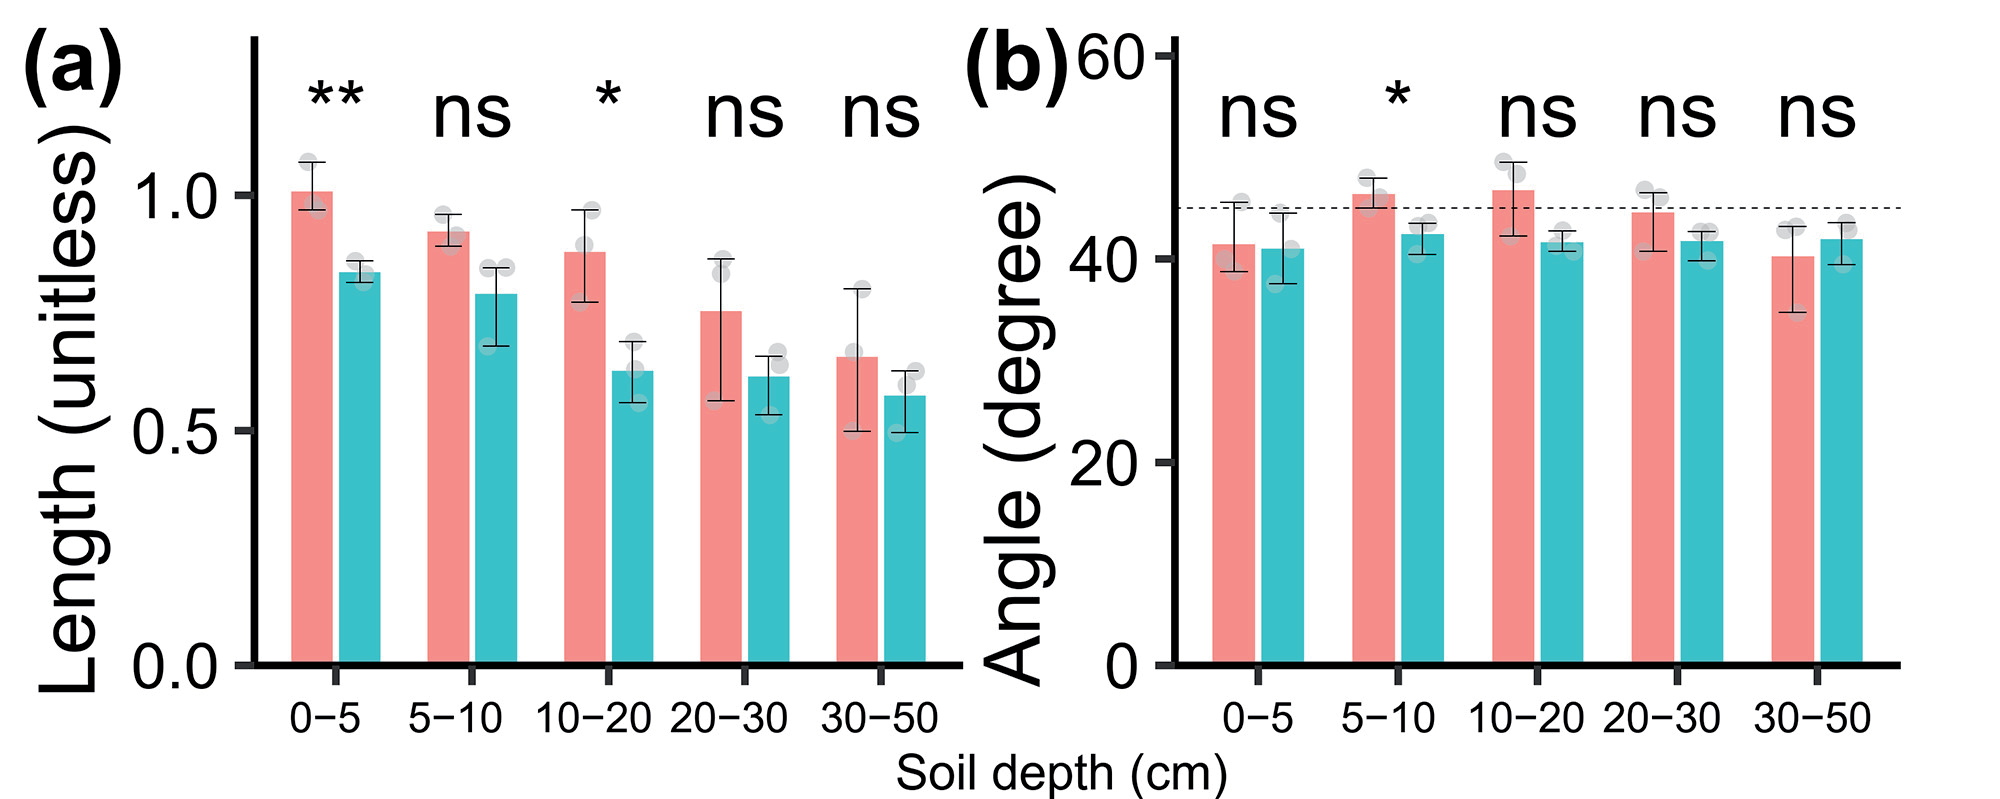
Fig. 4.
Random Forest analysis with 20-fold cross-validation identified the most crucial factors that significantly explained the variation of soil carbon-, nitrogen-, and phosphorus-acquiring ecto-enzyme activities, soil microbial C, and nutrient limitations. Available phosphorus content (AP), available potassium content (AK), available calcium content (ACa), available magnesium content (AMg), bulk density (BD), and water content (WC).
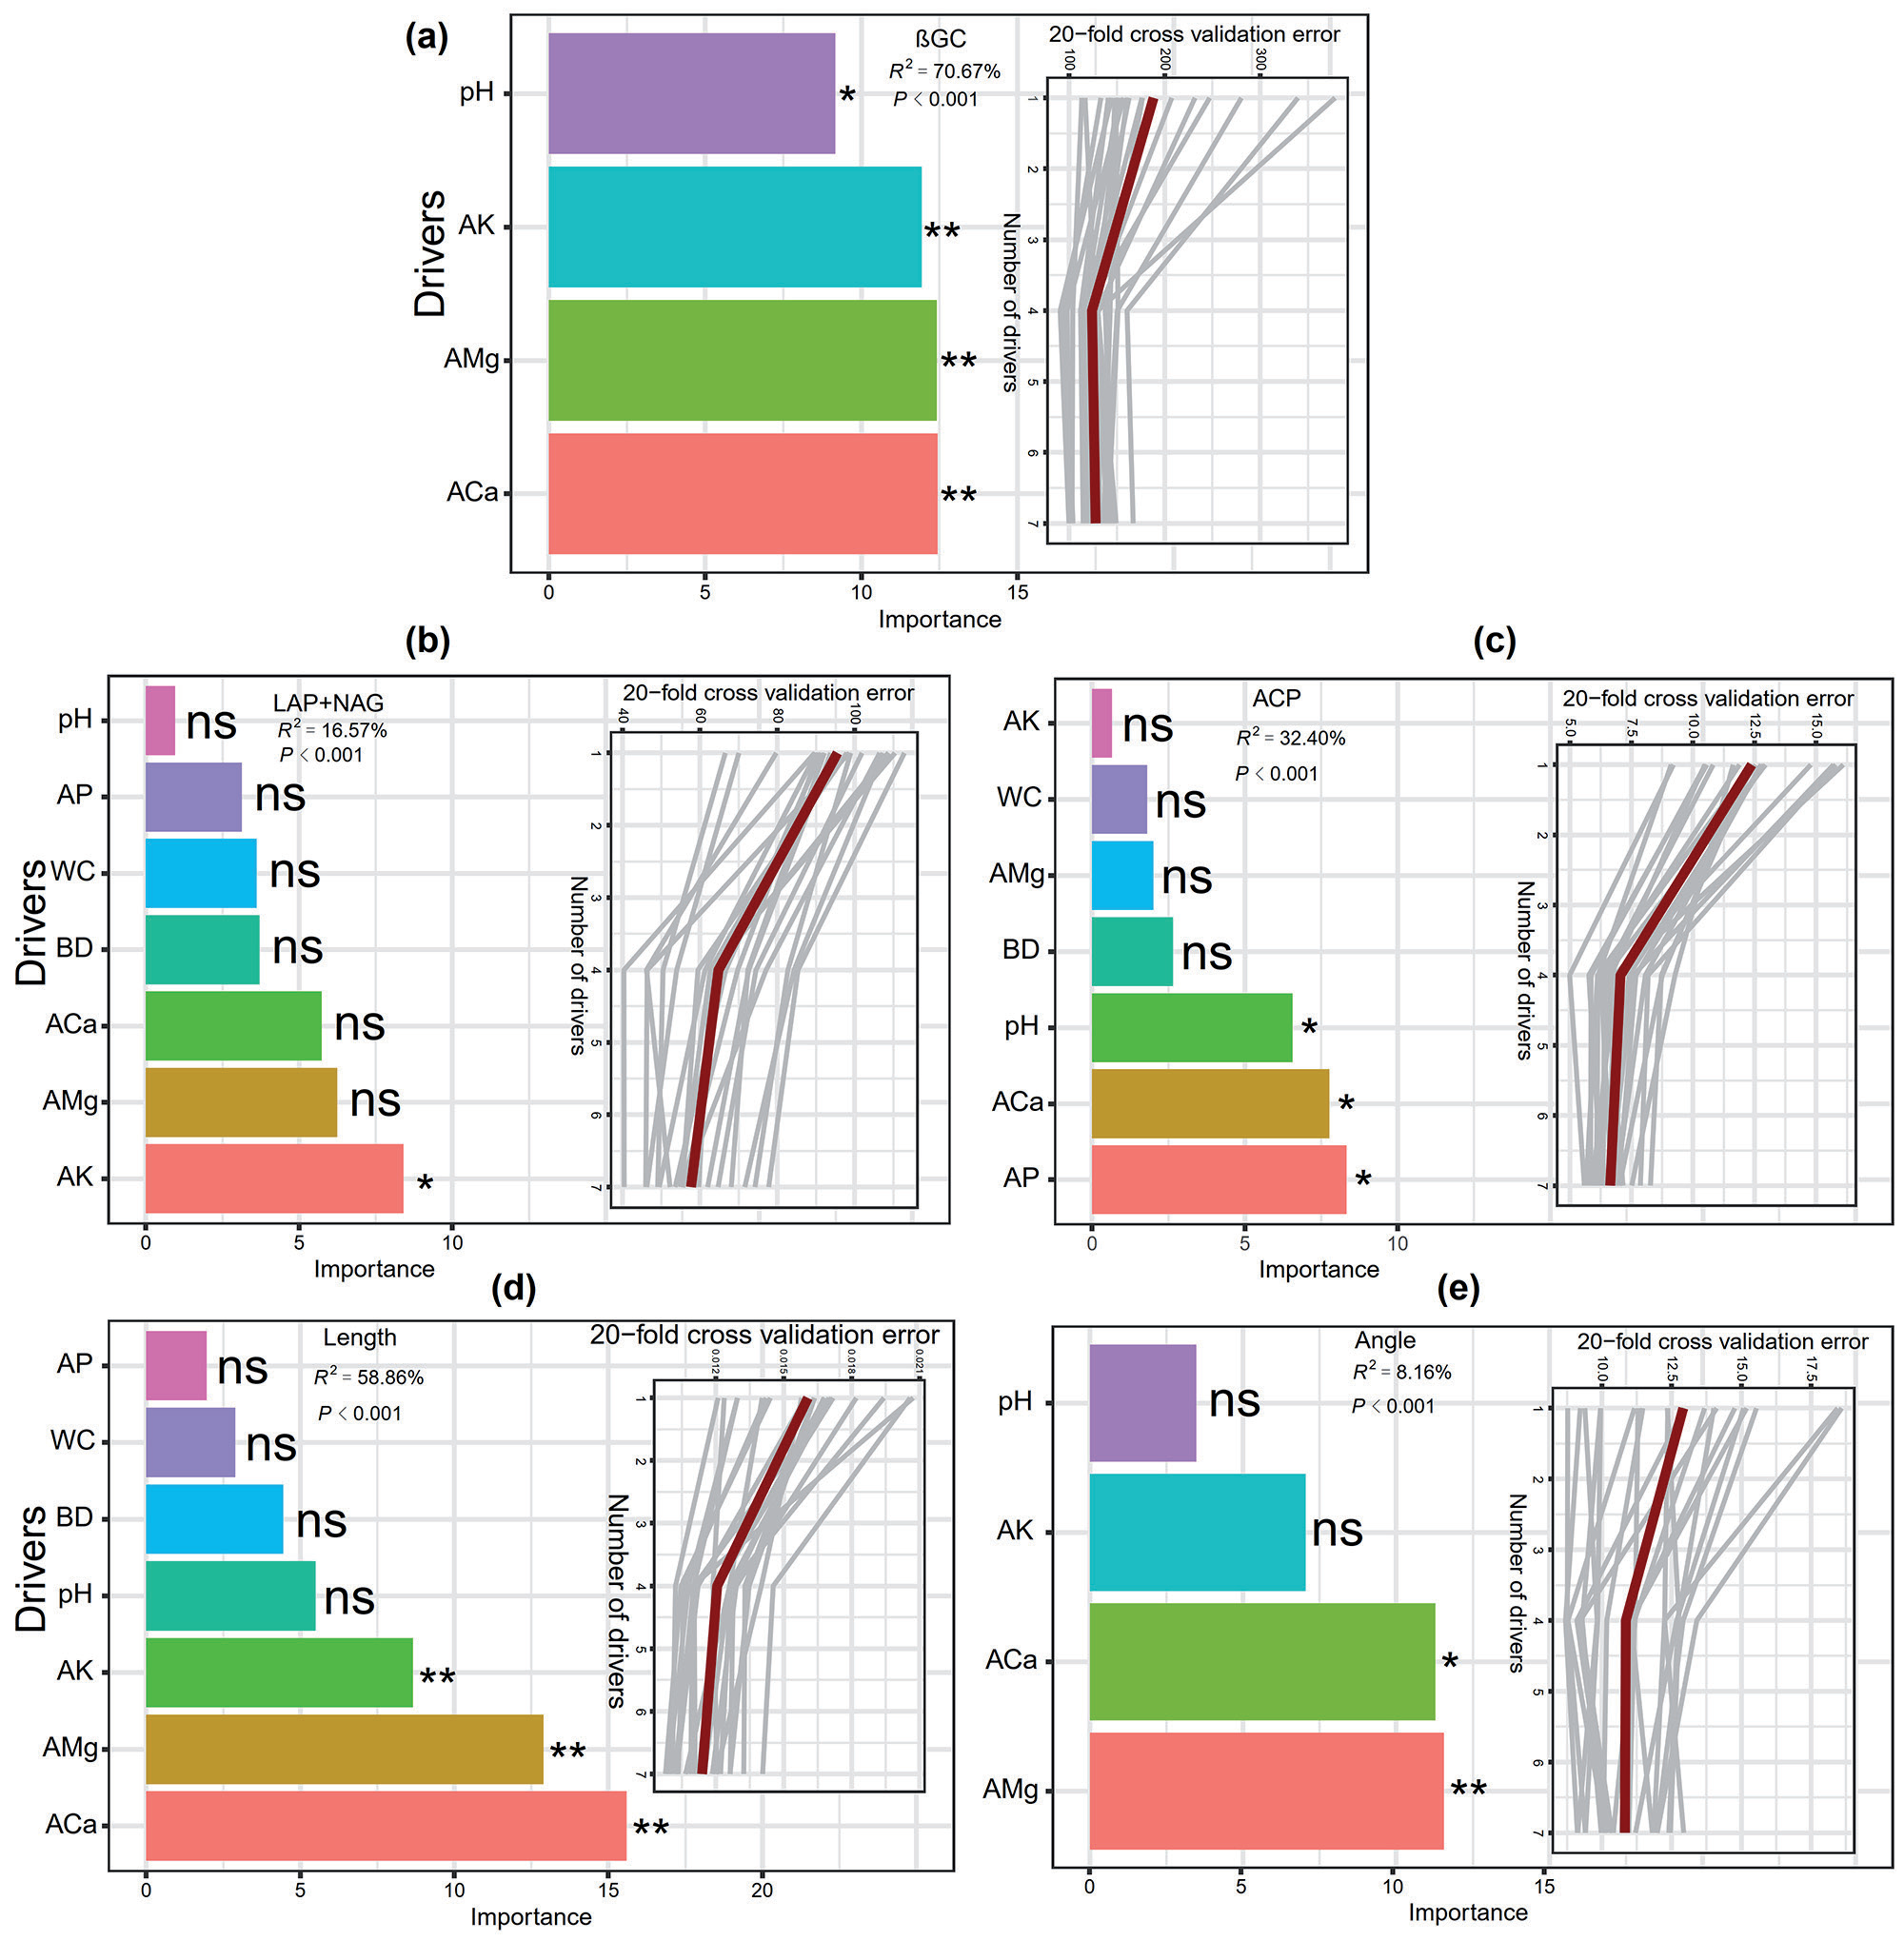
Two reasons can explain the phenomenon of grazing exacerbating soil microbial carbon limitation. On the one hand, grazing reduced plant biomass and coverage [61, 66] and reduced plant carbon [68]. On the other hand, both depletion in soil water content and increased bulk density (compaction) [61] negatively impact root biomass [43] and grass production and quality [69]. These usually reduce the availability of soil C [70] due to reduced C inputs from plants. A reduced organic input by removing aboveground biomass, decreased litter [31], and a lower root-derived organic input resulted in the soil microbial C limitation [71]. Besides, the vector angles of the 5-10 cm soils under no grazing were <45°, indicating soil microbial N limitation, whereas the vector angles of the 0-5 and 10-20 cm soils under grazing were >45°, indicating soil microbial P limitation [10] (Fig. 3). Therefore, grazing switched the soil microbiome from under N limitation to under P limitation. However, these effects only occurred at specific soil depths. Furthermore, the random forest analysis identified that available calcium (p = 0.0099), magnesium (p = 0.0099), and potassium (p = 0.0099) and pH (p = 0.0198) were the most crucial factors that significantly explained the variation of soil C-acquiring enzyme activity; available potassium (p = 0.0297) was the most crucial factor that significantly explained the variation of soil N-acquiring enzyme activities; available phosphorus (p = 0.0396) and calcium (p = 0.0198) and pH (p = 0.0396) were the most crucial factors that significantly explained the variation of soil P-acquiring enzyme activity. This result is different from the result from the study of grassland fencing, which suggested that extracellular enzyme activities were better explained by dissolved organic C and microbial biomass N than by plant or other soil properties [9].
The driving force of soil microbial element limitation has also been identified through the random forest analysis. Results showed that soil available calcium (p = 0.0099), magnesium (p = 0.0099), and potassium (p = 0.0099) were identified as the most crucial factors that significantly explained the variation of soil microbial C limitation. This was also different from a recent finding from sheep grazing studies, which suggested that soil organic carbon and total nitrogen significantly affect soil microbial carbon limitation [11]. Furthermore, soil available calcium (p = 0.0099) and magnesium (p = 0.0198) were identified as the most crucial factors that significantly explained the variation of soil microbial nutrient (nitrogen and phosphorus) limitation (Fig. 4). This is different from the findings from the livestock removal study, which suggest that pH significantly affects soil nitrogen and phosphorus limitation [72]. This indicated that we should give importance to soil cations in grassland management, and manipulation of soil cations may affect soil enzyme activity and soil microbial element limitation. To the best of our knowledge, this is the first study to investigate the effect of resource limitations on soil microorganisms under long-term buffalo grazing.
Conclusion
Grazing significantly changed the topsoil nutrient, stoichiometry physical environment, and C- and P-acquiring enzyme activities. Moreover, grazing exacerbated topsoil microbial C limitations and switched the soil microbiome from under N limitations to under P limitations. Specific soil-available cations were identified as the crucial factors that significantly explained the variation of soil ecto-enzyme activities and soil microbial element limitations. These results will be beneficial to the management of subtropical grassland and the understanding of how microbial element limitations alter in response to buffalo grazing.

