


Introduction
Achieving a balance between ensuring food security and addressing the challenges posed by the control of non-point source pollution is a pressing issue for the global community. In China, the excessive use of chemistry fertilizer (CF) has been a long-term soil health concern, highlighting the need for policies that simultaneously promote agricultural productivity and environmental sustainability [1].
This work is driven by several academic motivations. First, China’s intensive agricultural practices have impeded efforts to reduce CF use, leading to the long-term accumulation of fertilizer-related pollution with widespread negative consequences [2, 3]. Specifically, the excessive application of phosphate(P) and nitrogen(N) fertilizers poses significant threats to water quality, human health, and ecosystems [4,5]. Additionally, the overuse of CF contributes to greenhouse gas emissions (GHGs) [6], degrades soil health, potentially reduces long-term crop yields, and endangers food security [7, 8]. Second, the Chinese government has implemented a series of policy measures to address the issue of excessive CF use. In 2015, the Ministry of Agriculture and Rural Affairs introduced the “Action Plan for Zero Growth in Fertilizer Use by 2020.” This initiative provided a phased strategy to limit the annual growth rate of CF use to no more than 1% over the first five years, aiming for zero growth in fertilizer use for key crops by 2020 [9]. According to data from China’s National Bureau of Statistics (NBS), CF use increased significantly [10], from 44.12 million tons in 2003 to 52.51 million tons in 2020. This rise in fertilizer use corresponds with a substantial increase in crop yields, which grew from 430.695 billion tons in 2003 to 669.492 billion tons in 2020 [11, 12]. The evidence emphasizes the substantial impact of CF use on food security in China [13]. The complex topography and fragmented arable land in the Southwest region present significant challenges for managing non-point source pollution and ensuring food security [14].
This study integrates diverse, established, and trustworthy models from previous studies into a Dual-Objective evaluation framework, which investigates CF-driven non-source pollution and fosters sustainable agricultural practices. The models within the framework include the Fertilizer Pollution Risk Index Model, Kernel Density Estimation, GM (1,1) model, EKC-based Tapio Decoupling Model, and the The Logarithmic Mean Divisia Index (LMDI). Thanks Index Decomposition Model. These models collectively evaluate the critical impacts of CF use, namely, CF-driven pollution risk, reduction effects, decoupling relationship, and driving factors.
First, identifying the risks associated with CF-driven pollution is critical to understanding the broader implications of CF use on both food security and environmental health. Existing methods for evaluating fertilizer pollution risk can be broadly categorized into two approaches, namely, Models-based predictions (MBP) and indicators-based methods (IBM), respectively. MBP rely on mathematical simulations to forecast the migration, transformation, and accumulation of CF in the environment. For instance, Wang et al. [15] utilized the SWAT model to predict soil carbon emissions, while Barberena et al. [16] employed the AnnAGNPS model to evaluate non-point source pollution in the agricultural sector. IBM focus on multiple indicators to assess CF-induced environmental risks. For example, Zhao et al. [17] developed comprehensive indicators to evaluate the annual CF application risks of phosphate (P) fertilizers, and Liu et al. [18] examined nitrogen fertilizer risk using the approach. The flexibility of IBM allows for the adjustment of indicators to exhibit goodness to fit in the ecological contexts of different regions, enabling more precise assessments. Motivated by Cai et al. [19], this study adopts the CF application risk index model and evaluates the risk of CF-driven non-point source pollution in the Southwest region of China.
Second, the effectiveness of the zero-growth policy on CF use in slowing the rise of CF-driven pollution should be thoroughly investigated, making it essential to evaluate the specific reduction outcomes [20]. In this context, the GM (1,1) model is a commonly employed simulation method [21]. This model is particularly well-suited for predicting agricultural nonpoint source pollution emissions using small sample sizes and has often been shown to outperform other models [22-24].
Third, after evaluating the reduction impacts, it is essential to quantify the decoupling effects between the control of CF-driven non-point source pollution and agricultural output [25-28]. Decoupling models provide a useful framework for understanding the relationship between CF-driven pollution and agricultural productivity [29, 30]. For instance, Jin et al. have applied the theory to analyze the decoupling of CF-related pollution from agricultural output [31].
Finally, A comprehensive understanding of the mechanisms driving CF-driven pollution in Southwest China is essential for the effective design and implementation of policies. LMDI method is particularly useful due to its reliability in providing a detailed, comparable, and recursive analysis [32, 33]. By applying LMDI, this study aims to identify the key drivers of CF-driven pollution in Southwest China [34, 35], focusing on key areas where reductions in CF applications can be effectively achieved [36].
Compared to existing methods for evaluating CF-driven pollution, the study offers several key advantages: (1) Enhanced comprehensiveness. Unlike conventional approaches, this framework incorporates dual objectives and a broader set of indicators, providing a more comprehensive assessment, from CF-driven pollution to socioeconomic impacts.
(2) Synergistic effects. The integration of diverse models allows for a multi-dimensional investigation, overcoming the limitations associated with using individual models. The complementary feature of models ensures that this framework provides more accurate, reliable, and robust analysis. (3) Decision-making insights support. This framework offers valuable insights for policymakers. It guides decision-making from assessing CF-induced pollution risks to reduction effects, evaluating decoupling effects, and identifying driving factors. Thus, it can provide targeted recommendations for managing CF use, enhancing green development in the agricultural sector, and developing effective sustainable policies.
Several questions have been formulated to understand the complex relationship between CF use and agricultural practices in Southwest China in light of current agricultural and environmental challenges. The specific questions addressed by this research are:
(1) Has the implementation of the zero-growth policy of CF use led to a reduction in CF application rates?
(2) If the zero-growth policy does lead to decreased CF application rates, how does the zero-growth policy of CF use impact crop yields in this region? (4) In what ways can strategies to mitigate non-point source pollution be balanced with the need to ensure food security in China?
(5) What type of dual-objective assessment framework can be developed to effectively evaluate both fertilizer reduction and sustainable agricultural production practices?
By addressing these questions and developing a structured conceptual framework, this work aims to make the following contributions to the field:
Firstly, despite significant progress in research on CF-driven pollution, there is a notable lack of comprehensive evaluations of China’s CF-driven non-point source pollution in the existing literature. This paper addresses this gap by establishing a dual-objective assessment framework to assess CF-driven pollution risks, the impacts of reduction measures, and decoupling effects. Secondly, this work offers a solid theoretical basis for future initiatives aimed at implementing zero-growth policies for CF use in China. Given the unique geography and fragmented arable land in Southwest China, managing CF-driven non-point source pollution poses substantial challenges in these provinces, making this work of considerable practical importance. Lastly, the research findings and policy implications address not only CF application reduction and food security but are also adaptable to other regions facing similar challenges.
The remaining sections are organized as follows: Section 2 introduces the materials and methods used in this study. Section 3 presents the results and discussion. Finally, Section 4 provides the conclusions, implications, and limitations of this research.
Materials and Method
Study Area
This study focuses on Southwest China, which includes four provincial-level administrative regions: Sichuan, Yunnan, Guizhou, and Chongqing. (see Fig.1). This region is a key grain-producing region in China. Due to its mountainous terrain, intensive agricultural practices, which emphasize meticulous cultivation techniques, result in high CF use in farming [37]. However, the region’s ecological environment is relatively fragile, and excessive CF application has led to surpassing ecological carrying capacity [38]. The diverse topography, geomorphology, and climate of Southwest China provide a unique setting for this research [39], allowing for a comprehensive analysis of the relationship between CF use and agricultural production, as well as their decoupling effects.
Methods
Fig. 1 outlines the dual-objective framework for analyzing fertilizer pollution and food security in Southwest China, consisting of four main components. First, the Non-Point Source Fertilizer Pollution Risk Assessment uses the Fertilizer Pollution Risk Index Model and ArcGIS maps to assess pollution risks in Yunnan, Sichuan, Guizhou, and Chongqing. KDE analyzes the spatiotemporal trends of fertilizer pollution. Second, the Evaluation of Reduction Effects Under the Zero-Growth Fertilizer Initiative compares estimated fertilizer use without the policy to actual usage to assess its effectiveness. The third component of this study’s decoupling effect analysis is the EKC and decoupling models, which explore the relationship between fertilizer pollution and agricultural output. The fourth component applies the LMDI model to identify factors driving fertilizer pollution. Data for these analyses are sourced from China’s National Bureau of Statistics.
Fertilizer Pollution Risk Index Model
This study adopts the model proposed by Guo et al. [40] to calculate the non-point source pollution risk index for CF application. The detailed calculation formulas are presented in Equations (1) and (2):
Table 1 presents the parameters used in the equations described above. In accordance with the standards established by China’s Ministry of Ecology and Environment, the environmental safety thresholds (Ti) for nitrogen, phosphorus, and potassium fertilizers are set at 125 kg/hm², 62.5 kg/hm², and 62.5 kg/hm², respectively. The risk weight coefficients (Wi) for nitrogen, phosphorus, and potassium fertilizer pollution are assigned values of 0.60, 0.21, and 0.19, respectively. This formula suggests that assuming the ecological safety thresholds for CF application and utilization efficiency remain constant, the risk associated with CF use is directly proportional to the intensity of CF application.
Fig. 1.
Research framework. Notes: The source of this map is from the standard map service system of the Ministry of Natural Resources (http://bzdt.ch.mnr.gov.cn/ index.html), with the reference number GS (2019) 1697.
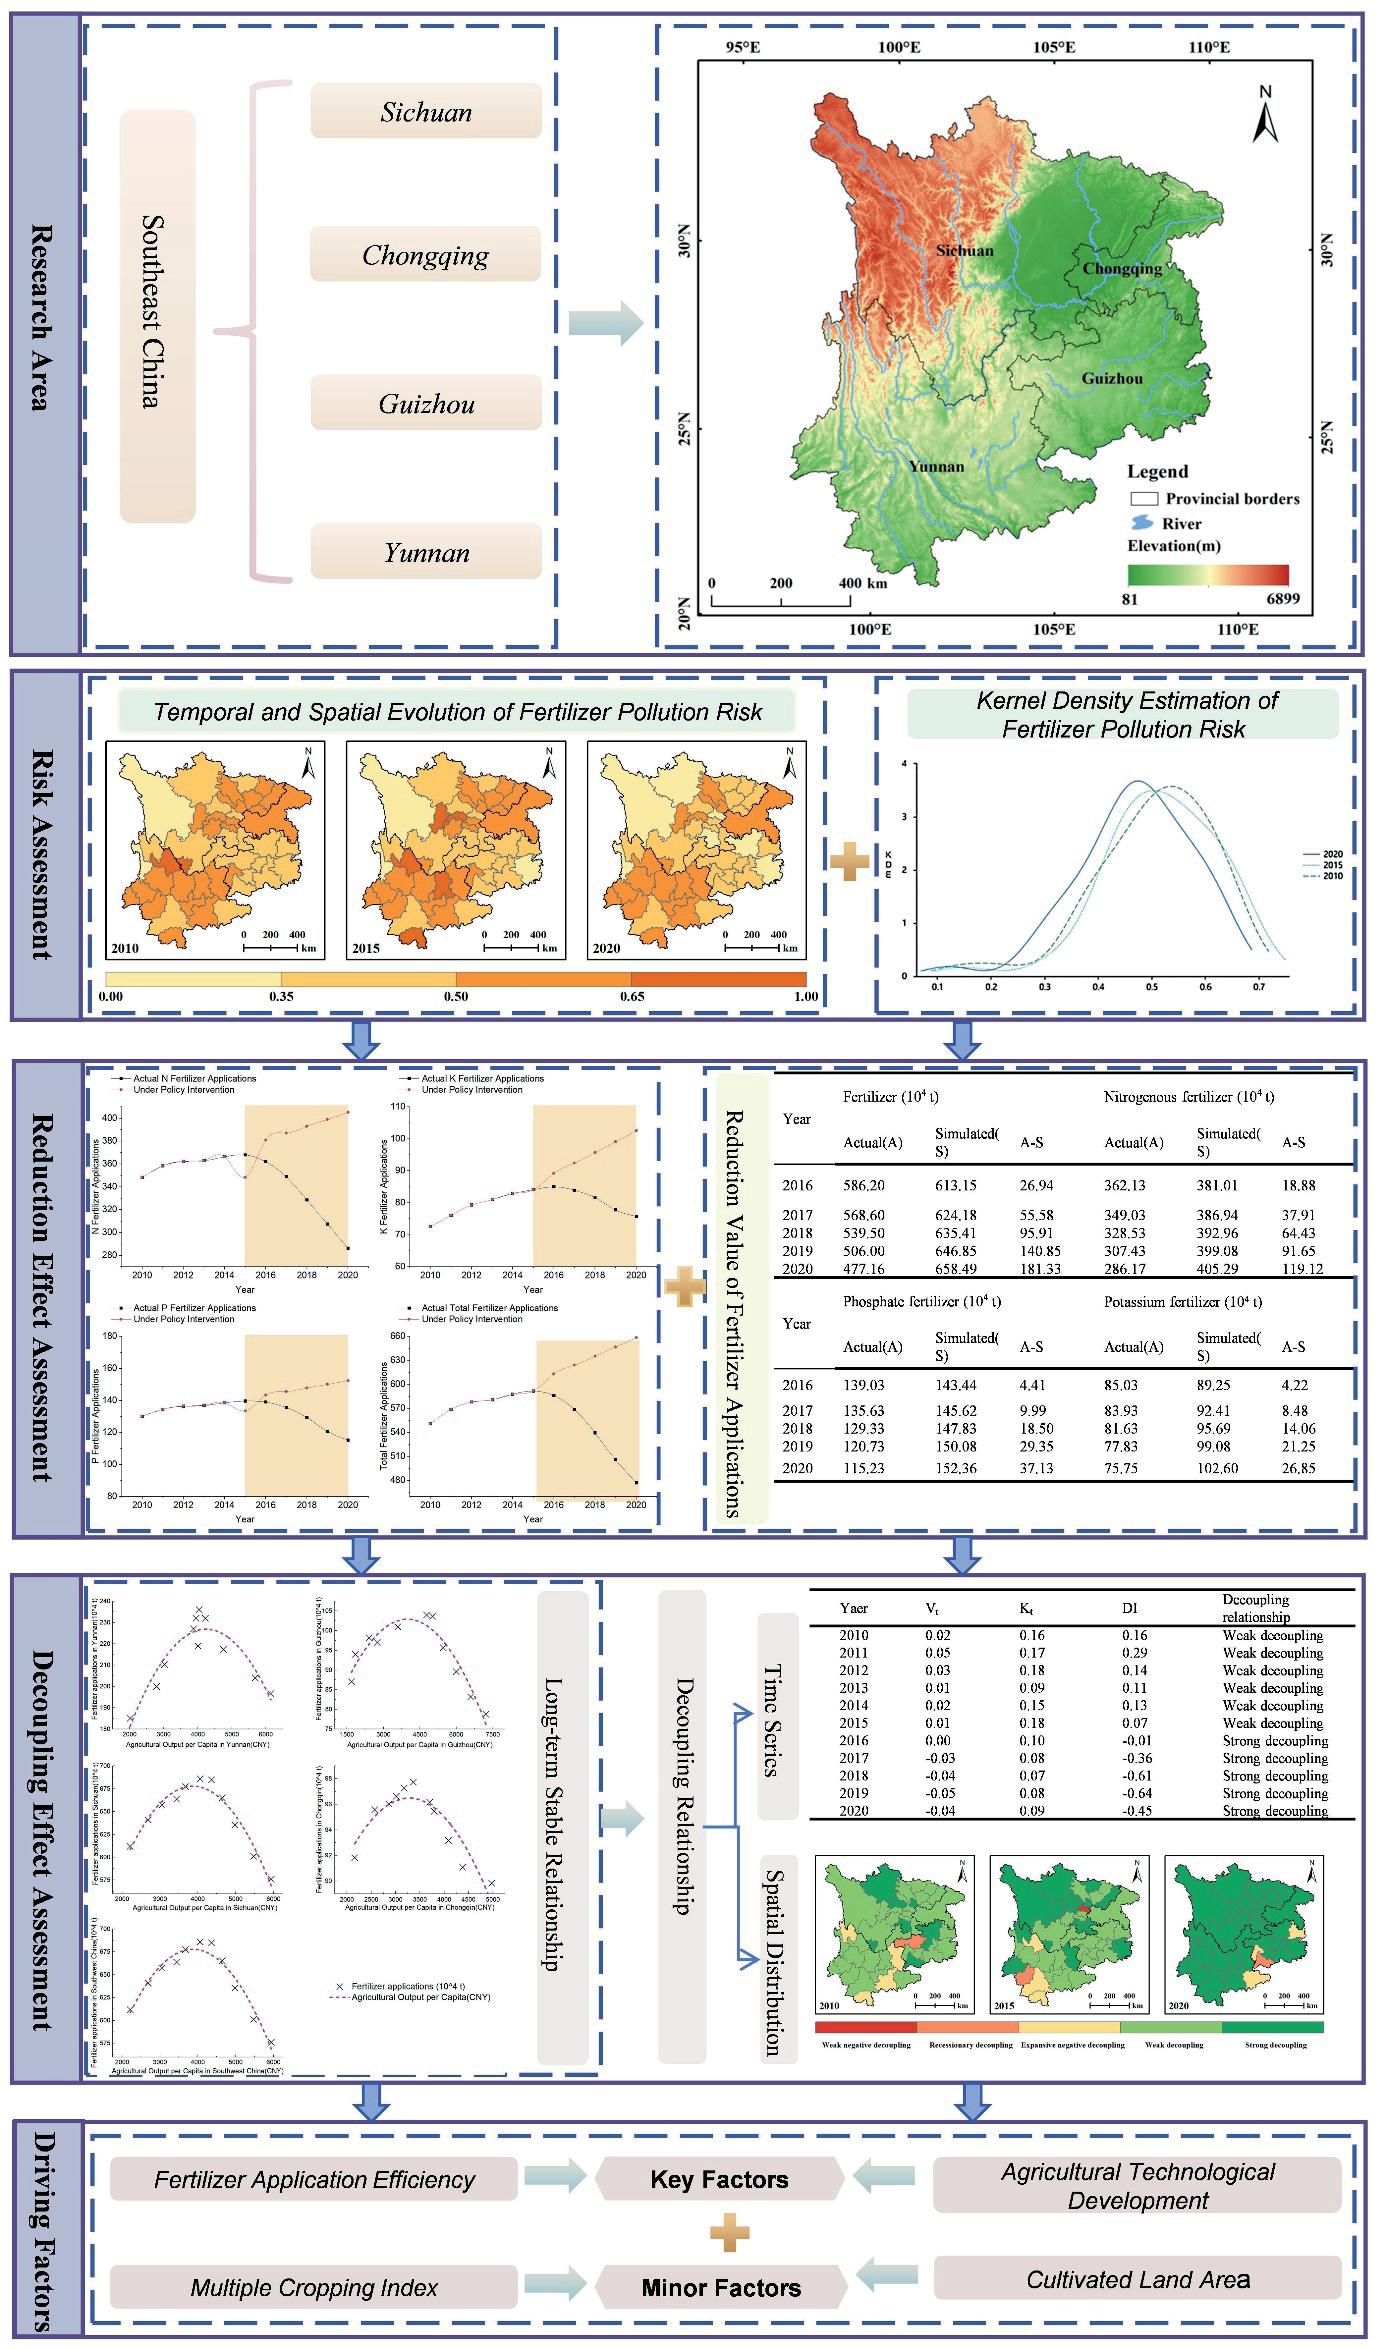
Table 1.
Symbols and descriptions.
Motivated by Yang et al. [41], this study categorizes the non-point source fertilizer-driven pollution risk index into four distinct risk levels. The safety type of risk corresponds to a risk index range of 0-0.35, indicating that the ecosystem structure is stable and can withstand fertilizer pollution risk. The low-risk type has a range of 0.36-0.5, with the ecosystem structure being largely intact and possessing partial resistance to such risk. The medium-risk type, ranging from 0.51-0.65, implies that the ecosystem structure has been damaged as the fertilizer pollution risk exceeds the ecosystem’s resilience. For the serious-risk type, within the range of 0.66-1.00, the ecosystem structure is severely damaged, and the fertilizer pollution risk leads to significant harm to the ecosystem.
Kernel Density Estimation and GM (1,1)
This study employs the KDE method to examine trends in regional disparities of CF-driven pollution risk across Southwest China. KDE is used to estimate the probability density of random variables, providing a detailed description of the distribution patterns through density function curves. Assuming the density function of the random variable x is denoted by F(x), the Kernel density function estimator is expressed in Equation (3) [42]:
Subsequently, a grey prediction model is applied to estimate total CF application and its subcategories – nitrogen, phosphorus, and potassium fertilizers – under a scenario without the zero-growth of CF policy. Utilizing the grey prediction model’s high accuracy for small-sample forecasting [43], fertilizer application data from the pre-policy period (2000-2014) to the post-policy period (2015-2020). This provides essential data support for analyzing the reduction and decoupling effects. The fundamental formula for the grey model is given in Equation (4):
Where a represents the development coefficient, and b denotes the grey action quantity.
Liu et al. [44] use the approach, the following Equation (5) is given by:
To verify the accuracy of the GM (1,1) model, a posterior error test is required. The GM (1,1) Model accuracy level is classified as follows: Unqualified when the variance ratio is greater than 0.65 and the probability of residual error is less than 0.70; basically qualified when the variance ratio is less than 0.65 and the probability is greater than 0.70; qualified when the variance ratio is less than 0.50 and the probability is greater than 0.80; and excellent when the variance ratio is greater than 0.35 and the probability is greater than 0.95.
EKC-based Tapio Decoupling Model
The EKC hypothesis has been widely utilized to investigate the nexus between agricultural non-point source pollution and economic growth [45]. This work specifically focuses on CF applications and employs per capita agricultural output value as the proxy for agricultural economic growth. The constructed models integrate a cubic term into the conventional EKC hypothesis to test the cubic function’s fit. If the cubic function’s fit is not satisfied, the cubic term will be omitted, and a subsequent test for a quadratic function test will be conducted [46]. The simplified EKC model is given in Equations (6) and (7).
Where F represents the amount of fertilizer applied (in ten thousand tons), G represents the per capita agricultural output (in CNY), and t represents the year. βi is the coefficient to be estimated, which determines the shape of the environmental Kuznets curve. ε represents the random error term.
Afterward, utilizing the foundational decoupling theory, a decoupling model was constructed to explore the relationship between CF-driven agricultural nonpoint source pollution and crop yields. The calculation formula is presented below as follows (8):
Where DI is the decoupling coefficient, and Et represents the non-point source CF-driven pollution applications. Gt denotes the total agricultural output. Vt and Kt represent the growth rates of non-point source CF applications and total agricultural output value, respectively [47]. The decoupling judgment criteria for decoupling status are presented in Table 2.
LDMI Index Decomposition Model
The study employed LMDI to investigate dynamic driving factors in CF application. LMDI models were constructed for both the Southwest region as a collective group and for each of the four provinces. The specific formulas are presented in Equations (9) and (10):
The symbols utilized in the equations are explained in Table 1. For any given province, the CF application is affected by four primary factors: fertilizer application efficiency, the development of agricultural technology, the multiple cropping index, and the size of cultivated land [48]. The change in CF application for a county i over a specified period can be decomposed as shown in Equation (11). The annual impact of each driving factor was quantified and presented in Equations (12) to (15):
Results and Discussion
Spatiotemporal Evolution Analysis
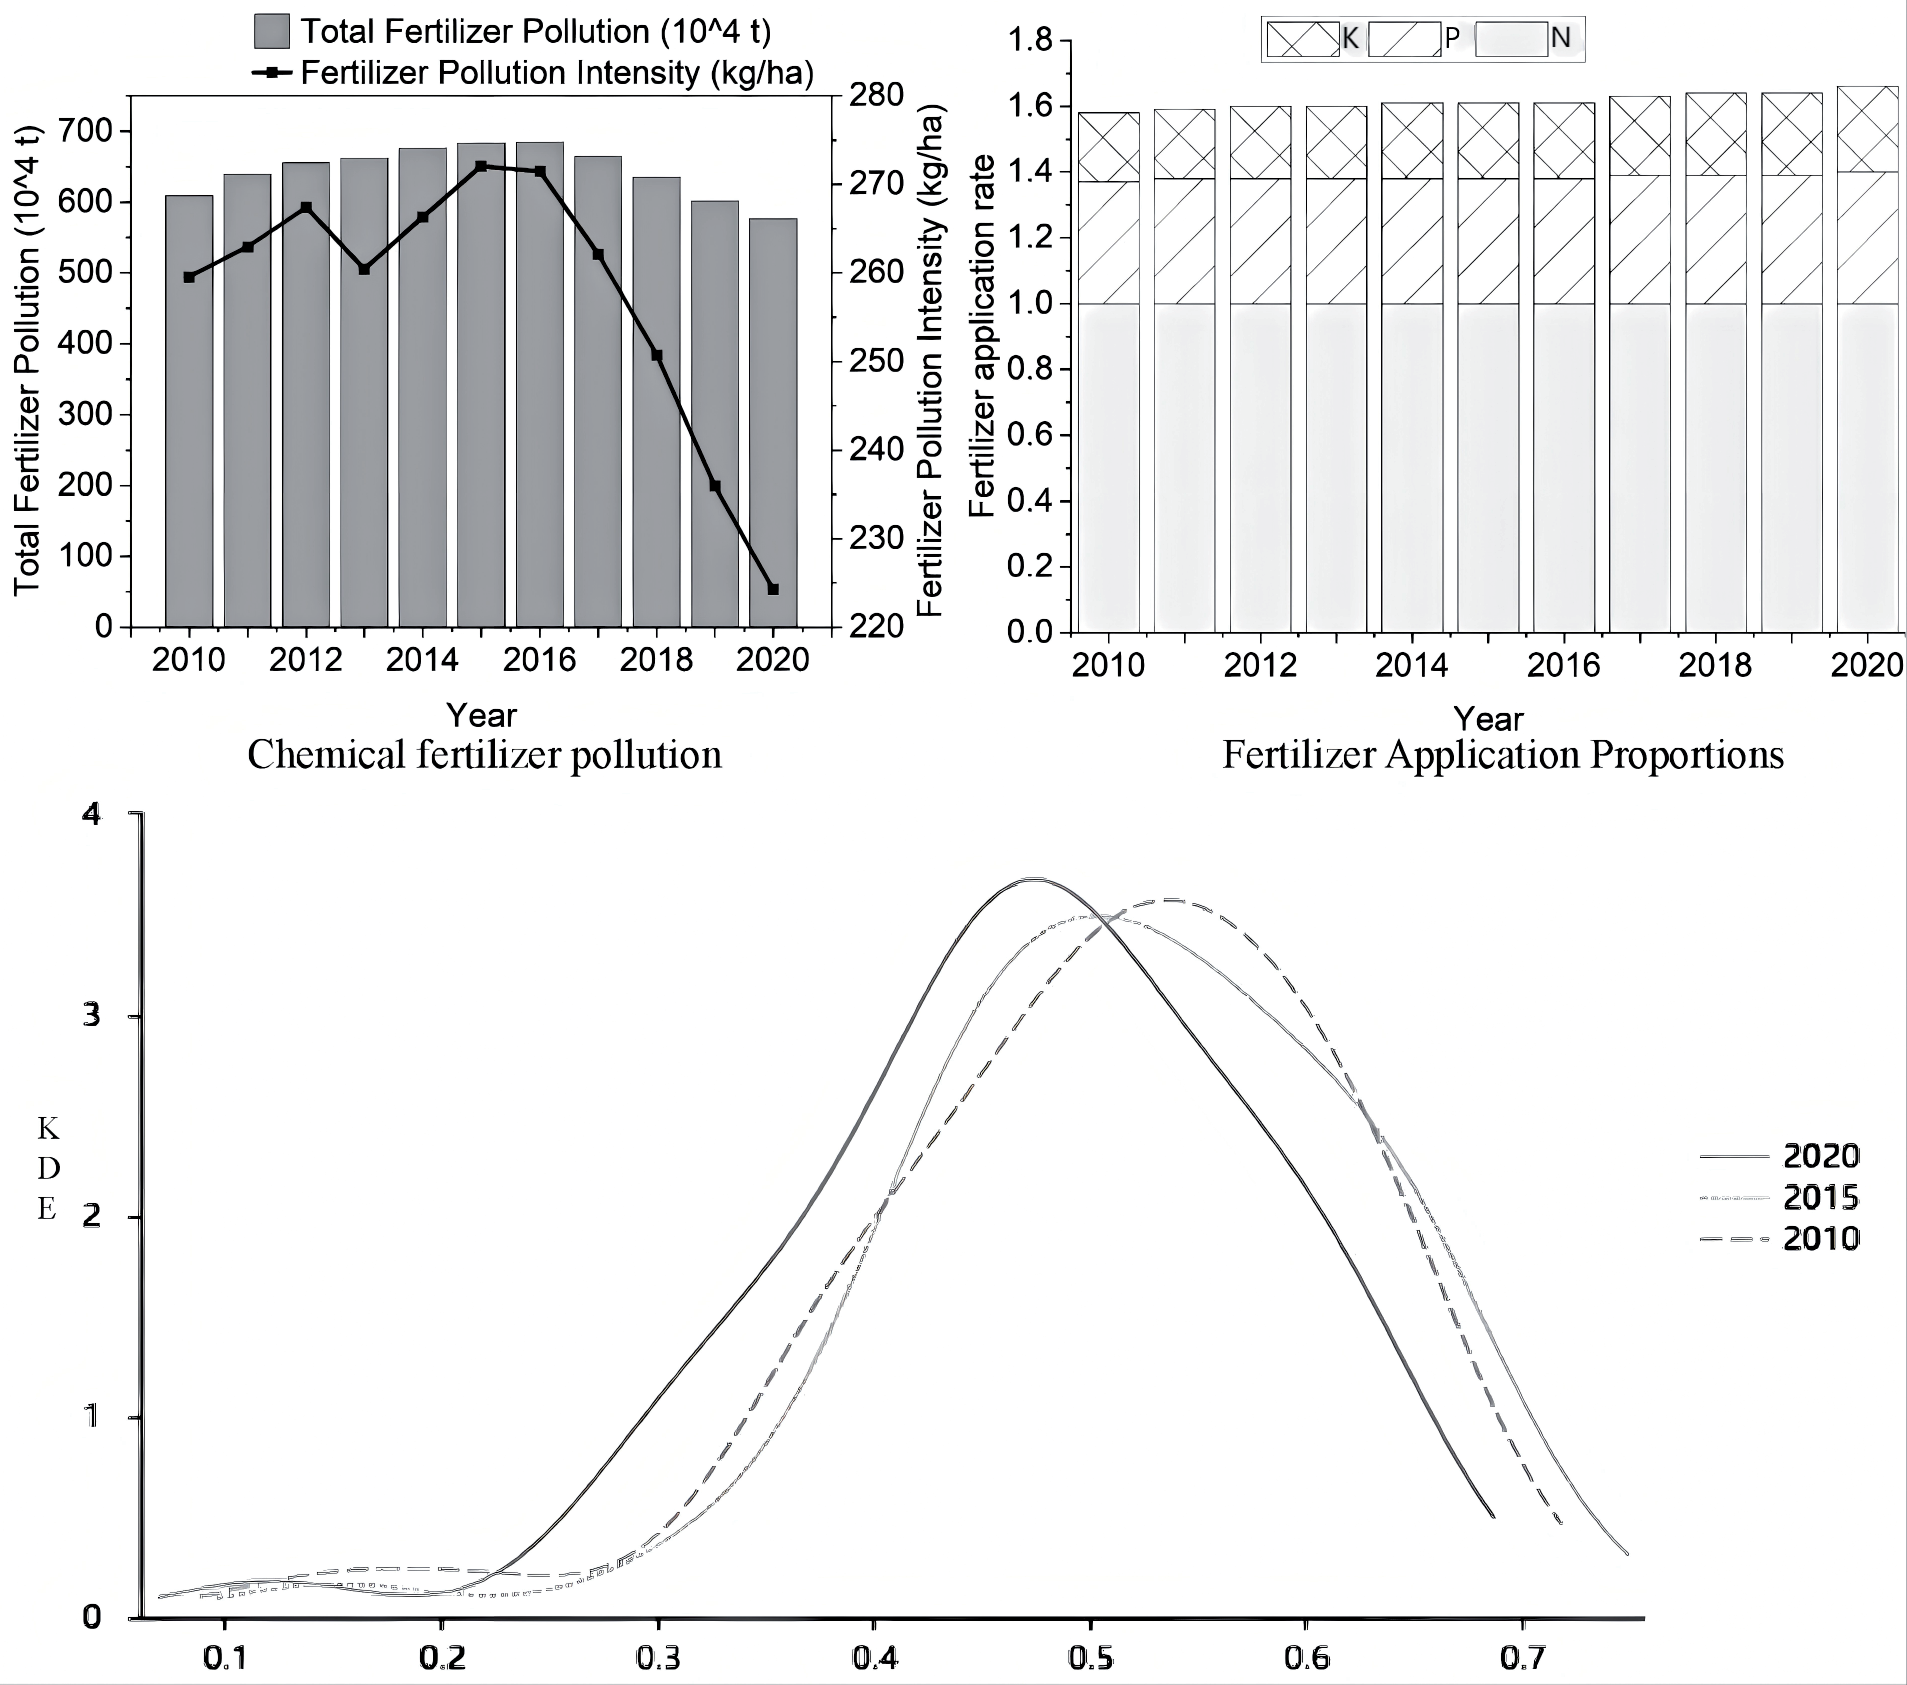
The CF applications and intensity of fertilizer pollutants in Southwest China from 2010 to 2020 exhibited a trend of initial growth, peaking, and subsequent decline (see Fig. 2). Total CF applications increased from 6.0854 million tons in 2010 to a peak of 6.8440 million tons in 2016, before gradually decreasing to 5.7611 million tons by 2020. From 2010 to 2015, the average annual growth rate of total CF applications was 2.44%. However, the trend was followed by an average annual decrease of 3.14%. This trend reflects an early phase of rising CF use, mainly driven by rising crop yields, followed by a phase of reduction attributed to CF-related policy interventions and technological advancements.
Table 2.
Decoupling judgment criteria for decoupling status.
Specifically, in 2010, the fertilizer pollution intensity in Southwest China was estimated at 259.59 kg/ha. Over the next decade, the intensity fluctuated, peaking at 272.04 kg/ha in 2015 before gradually falling to 224.28 kg/ha by 2020. This pattern suggests that, in pre-2015, the growing CF use placed significant ecological pressure on the region’s arable land, confirming the importance of the Action Plan for Zero Growth in Fertilizer Use. Moreover, during the study period, the application ratios of nitrogen, phosphorus, and potassium fertilizers remained relatively stable, although there was a noticeable trend towards gradual adjustments (see Fig. 2). This finding reveals that Southwest China focused on optimizing its CF use by stabilizing nitrogen application, adjusting phosphorus levels, and increasing potassium use. Taking nitrogen fertilizer as a baseline (normalized to 1), the CF application ratios shifted from 1:0.38:0.24 in 2015 to 1:0.40:0.26 in 2020. This adjustment is not only consistent with the goals of regulating phosphorus and potassium utilization but also displays the improvements in CF use efficiency.
Overall, from 2010 to 2020, CF application in Southwest China exhibited a trend of initial increase followed by a decrease, both in total quantity and intensity. The structure of CF use was gradually optimized. These changes have contributed to reducing the ecological footprint in the agricultural sector and achieving the national goal of zero growth in CF use.
Spatiotemporal Dynamics of Chemical Fertilizer Pollution Risk
The environmental risk associated with fertilizer application in Southwest China was assessed using an environmental risk index evaluation model. This study utilized ArcGIS to create spatial distribution maps illustrating fertilizer risk at the city level for the years 2010, 2015, and 2020. The risk levels were categorized as safe, low risk, medium risk, and high risk (Fig. 3). The distribution of fertilizer pollution risks in Southwest China shows spatial and temporal patterns, as detailed below by comparing the 2010,2015 and 2020 results:
Fig. 2.
Chemical fertilizer pollution, fertilizer application proportions, and Kernel Density Estimation.
(1) As shown in Fig. 3, in 2010, 21 cities were categorized as medium risk, mainly concentrated in Yunnan, northeastern Sichuan, and Chongqing. Panzhihua City, located at the border of Yunnan and Sichuan, was the only area classified as a high-level risk city. Moreover, 20 cities were identified as low-level risk cities, mainly located in central Southwest China, such as Guizhou and the border regions of Yunnan and Sichuan. It is worth noting that Nujiang Prefecture and Ganzi Prefecture were the only areas identified as safe-level.
(2) By 2015, Panzhihua City’s risk level had decreased from high to low-level risk, demonstrating a positive trend. However, Meishan City, Lijiang City, and Xishuangbanna Dai Autonomous Prefecture shifted from medium- to high-level risk. In contrast, Qiandongnan Prefecture improved from a low-risk to a safe level area. Risk levels in other regions largely remained stable.
(3) In 2020, the risk levels in Lijiang City, Meishan City, and Xishuangbanna Dai Autonomous Prefecture decreased from high to medium level risks. Several cities, including Zigong City, Neijiang City, Leshan City, Nanchong City, Bazhong City, and Liupanshui City, transitioned from medium- to low-level risks. In contrast, Diqing Prefecture’s risk level increased from low- to medium-level risk, while Yibin City and Ziyang City improved from low-level risk to safe area. Notably, following the implementation of the zero-growth fertilizer use growth initiative, the results display that no cities in Southwest China were classified as high-level risk by 2020, showing remarkable progress in reducing CF-induced environmental risks.
Fig. 3.
Spatial Distribution of Chemical Fertilizer Pollution Risk and Decoupling Distribution of Fertilizer Application and Agricultural Production in the Southwest Region from 2010 to 2020. Notes: The source of this map is from the standard map service system of the Ministry of Natural Resources (http://bzdt.ch.mnr.gov.cn/ index.html), with the reference number GS (2019) 3333
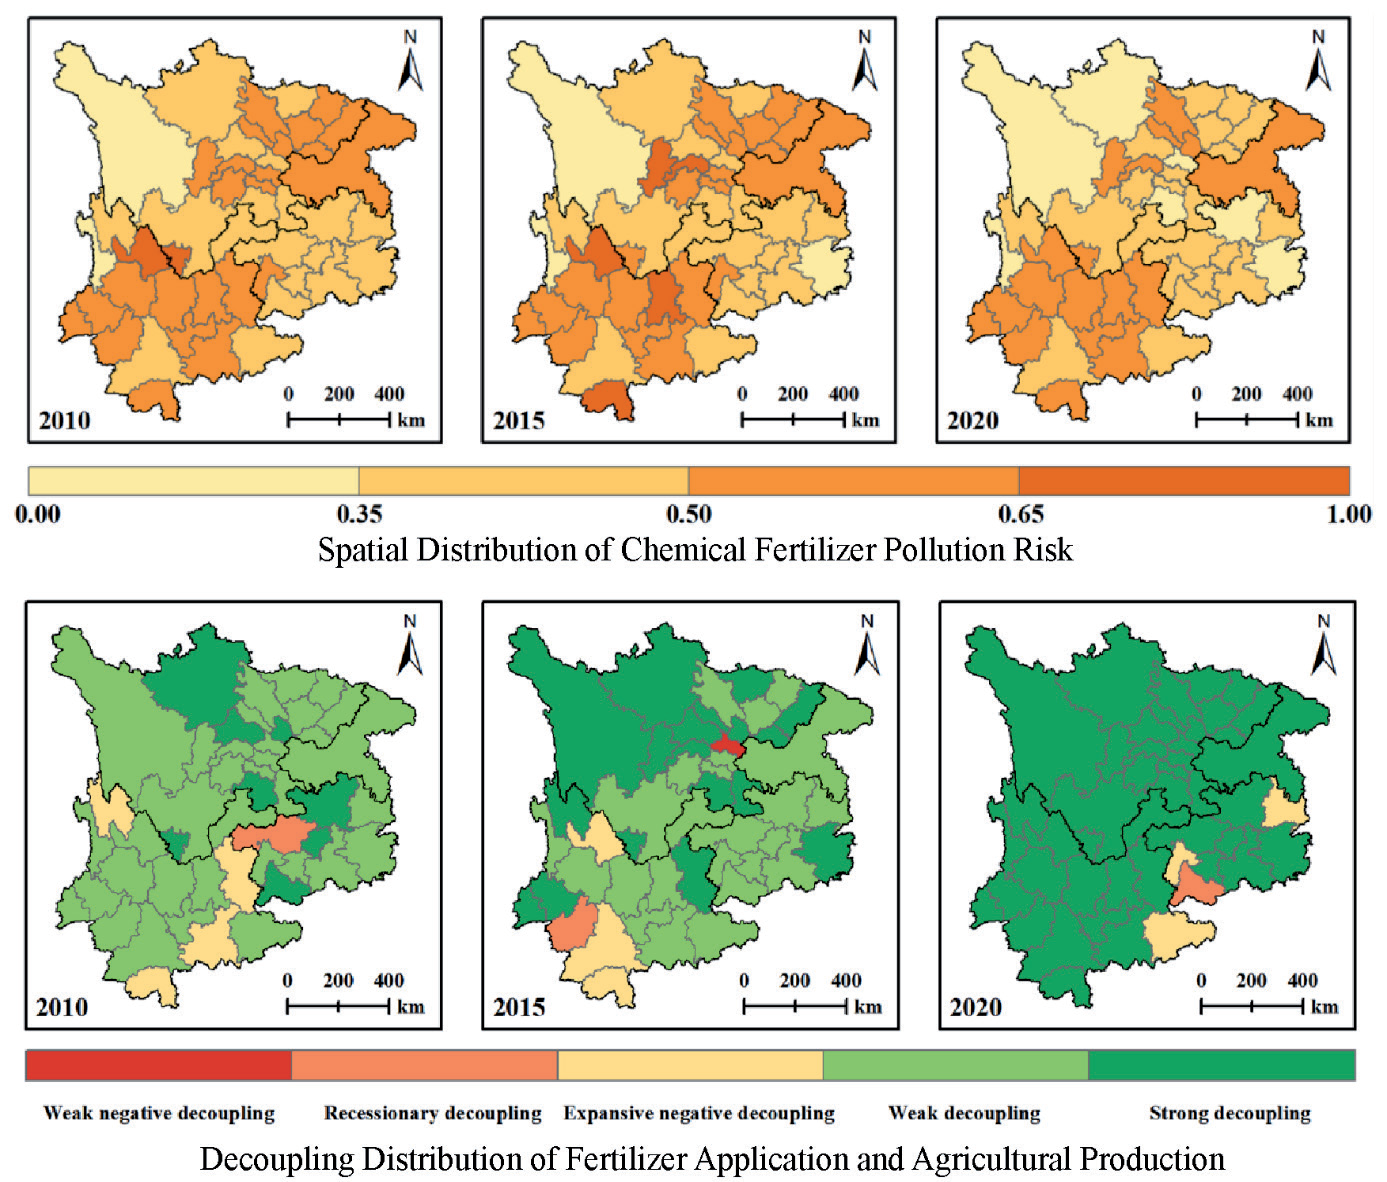
Moreover, fertilizer-driven pollution risk in Southwest China exhibited two significant clusters. One cluster shows that the majority of municipalities and prefectures are in Yunnan Province, while the other is concentrated in eastern Sichuan Province and Chongqing City. Although the spatial extent of the clusters gradually decreased between 2015 and 2020, medium-risk areas remained widespread across Southwest China in 2020, suggesting the urgent need for further improvements in CF management strategies in China.
Finally, this work employed the KDE method to evaluate fertilizer-driven ecological risks for the years 2010, 2015, and 2020 to investigate the temporal changes and regional differences in fertilizer-driven non-point source pollution risk at the municipal level in Southwest China. As shown in Fig. 2, the findings reveal a “right-skewed” distribution pattern of fertilizer-driven non-point source pollution risk, with the distribution curve gradually shifting from left to right and its peak transitioning from lower to higher values. Specifically, between 2010 and 2015, the kernel density curve shifted to the right, identifying an increase in the number of municipalities and prefectures experiencing significant fertilizer-driven non-point source pollution risks. Then, the curve shifted leftward by 2020, indicating a reduction in the number of municipalities and prefectures at higher-level risk. In terms of morphology, the kernel density curve displayed a “one main peak with several secondary peaks” structure, suggesting a spatial imbalance. The main peak was significantly higher than the secondary peaks, reflecting a strong gradient effect in the fertilizer-driven non-point source pollution risk index in Southwest China. The distribution extensibility, characterized by the distance between the main peak and the secondary peaks, along with a slight left tail, revealed notable variability in different pollution risks among different municipalities and prefectures.
Fertilizer Reduction Effect
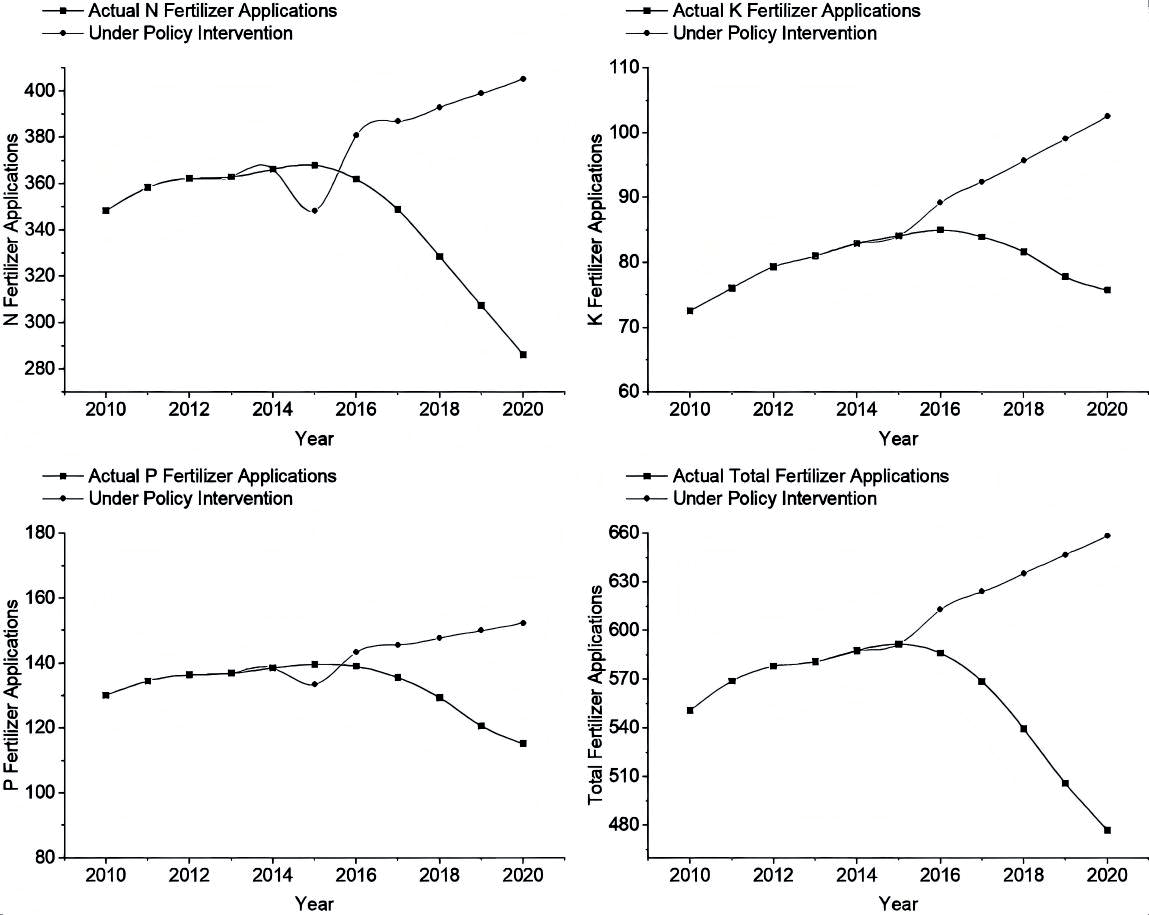
The grey prediction models used for the effect of chemical fertilizer reduction are all valid (See Table 3). As shown in Fig. 4 and Table 4, the results show that CF applications in China would have continued their upward trajectory, rising from 5.917 million tons in 2015 to projected values of 6.1315, 6.2418, 6.354, 6.4685, and 6.5849 million tons annually from 2016 to 2020. However, following the implementation of the CF reduction initiative, actual CF use during this period was estimated to decrease by 0.2694, 0.5558, 0.9591, 1.4085, and 1.8133 million tons, respectively. The total CF reduction over the five years was estimated at about 5.01 million tons, equivalent to about 84.6% of the CF application in 2015.
In terms of CF composition adjustments for Southwest China, as shown in Table 4, nitrogen fertilizer experienced the most substantial reduction effect, with a cumulative decrease of 3.32 million tons, followed by phosphorus fertilizer with a reduction of 0.994 million tons, and potassium fertilizer with the smallest decrease of 0.749 million tons. The reduction effect among single-element CF reflects the progress in achieving the policy’s goals of “stabilizing nitrogen, adjusting phosphorus, and supplementing potassium.” The dynamics are expected to mitigate the environmental impacts of agricultural practices, contributing positively to the sustainability of agricultural production in China.
Decoupling Relationship Analysis
In this section, we examine the decoupling effects in the Southwest region from 2010 to 2020 through a two-dimensional approach. The first dimension involves analyzing the relationship between agricultural output and CF applications, while the second dimension quantifies the extent of the decoupling effect to analyze the dynamics between agricultural development and CF use.
The Relationship Between Fertilizer-Driven Non-Point Source Pollution and Agricultural Production
As shown in Table 5, the function parameters for the models of CF applications and per capita agricultural output were calculated for Southwest China and its four sub-regions by using Equations (2-6) and (2-7). These calculations allowed for the derivation of the EKC for fertilizer applications across provinces and cities within the Southwest region. R2 for each province and city ranged from 0.790 to 0.958, with a significance level of p<0.05, indicating that the EKC model provides robust explanatory power.
The study also uses the cointegration test with a maximum rank of either 0 or 1. All trace statistics are found to exceed the 5% critical value, as shown in Table 6. This statistical result leads to the rejection of the null hypothesis, which suggests the cointegration relationship at a 5% significance level. Thus, a long-term equilibrium relationship exists between CF application rates and per capita agricultural output in the Southwest region.
Table 3.
Grey forecasting model for fertilizer application in Southwest China.
The results of the EKC curve reveal an “inverted U-shape” pattern for the Southwest region, as well as for each province and city. This pattern indicates that CF application rates initially rise but eventually decline as per capita agricultural output increases (see Table 5). This trend reflects the agricultural production drives higher CF consumption while imposing significant pressures on ecological sustainability, particularly both soil and water resources. However, once per capita agricultural output reaches a threshold, CF application growth slows and eventually declines (see Fig. 5). This turning point indicates a key transition where the environmental impact of agricultural activities transited from harmful to beneficial, highlighting the decoupling effect of agricultural output growth from fertilizer-driven pollution.
Table 4.
Actual fertilizer applications and simulated applications.
Table 5.
Estimation results of the EKC model for fertilizer application and agricultural output value per capita in Southwest China.
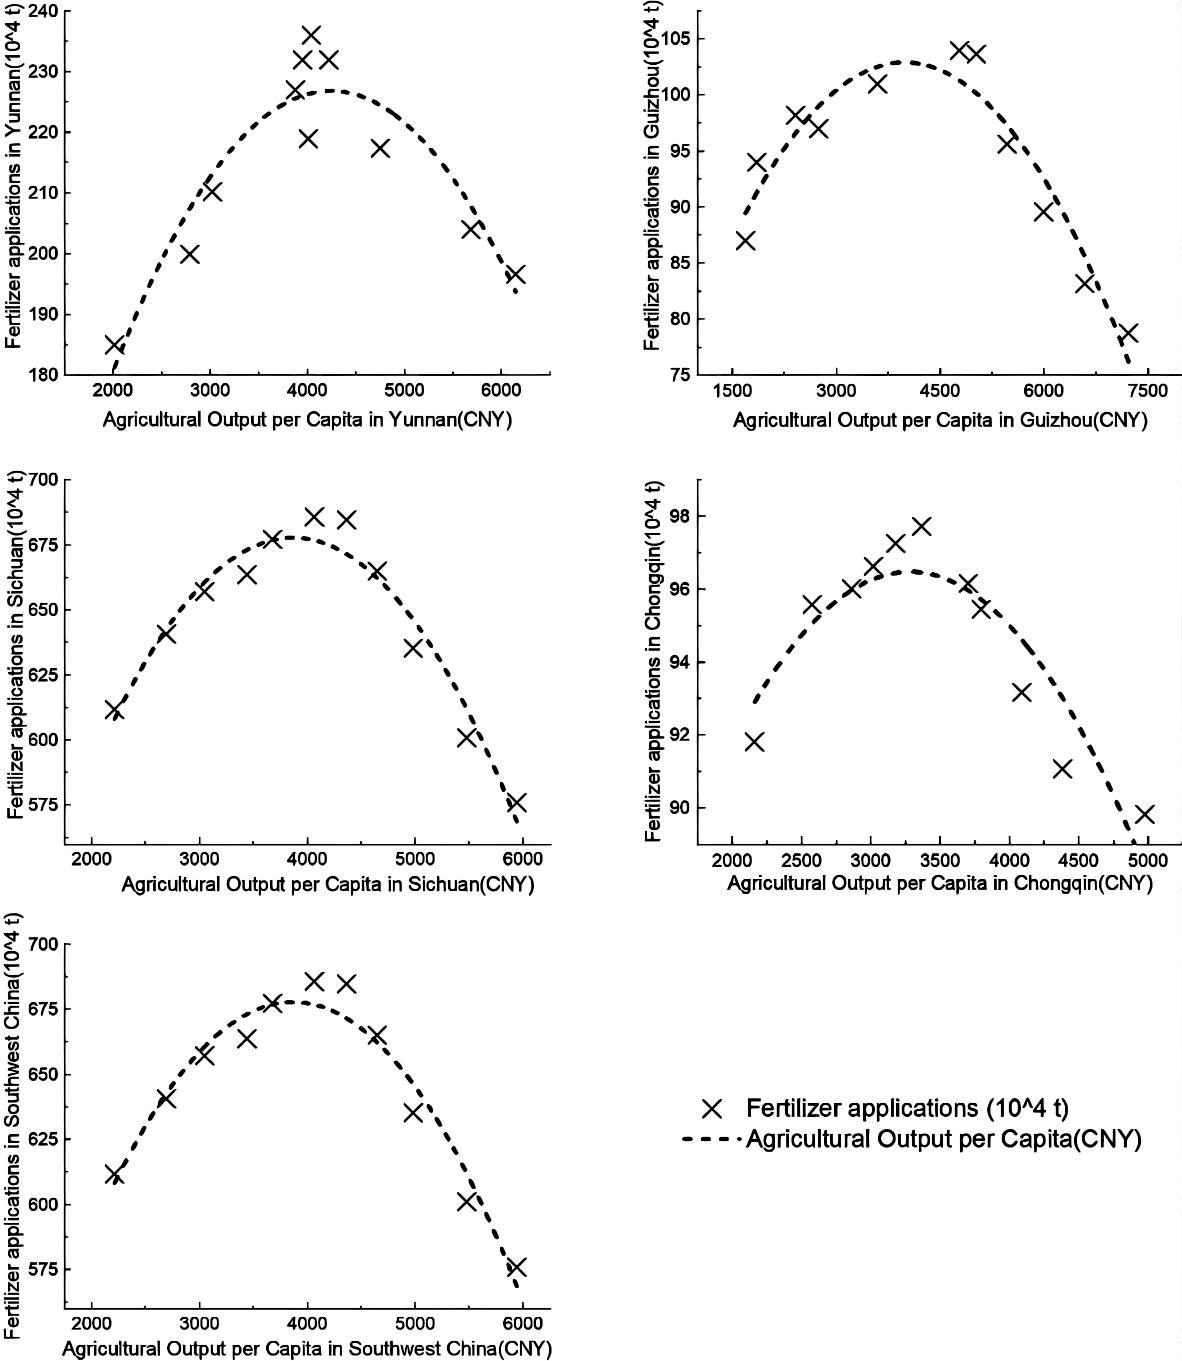
Table 6.
The results of the Johansen cointegration test between fertilizer application rate and per capita agricultural output value in Southwest China.
Temporal Evolution Analysis of the Decoupling Relationship
As illustrated in Fig. 2 and detailed in Table 7, the decoupling index (DI) turned negative and continued to decline. This trend reflects an increasing decoupling relationship between fertilizer pollution and agricultural output. This analysis highlights two distinct phases of decoupling relationship based on DI:
(1) Phase 1 (2010-2015): Both agricultural output and CF use increased. However, the growth rate of agricultural output exceeded that of the CF-driven non-point source pollution risk index, resulting in a “weak decoupling” relationship. This occurs when the decoupling coefficient (0<DI<1). The findings suggest that while agricultural productivity and CF use both increased, the relative reduction in pollution intensity indicates progress toward decreasing dependency on CF applications for productivity.
(2) Phase 2 (2015-2020): Following the implementation of the zero-growth fertilizer policy, a strong decoupling relationship emerged, characterized by increased agricultural output despite reduced CF use (DI<0). This trend indicates a transition toward more sustainable agricultural practices, with improved CF use efficiency and environmental benefits.
Notably, DI exhibited a gradual decline since 2015, reflecting an intensifying decoupling effect. In 2010, the Southwest region included 33 prefectures (or cities) classified as “weak decoupling”, 4 prefectures showing “negative decoupling”, and only 1 city achieving “strong decoupling”. However, the zero-growth CF use policy in 2015 catalyzed a significant CF use transformation, and the results display those 18 cities exhibited “strong decoupling” while 23 cities maintained “weak decoupling”. By 2020, 42 cities in the Southwest region achieved “strong decoupling”, 3 prefectures exhibited expansive “negative decoupling”, and only 1 prefecture remained “weak decoupling”. As shown in Table 7, the results suggest that 91.3% of the prefectures successfully enhanced agricultural output while achieving substantial reductions in CF-driven pollution risks.
Table 7.
The decoupling relationship between chemical fertilizer and agricultural production in Southwest China from 2010 to 2020.
Spatial Distribution Analysis
In terms of the analysis of regional distribution, the proportion of cities in the Southwest region achieving “strong decoupling” showed a significant increase, rising from 18% in 2010 to 92% in 2020. In 2010, most cities in this region were in a state of “weak decoupling”. By 2015, the number of cities for “strong decoupling” had expanded, particularly in the northern and southwestern parts of the region. In 2020, nearly all cities in the Southwest region had achieved “strong decoupling”, except for a few areas located on the southeastern and eastern of the region. This progress suggests the collaborative efforts among regional prefectures contributed to practices of the zero-growth CF use policy. Overall, as shown in Fig. 3, the findings show the region’s success in reconciling the dual-policy objectives of reducing CF use and sustaining growth in agricultural output (see Fig. 3).
Analysis of the Driving Factors of Fertilizer Applications
In this section, we employ the Logarithmic Mean Divisia Index (LMDI) decomposition method to quantify the contributions of four key factors driving the reduction of CF use, namely, improvements in fertilizer use efficiency (FUE), agricultural technology progress (ATG), changes in the multiple cropping index (MCI), and differences in cultivated land area (CLA). The estimated results are presented in Table 8.
Fertilizer Use Efficiency (FUE)
Improvements in FUE consistently contributed to the reduction in CF applications, leading to a cumulative decrease of 241.96 million tons during 2015-2016, with a value of 174.72 million tons in 2017-2018, and 138.12 million tons in 2019-2020. Among these provinces, Yunnan and Sichuan were pioneering provinces that achieved significant reductions in CF use through improved FUE. However, as the years progressed and scientific FUE practices became more widely used in this region, the marginal impact of this factor gradually diminished.
Agricultural Technological Progress (ATP)
The impact of ATP on CF use reduction exhibited an inverted U-shaped trajectory. In the initial stages, limited technology progress led to a temporary increase in CF use. However, by 2017, as agricultural technologies became more widely implemented, ATP’s contribution to CF reduction reached its peak plateau. Notably, the findings indicate that Guizhou Province’s distinct emphasis on ATP led to substantial reductions in CF use.
Table 8.
Decomposition of driving factors of fertilizer pollution applications in Southwest China.
Multiple Cropping Index (MCI)
The rising MCI, which might be driven by food security concerns, had a negative impact on CF reduction. As the frequency of crop cycles per year and CF demands increase, it might counteract the gains achieved through improved FUE and ATP. The effect was particularly significant in Chongqing and Sichuan provinces, where high MCI contributed to significant increases in CF applications.
Cultivated Land Area (CLA)
Changes in CLA had a relatively modest impact on CF use. With increasing economic development and urbanization in this region, CLA decreased, inevitably resulting in a reduction in CF applications. However, the findings show the overall influence of CLA was less significant compared to the other three factors.
Discussion
The Dual-Objective evaluation framework developed in this work shows extensive applicability across different dimensions, as detailed below:
(i) Applicability to different geographic regions. The dual-objective evaluation approach is not confined to the southwestern region of China. Instead, this framework can be effectively extended to other regions in China. Its adaptability might ensure broad adaption in regional assessments, making it a versatile and useful tool for evaluating CF use. (ii) Suitability to different development stages. By integrating the EKC hypothesis and the decoupling model, this study illustrates how CF-driven pollution follows an inverted U-shaped trajectory in relation to per capita agricultural output. This relationship provides an essential finding for other developing countries or regions, which can use the insights to identify and control CF-driven pollution. This initiative can help mitigate the CF-driven pollution risks and the subsequent financial and environmental stress of environmental governance, thus promoting sustainable agricultural practices. (iii) Applicability to other agricultural non-point source pollution. Although this study mainly focuses on indicators such as CF application rates, total agricultural output, and CLA, the framework’s availability allows for the adaption of other agricultural non-point source pollutants. Metrics such as heavy metal pollutants and pesticides can also refer to these CF-related indicators. The versatility enables the framework to be adopted by a wide range of agricultural non-point source pollution and enhancing practices in sustainable agriculture.
In the field of pollution framework construction, prior studies have developed models addressing pollution in the agriculture sector, food security, and human health. These frameworks often incorporate assessments of pollution risk, vulnerability, hazard risk, and socioeconomic factors [49, 50]. This work extends previous studies by focusing on achieving trade-offs between two critical objectives: implementing a zero-growth CF use policy and ensuring food security. The findings align with this national CF demands trend, as evidenced in the southwestern region, which confirms similar patterns of decreasing CF-driven pollution risk in China [51]. Moreover, China’s CF reduction policies have been investigated in several aspects. While factors such as policy intervention, farmers’ attitudes [52], and the progress in agricultural technology play significant roles in the effectiveness of the policy [53], the zero-growth CF use initiative has successfully led to reductions in CF use in China [54].
In general, the majority of cities have successfully managed the CF application with the enhancement of agricultural output, effectively aligning the policy goal. Thus, it is imperative for policymakers to introduce supplementary measures of CF reduction policies while promoting collaboration across regions and different agencies or sectors to guarantee a sustained decoupling between CF-driven pollution and agricultural productivity. Preventing the resurgence of large-scale CF-driven pollution trends is of utmost importance [55, 56].
Conclusions, Implications, and Limitations
The study establishes a comprehensive dual-objective evaluation framework to assess both CF reduction and food security in Southwest China. By employing the framework, the study examines the spatial and temporal risks of CF-driven pollution, evaluates the consequences of reducing CF use and decoupling effects with the agricultural output, and explores the driving factors behind CF-driven pollution. The findings reveal that CF applications followed an inverted U-shaped pattern, with the highest risk concentrations in specific regions. Implementing the CF reduction policy has led to substantial reductions in excessive CF use. A decoupling relationship between CF-driven pollution and agricultural output could also be identified, balancing the objectives of the zero-growth CF use policy with food security. Moreover, the study emphasizes the importance of pursuing green transition while ensuring food security and advocates for developing CF-driven pollution control policies that consider the roles of enterprises, farmers, and other participants. CF manufacturing enterprises should research and develop more environmentally friendly new types of fertilizers to control fertilizer emissions at the source. Fertilizer retailers, as a key intermediate link, should provide support in promoting new fertilizer technologies. Farmers, as the end-users of fertilizers, should apply fertilizers precisely and increase the proportion of the application of organic fertilizers and slow-release fertilizers.
In conclusion, this research establishes a robust dual-objective assessment framework that supports CF-driven pollution reduction efforts and promotes sustainable agricultural practices in the southwestern region. The study validates the effectiveness and feasibility of the zero-growth CF policy in achieving the dual goals of environmental protection and food security. The findings provided serve as valuable insights for other regions of China and guide policymakers and stakeholders in designing and managing CF-driven non-point source pollution policies.
Based on the findings of our study, we present scientific, evidence-based, and practical strategies with detailed implications outlined below:
Developing Customized Management Intervention
We recommend the implementation of customized management interventions that account for regional disparities in CF-driven pollution. These interventions should meet the specific needs of each city, taking into consideration local agricultural practices, soil nutrients, advancements in agricultural technology, and economic development. For areas identified as medium-and high-risk levels of CF-driven pollution, pollution control measures are necessary to prevent the spread of CF-driven non-source pollutants.
For instance, in Chongqing Municipality, Small-scale rural households are often located in hilly regions, and there is an inverse relationship between the size of farming and CF application rates. Therefore, the government might continue to strengthen land transfer policies, which can lead to more efficient land use and reduce excessive CF use from small-scale farming. Moreover, in areas surrounding plateau lakes, the issue of CF runoff should be given particular attention. For instance, in the Erhai Lake basin in Dali City, Yunnan Province, it is imperative to prevent excessive CF-driven pollutants from entering the lake through surface runoff and leaching, as such inflow could have adverse effects on the fragile plateau lake ecosystem. An effective strategy to mitigate this issue is to combine traditional urea with refined organic fertilizers, which can result in reduced nitrogen application rates while maintaining crop yields.
Promoting Cross-Regional Collaborative Governance
Given the transboundary nature of CF-driven non-source pollution, promoting cross-regional collaborative governance integrating CF-driven pollution control into existing provincial-level water pollution control frameworks can help establish useful governance standards, coordination effects, and a clear accountability mechanism. The collaboration should prioritize preventing the dissemination of CF-driven pollution through river systems, thereby ensuring the efficiency of cross-regional governance.
Prioritizing CF Application Efficiency and Technological Advancements
To ensure food security and accelerate the green transitions in China’s agriculture sector, we emphasize the importance of prioritizing CF application efficiency and technological advancements. This involves promoting soil health and fertilization, scientific CF application fertilization techniques, increasing agricultural machinery for useful CF application and straw incorporation, and augmenting rural human capital investment to promote farmers’ knowledge and skills in scientific CF application. One example of the technological progress of CF is the promotion of the technology for preparing nitrogen and phosphorus fertilizer tablets through small-scale green ammonia production [57]. This technology boasts excellent characteristics such as low cost and efficient absorption by plants. Furthermore, the latest cases related to the technologies for remediating soil pollution caused by CF include the technology of “Alkaline Activator with Silica-Rich Wastes” and the biochar technology produced from discarded bamboo chopsticks. Both technologies have demonstrated good remediation effects [58, 59].
Overall, the southwestern region can effectively mitigate CF-driven non-point source pollution from the agricultural sector by implementing these recommendations, achieving the dual objectives of zero-growth of CF use and food security, and enhancing the green transition for the agricultural sector. These suggestions are also supported by both national strategy and practical feasibility, providing a solid theoretical foundation and practical guidance for implementing sustainable agricultural practices in China.
While this study has significantly enhanced the understanding of both objectives of CF-driven non-source pollution and food security in China’s southwestern region, it is important to acknowledge its several limitations. Firstly, our analysis of CF-driven pollution risk and decoupling effects are currently confined to the prefecture-level city, suggesting that future research could benefit from extending to the county level. Secondly, given the capacity of CF-driven non-source pollution to spread through river systems, watershed-based studies of CF-driven pollution should be given attention and focus. Moreover, the background of this work is designed based on China’s first round of the Zero Growth of CF use Policy, implemented in 2015. During this phase, the primary emphasis was on reducing the total quantity of CF use without exploring structural adjustments or improvements in the quality of CF application in Southwest China. In particular, China has launched the second round of CF reduction policies, targeting the year 2025, which places a significant emphasis on CF reductions. The newly developed policy aims to adjust the ratio between organic fertilizers and CF. However, due to incomplete data availability, this work is limited to investigating the quality and structural changes in CF-driven non-source pollution to extend to the year 2025.

