

Introduction
Olive mill wastewater (OMW) is the main liquid effluent generated during the olive oil production [1, 2]. This liquid is characterized by its acidic pH with values between 3.5 and 5.5 and high salinity due to the important addition of salt for the conservation of olives [3, 4]. Olive mill wastewater (OMW) is directly dumped on agricultural soils. Annually, the volume of this liquid waste reached 30 million cubic meters in Mediterranean countries [5]. The huge quantities and the uncontrolled disposal of olive mill wastewaters (OMW) cause serious social, economic and environmental problems in the Mediterranean basin, where olive cultivation is concentrated. These liquid effluents rich in salts, in polyphenols and other compounds with different toxicity degrees induce a damaging process affecting plants at various stages of their development but also OMW is characterised by a high amount of organic compounds and plant mineral nutrients.
The principal fate of OMW is direct spreading to agricultural soils. This elimination method could be a successful way of OMW valorisation if spreading is done in controlled conditions with convenient doses. Therefore, the destiny of agricultural production will depend on our capability to cultivate plants on salt-affected soils. Thus, the investigation of stress tolerant and alternative food crops becomes a necessity [6].
Many underused crops such as Quinoa (Chenopodium quinoa), are particularly suitable for marginal lands where they could tolerate stress conditions and contribute to sustainable production. Indeed, this Andean pseudocereal plant usually grows across a wide range of latitudes, altitudes, precipitation zones, soil types and salinity levels [7]. Moreover, Quinoa is known as one of the essential food crops due to their agronomic characteristics, nutritive and biological properties. It contains a perfect balance of protein, carbohydrates and lipids, as well as essential amino acids for human diet. Quinoa is gluten-free by nature and has high contents of antioxidant compounds, vitamins and minerals [8].
Therefore, this kind of plant needs to be evaluated for its agronomic value and for genetic variation of specific traits under stress environments, to allow more efficient genetic improvement and promotion. In this context, there is a need to add new insight to the molecular aspects of salt tolerance in Chenopodium quinoa through gene expression. However, the challenge for any expression study is to determine a reference gene that should be stable and unaffected in a given condition.
Previous work tended to focus on the selection of appropriate reference genes for Arabidopsis thaliana [9], wheat [10], barley [11], rice [12], pea [13], peach [14], olive [15] and others. However, there is little research concerning Chenopoduim quinoa, particularly in response to abiotic stresses such as salt stress [16, 17].
Thus, our research focuses on the selection of suitable housekeeping gene for qPCR analysis in Chenopodium quinoa on salt-affected soils. For this purpose, we conducted an analysis using geNorm, NormFinder and BestKeeper to identify the most stable reference gene for Quinoa plants in the seedling stage when tested under OMW stress conditions.
Material and Methods
Study Area and OMW Characteristics
The present study was carried out in the Arid Regions Institute (IRA) in the south east of Tunisia (North latitude: 33º16′21″, East longitude: 10º19′30″). This region is characterized by a semiarid to arid climate with 150 mm of irregular precipitation annually and 20ºC average annual temperature. The olive mill waste water was taken from three extraction phases of olive oil in a traditional factory located in Medenine. The physicochemical characteristics of OMW are described in Table 1. OMW shows a great pollutant load (96 g·L-1 of COD), an elevated electrical conductivity (11 ds/m), a high supply of organic substances rich in toxic phenolic compounds (8.7 g L-1) and an acidic pH (4.6±0.2).
Plant Material and OMW Application
Seeds of C. quinoa Willd. were obtained from DRC (Desert Research Center-Cairo, Egypt), cultivar used was “Regalona”, it is a cultivated plant introduced from Chili. The study complies with relevant institutional, national, and international plant guidelines and legislation. It is to highlight that permissions to collect and use these seeds were obtained. The experiment was carried out in greenhouse under natural conditions. After sterilization, 40 seeds were sown in plastic pots (55 x 26 x 20 cm size). Every pot contains 10 kg of soil with the following texture: clay 5.38%, loam 6.72, thin sands 4.15%, very thin sands 6.72% and coarse sands 40.88%. OMW was added to soil at rates equivalent to the field experiment ones [18]. OMW application was done at rates equivalent to 1.5 L/m2, 3 L/m2 and 4.5 L/m2. The pots containing not amended soil were served as control. Sowing was carried out ten days after each OMW application. All the treatments were done in triplicates.
Table 1.
Physicochemical characteristics of olive mill waste water.
RNA Isolation and cDNA Synthesis
Leaf tissue from treated and untreated plant was collected at the seedling stage, frozen in liquid nitrogen, and then stored at −80ºC for RNA extraction. Total RNA was extracted from 100 mg of leaf samples using “PureLink RNA Mini Kit” (Thermo Fisher Scientific). RNA quality and quantity were evaluated using spectrophotometer (Lasany) and agarose gel electrophoresis (1.2%).
cDNAs were reverse transcribed from total RNA using a cDNA Synthesis Kit (Invitrogen SuperScript® III First-Strand Synthesis System) following the manufacturer’s protocol using random hexamer primers. This kit was used to ensure removal of genomic DNA contamination. Obtained cDNA were stored at −20ºC.
Reference Genes Selection
Genes encoding Ubiquitin-conjugating enzyme (UBC), Factor elongation 1-alpha (EF- 1α), Glyceraldehyde-3-phosphate dehydrogenase (GAPDH), Ubiquitin-protein ligase 7 (UPL7), Monensin sensitivity1 (MON1) and Actin (ACT) were selected in order to choose the most stable one under different OMW applications. Those genes have been identified and used in previous researches as internal control for qRT-PCR in Quinoa. The specific amplification primers of these candidate reference genes for qRT-PCR are shown in Table 2.
Reference Genes Quantification Conditions
Candidate reference genes quantification was performed using qPCR that was carried out in singleplex using SYBR Green. Three independent seedling samples for each treatment were analyzed in triplicate. Reactions were prepared in 48-well plates to a final volume of 20 μl; 2 μl diluted cDNA (1:4), 10μl of SYBR Green Mix, 0.8 μl of primer mix (containing forward and reverse primers at a concentration of 10 μM) and 7.2 μl of nuclease-free water. Thermal cycling conditions were as follows: 95ºC for 30 s; then 45 cycles at 95ºC for 5 s; and 60ºC for 20 s, and finally, we used the melting curve from 65ºC to 95ºC to verify the specificity of primers, plus a final extension at 72ºC for 2 min.
Primers were evaluated for PCR amplification efficiencies using serial dilutions of cDNA samples at rates of 1, 1/10, 1/20, 1/50, and 1/100. The correlation coefficients (R2) and slope values were obtained from the standard regression curves and the PCR amplification efficiencies (E) were calculated according to the following equation: E = (10−1 /slope−1) x 100.
Results
The Housekeeping Genes Expression Levels
For each primer pair, the correlation coefficients (R2) and the PCR efficiency values were determined using the standard regression curves with serial dilutions of cDNA samples.
Table 2.
Candidate reference genes and primer sequences.
Table 3.
Gene symbol, slope, PCR efficiency and correlation coefficient for the studied genes.
| Gene Symbol | Slope | PCR Efficiency (%)* | R2 value** |
|---|---|---|---|
| GAPDH | -3.38 | 97.5 | 0.99 |
| ACT | -3.61 | 88.6 | 0.92 |
| UBC | -3.72 | 81.5 | 0.90 |
| EF-1α | -3.45 | 93.4 | 0.95 |
| UPL7 | -3.05 | 111.2 | 0.84 |
| MON1 | -3.35 | 98.3 | 1 |
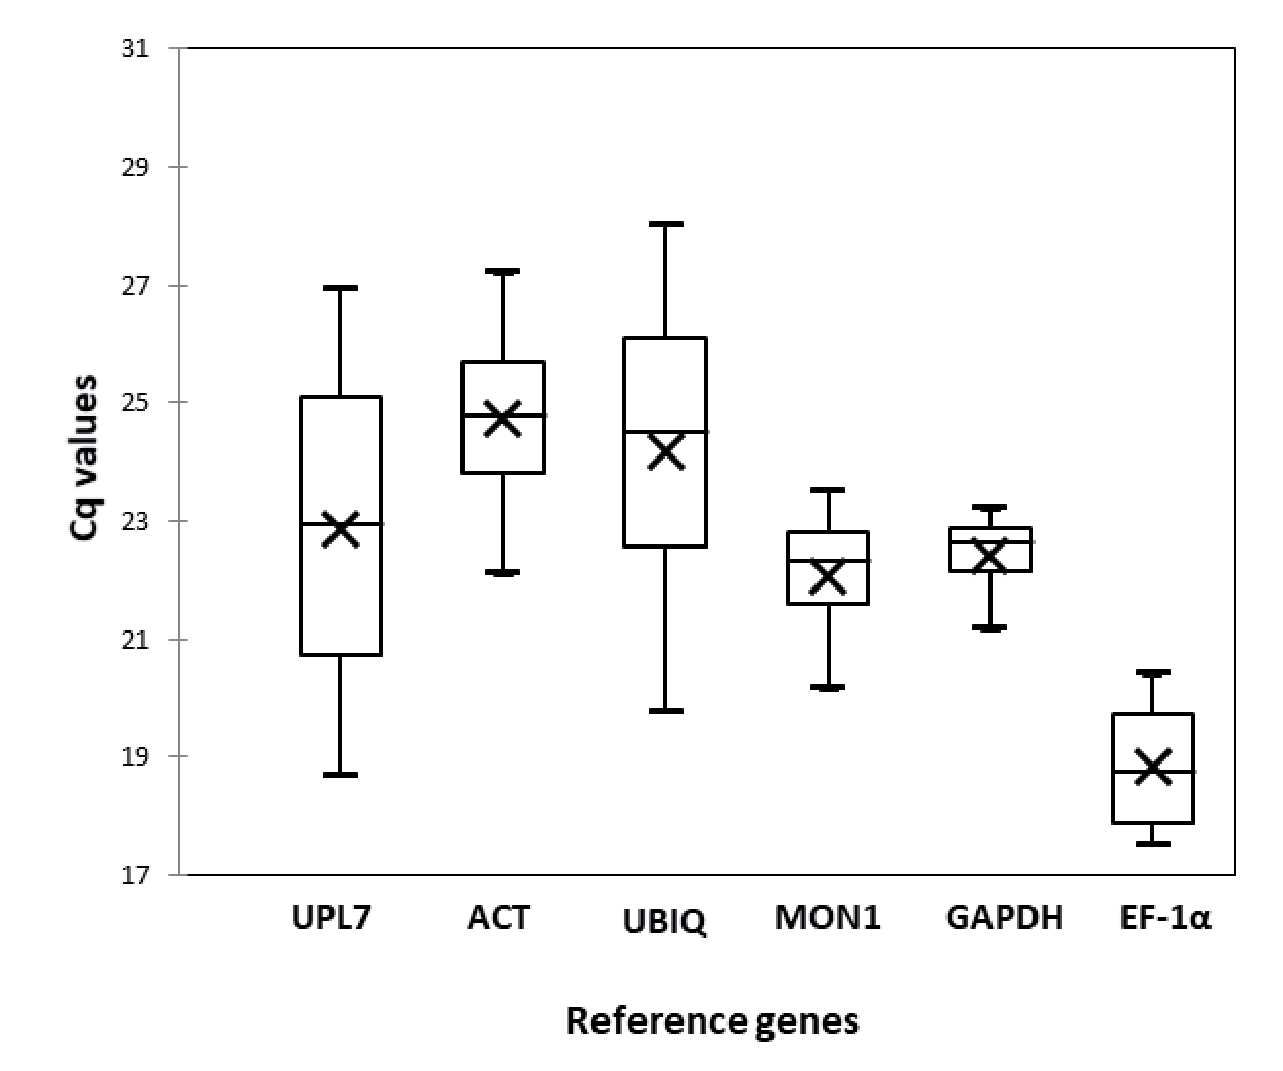
Fig. 1.
The quantification cycle (Cq) values of the 6 candidate reference genes across all samples under salt stress. Lines across the box plot of Cq value represent the median values. Lower and upper boxes show the 25th percentile to the 75th percentile. Whiskers represent the maximum and minimum values.
According to Bustin, Benes [21] acceptable range of PCR efficiency should be between 80–120%. If the slope is below –3.6, then the PCR has poor efficiency.
The obtained results indicated E values varying between 81.5% and 111.2% and R2 from 0.84 to 1 (Table 1). The quantification cycle (Cq) values were evaluated to determine the gene expression levels. The Cq values for studied samples varied from 17.5 to 28.6 (Fig. 1).
GeNorm Analysis
Pairwise variation (V) analysis of the candidate reference genes based on geNorm determine the best number of references genes required for qRT-PCR data normalization. We notice a correlation between this ratio and gene stability (Fig. 2a). According to Fig. 2a), the value V5/6 is higher than V4/5; this is owing to the insertion of an unstable fifth gene.
GeNorm analysis showed that the average expression stability (M-value) varied between 0.275 for the most stable genes and 1.193 for the least stable gene (Table 4).
Based on geNorm software, genes with the lowest M-value were considered the most stable; however genes with the highest M-value were considered the least stable. According to geNorm analysis results, MON1 and GAPDH were assessed as the most stable among a set of commonly used housekeeping genes. The rest of the genes showed a low level of expression stability. The least stable was UPL7 (1.193) (Table 4).
NormFinder Analysis
Using the NormFinder algorithm, Cq values of 6 reference genes were converted into relative quantities. Gene stability values based on the NormFinder analysis are indicated in Table 4. We can consider a gene as the most stable when it has the lowest stability value, whereas the gene with the highest stability value is considered as the least stable.
Fig. 2.
geNorm reference gene expression stability assessment. a) Average expression stability values (M) of 6 reference genes as assayed by geNorm. The least stable genes are on the left and the most stable genes are on the right. The dotted horizontal line represents the proposed cut-off value for unstable genes (>0.5). Lower values denote higher stability; b) Pairwise variation (V) of the candidate reference genes calculated by geNorm. Vn/Vn+1 values were used to determine the optimal number of reference genes required for qRT-PCR data normalization. Vn/n+1value below 0.15 (dotted horizontal line) indicate that the value (n) can be considered as the optimal number of reference genes. Increasing variation in this ratio corresponds to decreasing expression stability.
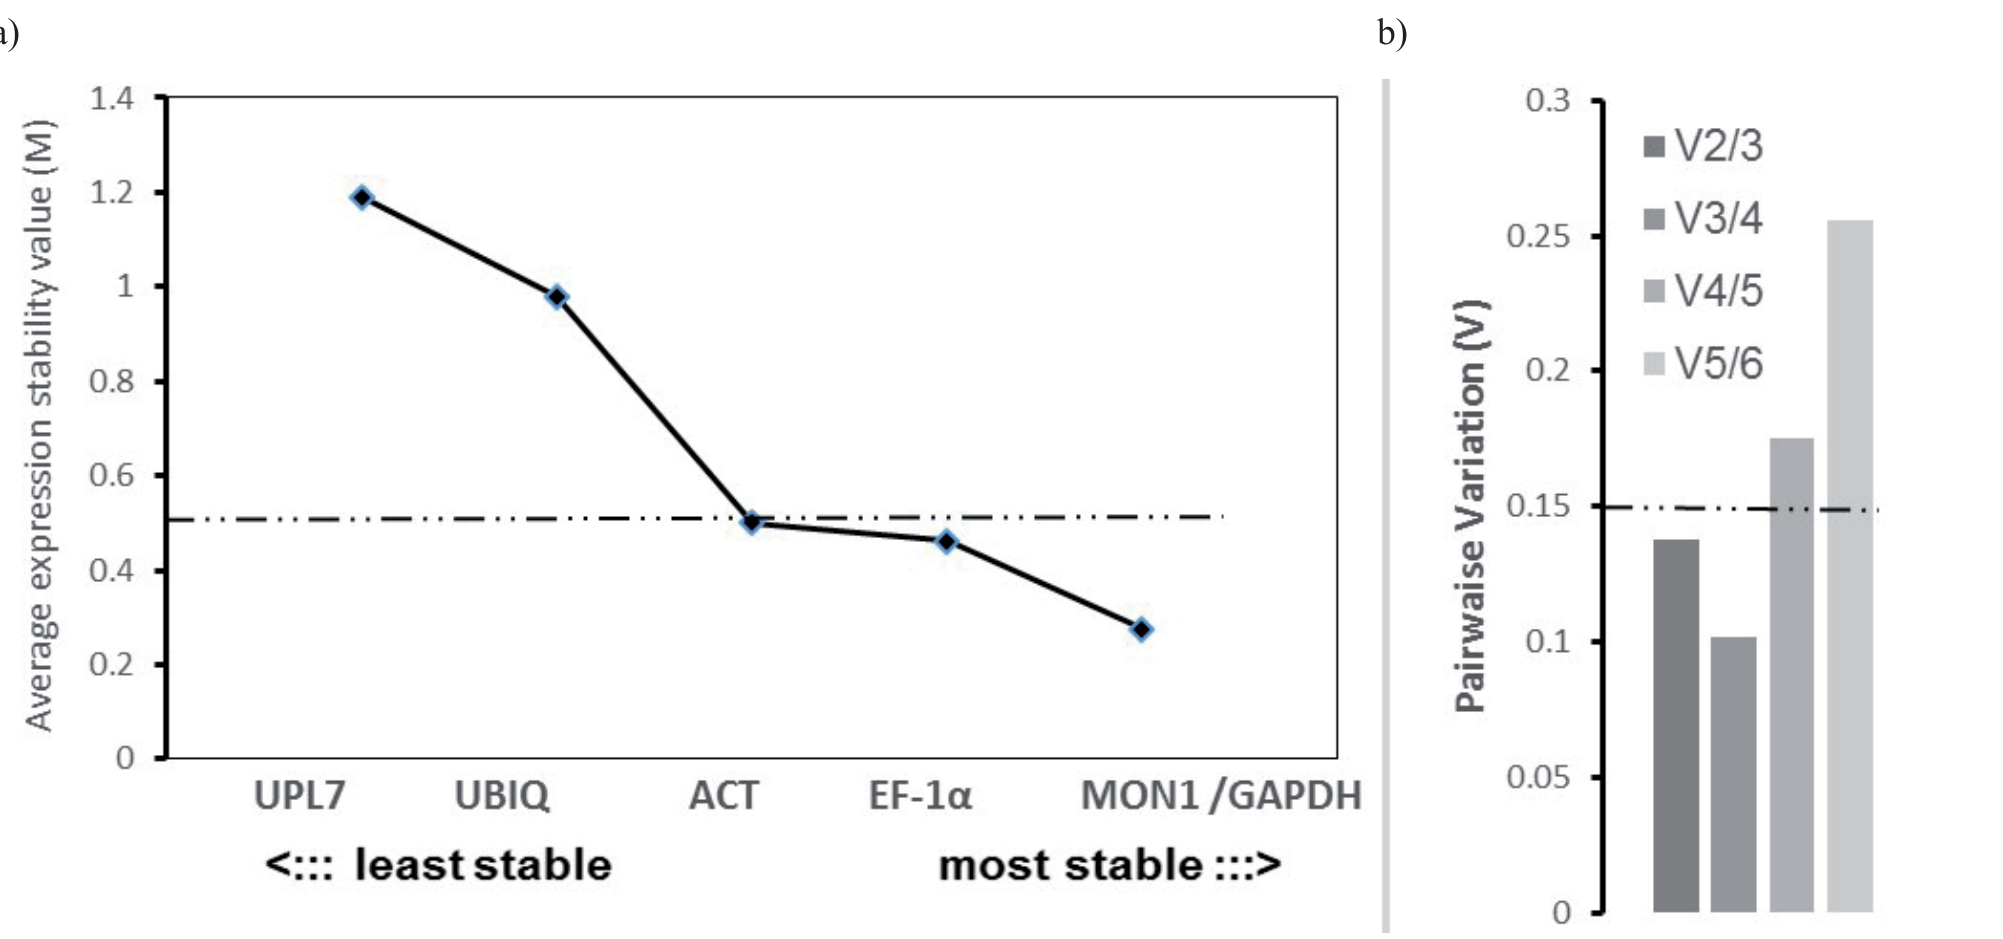
Table 4.
Ranking of reference genes according to their expression stability by geNorm, NormFinder and BestKeeper softwares.
[i] Note: a: Average expression stability (M): the lower the M value, the more stable the expression; b: Stability value: the lower the stability value, the more stable the expression; c: Standard deviation (SD): the lowest SD values, the more stable the expression; d: Coefficient of variance (CV): the lowest CV values, the more stable the expression.
The Normfinder results were significantly similar to that of geNorm, as same set of genes (MON1, GAPDH, EF-1α) was most stable in Normfinder analysis. Genes like UBIQ and UPL7 revealed higher expression variability and were least stable. Both algorithms indicated that the GAPDH gene was the most stable gene.
BestKeeper Analysis
In the BestKeeper program, the expression stability is usually determined by assessing the coefficient of variance (CV) and the standard deviation (SD) of Ct values.
The most stable reference genes were recognized as those with the lowest SD and CV values.
The BestKeeper results were slightly different from those of NormFinder and geNorm. According to BestKeeper, the three reference genes with the highest stability were MON1 (1.25±0.34), GAPDH (1.69±0.39) and ACT (1.75±0.48) (Table 4). The least stable was UBIQ (3.74±0.92) (Table 4).
Discussion
The study of expression genes of interest under a particular environment become one of the most important features for the identification of their functions. qRT-PCR method is widely and increasingly used for gene expression pattern detection because of its high sensitivity, specificity and efficiency. The performance of qRT-PCR reactions depends on the selection of an appropriate reference gene that should be stable and unaffected under various environmental conditions. Some commonly used housekeeping genes such as UBQ, EF-1α, ACT and TUB were used by researchers as reference genes without optimization. However, many studies have revealed that the expression of these genes is not stable under various environmental stress conditions. Therefore, the reliability of the results of many qRT-PCR studies was affected. This shows that it is essential to analyse the stability of the reference genes with various developed software packages such as GeNorm, NormFinder and BestKeeper before the application of qRT-PCR reactions.
In terms of the expression stability of reference genes under salt stress, diverse results have been obtained in different plant species.
Dudziak et al. [10] have shown that the expression of both Ubiquitin and Actin in wheat seedlings were the most stable housekeeping genes under abiotic stress. Besides, some other reports from Oryza sativa indicated that the Actin and Ubiquitin genes were the most stable reference genes under salt stress condition [22] and EL- 1α, GAPDH and Actin were the most stable ones in the case of wheat [23]. Hua, Zhu [24] have reported that ACT2, UPL, and TIP41 were the most stable reference genes in barley under abiotic stress. This is contrary to results by Niu, Shi [25] which have reported that ACT7, RAN and EF-lα were the top three stable reference genes, while 18S rRNA and ACT were the least stable reference genes Kentucky Bluegrass (Poa pratensis L.) under salt stress.
Tajti [26] have reported that the most stable genes alone or in combination in Avena sativa L. under salt stress were GAPDH and CYP. GAPDH was proposed as the most used reference gene in triticum durum [27] under salt stress as well. TUB-1 and EF-1a were the most stable, while that of GADPH and TUA were least stable in quinoa under salt stress [17].
In the present study, we analysed six reference genes and the results showed that MON1, GAPDH and EF-1α were the most suitable reference genes for Chenopodium quinoa under salt stress. We combined three algorithms (BestKeeper, geNorm and NormFinder) to evaluate the finest reference genes. In the final ranking, we identified, MON1 and GAPDH as the best candidates. However, our data indicated a slight variation between the different algorithms that were used. Same Remarque were observed in different studies [16, 26].
According to the geNorm and BestKeeper software, the gene MON1 had the most stable expression, while the NormFinder program showed this gene is ranked in second place. Moreover, the genes MON1, GAPDH and ACT were the top three stable reference genes using BestKeeper program. However, NormFinder and geNorm program showed the same best reference genes; MON1, GAPDH and EF-1α, which were considered the most stable under the salt stress conditions.
The data obtained by BestKeeper demonstrated slight differences compared to those from geNorm and NormFinder.
Based on the study of Storch, Pegoraro [28], this variance is due to the use of different algorithms such as the BestKeeper algorithm, which employs correlation analyses between the candidate genes Cq contrary to the algorithms of the geNorm and NormFinder that use variation measures to calculate the stability of gene transcription. Many reports showed that the most reliable software for reference genes stability evaluation are geNorm and NormFinder [29]. Various researches have used only these two algorithms for the estimation of reference genes stability [17, 26, 30, 31].
Our results confirmed a previous study conducted on Chenopodium quinoa leaves treated with abiotic stress factor (hormone application) [32]. This analysis performed with the geNorm, NormFinder and BestKeeper algorithms also showed the quinoa ortholog of At2g28390 (MonensinSensitivity 1, MON1) as the best reference gene. MON1 was stably expressed and chosen as a suitable reference gene for qPCR analysis. Maldonado-Taipe et al. [16] have demonstrated the suitability of two housekeeping genes (IDH-A) and (PTB) for gene expression studies in Chenopodium quinoa.
In several studies, it was suggested to use multiple reference genes for data normalization. In the present study, the GeNorm was used to determine the optimal number of genes needed for normalization by the calculation of the pairwise variation Vn/Vn + 1 between two chronological normalization factors NFn and NFn + 1. Results of GeNorm proved that the fourth gene had no effect due to the lowest value of V3/4 = 0.09, so our present data has demonstrated that the optimal number of reference genes for gene normalization is three genes. However, other studies [16] have reported that two reference genes are enough for normalisation when dealing with salt stress.
The results of our present data have provided panel of references that can be utilized during gene expression studies in Chenopodium quinoa. In conclusion, MON1, GAPDH and EF-1α were most stable and appropriate reference genes identified under salt stress conditions and their geometric means would provide accurate normalization factor for expression data in Chenopodium quinoa.
Conclusion
Little effort has been made by far to elucidate the molecular mechanisms underlying the adaptation to salt stress in quinoa. Furthermore, stable reference genes is lacking for this pseudocereal. Therefore, we first screened and validated reference or housekeeping genes for qPCR analysis.
In our study, qPCR results were analyzed using three different statistical algorithms in order to identify the optimal reference gene for Chenopodium quinoa seedlings subjected to salt stress conditions. The results showed that the most stable and appropriate reference genes whose expression was confirmed to be constant in different salt treated and untreated quinoa ecotypes were MON1 and GAPDH, while UBIQ and UPL7 had the worst stability.
The most stable reference genes screened in this work can efficiently improve the standardization of the expression of target genes under salt stress conditions by qRT-PCR analysis in Chenopodium quinoa. These findings might be of great value in salt tolerant breeding of this highly nutritious-pseudocereal.

