


Introduction
Soil salinity constitutes a significant factor in modern-day agriculture, which adversely limits the growth of crops worldwide [1]. About 20% of global arable land is affected by salinity or sodicity. For instance, 0.3-1.5 million ha of farmland is succumbing to salinity annually, which requires serious attention to deal with this alarming situation to sustain the human population [2]. Further, natural processes such as weathering of rocks, higher evaporation of groundwater due to global warming, and low rainfall enhance salt contents in the soil [3]. Furthermore, anthropogenic activities such as excessive use of fertilizers, disposal of chemicals and ions on land and water, irrigation of agricultural land with saline water, and poor water management practices are the major contributors to growing soil salinity [4]. Arid and semi-arid climates have more salinity problems than humid climates when annual precipitation is not as much as evapotranspiration in the world [5]. The arable land in Pakistan mostly falls in arid and semi-arid zones, which further aggravates the problem of salinity [6]. Out of 30 million ha of agricultural land in Pakistan, 21% (6.28 million ha) is affected by salinity and is projected to grow even more in the coming years. Salt stress has detrimental impacts on a crop’s morphological performance, physiological mechanisms, and biochemical adjustments, which reduce seed germination, fresh and dry biomass, photosynthesis, and the accumulation of mineral nutrients [7]. Salinity affects the growth of plants by posing osmotic stress and by the accumulation of sodium ions (Na+) to toxic levels [8]. A higher concentration of Na+, in turn, hampers the transport of certain essential ions (such as calcium, magnesium, and potassium) to their target sites in the cell, resulting in ionic imbalance and the production of reactive oxygen species (ROS) [9]. Moreover, photosynthesis, enzymatic, and non-enzymatic antioxidant machinery is also damaged by imbalanced redox potential, resulting in decreased plant growth and yield [10]. Among crops, wheat ranks first as a staple food and second for highest cultivation globally after maize [11]. In Pakistan, wheat cultivation covers 39.1% of total agricultural land, whereas its contribution to GDP is 2.2%. Despite vast arable land being used for wheat cultivation, the yield per acre in Pakistan is 23 mds, which is very low compared to some developed countries such as the Netherlands, where it reaches up to 91 mds [12]. It has been reported that, in addition to poor agricultural practices, growing soil salinity is also an important factor behind the low yield of wheat. According to [2], wheat is more sensitive to salinity than several other crop plants, resulting in a low yield and growth under salt stress in Pakistan. In an earlier investigation, salt stress of 10 dS m-1 applied to wheat plants resulted in a significant reduction in the plant’s height, spikelets, biomass, and yield of grains compared to control plants [13]. In addition, the rising levels of salinity in arable lands across the globe raise concerns about food security for one-third of the world’s population, which relies on wheat as a staple food. According to an estimate, 397 million ha of land under wheat cultivation is already affected by salinity, which warrants exploring potential alternative solutions to address the problem in a viable and sustainable way [14]. In response to the salinity challenge, various strategies have been employed, encompassing the development of salt-tolerant crop varieties and the implementation of physical and chemical amendments in the soil. Research indicates that both physical and chemical amendments contribute to improved crop growth and yield. For instance, strategically placing seeds on ridges rather than in low-lying areas has demonstrated a mitigating effect on the impact of salinity stress during germination [15]. Furthermore, the incorporation of compost derived from crushed cotton gin into saline soil resulted in a noteworthy 50% reduction in exchangeable sodium percentage (ESP) and a simultaneous 23% increase in soil bulk density. Also, the use of gypsum to alleviate salinity stress is well known and is reported in several crops, including wheat [16], maize [17], and rice [18]. Soil amendments with physical or chemical factors offer a more sustainable way of reclamation than transient mitigation measures such as the exogenous application of a chemical to plants alleviating salt stress [19]. Moreover, the principle behind the integration of several approaches is that no single technique could be as effective as the combination of two or more techniques, which could potentially synergize with one another to produce a resonating response. Based on this evidence, we hypothesized that a combination of physical amendments (ridges), chemical amendments (the addition of gypsum and farmyard manure), and the introduction of a biological amendment (a salt-tolerant variety of wheat) in actual saline fields could be more effective, not only to alleviate the salt-induced changes in growth and ionic toxicity of wheat, but also to obtain a yield from saline fields sustainably.
Materials and Methods
Sampling Site and Seed Collection
The current study was conducted on an agricultural field located in the district of Mardan, Pakistan, with the longitude and latitude of the experimental site being 34.118328° North and 72.098114° East, respectively. Seeds of the wheat variety Pirsabak-15 were collected from the Cereal Crops Research Institute (CCRI), Pirsabak, Nowshera, Khyber Pakhtunkhwa, Pakistan. A composite sample of 0-15 cm and 15-30 cm deep soil was collected to evaluate the physico-chemical properties of the soil.
Determination of Physico-Chemical Properties of Agricultural Field Soil and Irrigated Water
pH and Electrical Conductivity
The pH of the saturated soil paste was measured in soil slurry. The soil-to-water ratio (1:2) was used for the measurement of pH using a pH meter (PHS-25CW Microprocessor pH/mV meter, China) [20]. The same saturated soil paste was used for measuring electrical conductivity using a conductivity meter (HANNA HI 98129 PH/EC/TDS tester meter, HI98129-China) [20].
Sodium Adsorption Ratio
The sodium adsorption ratio (SAR) was measured using the protocol developed by [20], where the equation used for SAR measurement is as follows:
Soil Saturation Percentage
Soil (100 g) was dried in an oven at 105ºC for 24 h. Distilled water was slowly added to 50 g of dried soil until a soil paste with a shiny and slippery silver appearance was formed. An increase in soil weight was measured, and the soil saturation percentage (SSP) was calculated using the following formula [21]:
Soil Textural Class
The soil textural class was determined by using a modified Bouyoucos protocol. Briefly, 1% of sodium hexametaphosphate (NaPO3)6 was added to the soil as a dispersing agent. The percentage of sand, silt, and clay was measured using a hydrometer (measuring range: 0.700 to 0.800 g/cm³, graduation: 0,001 g/cm³, length: 300 mm, and temperature: 20ºC). The textural class was determined by using the international textural triangle [22].
Ionic Concentration in the Agricultural Field of District Mardan
The soil was air-dried and powdered using agate mortar for quantification of the ionic composition of the soil. 2 g of the dried soil was mixed with 5 mL of 70% concentrated nitric acid (HNO3, Sigma 68-70% purity) and left overnight. Thereafter, the solution was heated on a hot plate until brown fumes appeared. The mixture was then allowed to cool to room temperature. 5 mL of perchloric acid (HClO4, Sigma 70% purity) was added to the soil and heated again at 180ºC until a clear solution was formed. After cooling, 5 mL of distilled water was added, and the digestive material obtained was filtered using Whatman filter paper no. 21. Later, the final volume was adjusted to 15 mL by using distilled water. An atomic absorption spectrophotometer (Perkin Elmer-USA, S# 8015050702) was used to determine the ionic concentrations of Na+, K+, Ca2+, and Mg2+ [23].
Determination of Ionic Concentration in Irrigation Water
A sample of 2 mL of water and 5 mL of nitric acid (HNO3) (Purity Sigma 70%) were mixed and heated for 20 min at 80ºC in a fume hood. Then the mixture was cooled to room temperature and mixed with 5 mL of perchloric acid (HClO4). Thereafter, the mixture was heated at 180ºC with constant stirring till the solution turned clear. Distilled water was added to the mixture to achieve a total volume of 50 mL. Na+, K+, Mg2+, and Ca2+ ionic content in water samples was analyzed using AAS (Perkin Elmer-USA, S# 8015050702) [23].
Wheat Cultivation in the Field and Reclamation Treatments
Seeds were soaked in a solution containing 1 mM CaSO4 for 24 h in an aerated chamber. The soaked seeds were then shifted to the selected experimental site for germination. The experimental treatments were: T1; control, T2; ridges, T3; farmyard manure, T4; gypsum, T5; farmyard manure+ridges, T6; gypsum+ridges, T7; farmyard manure+gypsum, and T8; gypsum+farmyard manure+ridges. A complete randomized block design was used for the application of eight treatments, whereas a minimum of three replicates were used for each treatment, with a plot size of 4.0 ft × 4.0 ft. The duration of the experimental trial was from November 2021 to March 2022, when the average humidity was 53% and the average day/night temperature was 15-28ºC.
Growth Analysis of Wheat under Different Reclamation Treatments in the Field
The agronomic traits, such as fresh shoot biomass, shoot height, leaf area, and leaf length were recorded. The data for the parameters described above were processed using ImageJ version 23 [24].
Physio-Chemical Parameters of Cultivated Wheat under Different Reclamation Treatments in the Field
Measurement of Chlorophyll Content
SPAD meter TYS-B (measuring area 2 mm x 2 mm, accuracy ±3.0 SPAD; ±0.5ºC, repeat ±0.3SPAD, ±0.2ºC, operating temperature –10 - 50ºC, and power 4.2V-2000Mah). (Zhejiang TuopuYunnong Technology Co., Ltd.) was used for the measurement of the chlorophyll content of intact leaves [25].
Extraction and Quantification of Total Protein Content in Wheat Leaves
Wheat leaves were ground to powder in liquid nitrogen for extraction of the total proteins. Briefly, a sample of 100 mg of wheat leaves was crushed and blended in a solution consisting of 1 mL of an optimized extraction buffer. The buffer was composed of 100 mM Hepes (pH 7.5), 150 mM NaCl, 0.1% CHAPS, 10% glycerol, 10 mM DTT, and 50 mM CaCl2. The homogenate was sedimented at 16,000 rpm for 10 min at 4ºC (Eppendorf Centrifuge 5415 R). After centrifugation, the supernatant was collected and stored at -80ºC for further analysis.
For the quantification of protein content, the Bradford assay was performed according to the method described by [26]. In brief, 100 mg of Coomassie Brilliant Blue G-250 was dissolved in 50 mL of 95% ethanol (C2H5OH). After that, 100 mL of 85% phosphoric acid (H3PO4) was added to the solution with stirring. Later, distilled water was added to make a total volume of 1 L. The resulting solution was filtered using Whatman filter paper no.
21. For quantification of the total proteins, 100 µL of the extract and 5 mL of Bradford solution were mixed. The mixture was incubated for 5 min at room temperature. A standard curve was prepared by using five different concentrations (0.125, 0.25, 0.5, and 1 g L−1) of BSA (bovine serum albumin), and the absorbance was noted at 595 nm using the UV-Spectrophotometer (UV-1100 China).
Measurement of Ionic Concentration in Wheat
Wheat shoots were oven-dried at 60ºC for 72 h until a constant weight was achieved. Later, 100 mg of dried and powdered samples were subjected to 520ºC for 5 h in a muffle furnace (max. temperature 1100-1400ºC, inner chamber ceramic tile, insulation ceramic fiber, PID controller, power supply 220 and volts 50Hz). Subsequently, the ash was dissolved in 2 mL of 4 M HNO3 with gentle heating for 4 h and stirring every half an hour. The solution was then diluted with the distilled water to make a final volume of 10 mL and afterward filtered through a Whatman filter paper No. 21. Na+, K+, Ca2+, and Mg2+ concentrations in the filtrate were analyzed by using the AAS (Perkin Elmer-USA, S# 8015050702) [27].
Extraction for the Estimation of Phytochemicals
1 g of the fresh wheat leaves was extracted three times with 30 mL of methanol (Sigma 70% purity). The solution was mixed using an orbital shaker (OS-208, Thermo Forma, 420-USA) and left overnight at room temperature. The supernatant obtained from each extract underwent three rounds of centrifugation at 3500 rpm for 15 minutes. Following centrifugation, the resultant supernatant was gathered and kept at a temperature of 4ºC. This prepared extract was then utilized for subsequent phytochemical analyses [28].
Total Phenolic Content (TPC)
For the estimation of TPC, the protocol was established by [29].1 mL of each extract was combined with 2 mL of Folin-Ciocalteu reagent and 4 mL of sodium carbonate (Na₂CO₃) at a concentration of 1.5 M. The mixture was briefly vortexed and left to incubate at room temperature for 1 hour. Following incubation, the absorbance was measured at 760 nm, and TPC was calculated using a standard curve. The final TPC values were expressed as milligrams of gallic acid equivalent per 100 grams on a fresh weight basis (mg GAE/100g, FW).
Total Flavonoid Content (TFC)
A modified colorimetric method [29] was used to determine TFC in wheat samples. Quercetin dihydrate standard stock solution (1000 µg/mL) was prepared in (10mg/100mL) ethanol. The standard curve was constructed by 10 folds of stock solutions. For estimation of TFC in samples, 0.5 mL of methanolic extract was diluted with 2.5 mL of distilled water, and 0.15 mL of sodium nitrite (7%) was added to the diluted solution. The mixture was blended for 6 min, and then 0.3 mL (10%) of aluminum chloride (AlCl3) solution and 1 mL of 1M sodium hydroxide (NaOH) were added to the solution. Finally, 0.55 mL of distilled water was added, and absorbance was measured at 510 nm. The results were expressed as mg quercetin equivalent/100 g on a fresh weight basis (mg QE/100g, FW).
Free Radical Scavenging Assay
The free radical scavenging activity of the methanolic extract was determined using a freshly prepared 0.2 mM solution of 2,2-diphenyl-1-picrylhydrazyl (DPPH) in ethanol. An equal amount of the methanolic extract of the plant was added to the DPPH solution and incubated for 30 mins at room temperature, and then the absorbance of the mixture was measured at 517 nm. The instrument used was a spectrophotometer (UV- 1100 China) [30]. The formula used for the calculation of DPPH activity is as follows, where A0 is blank and A1 is absorbance:
Hydroxyl Radical (OH-) Scavenging Assay
OH- radical scavenging activity was measured by mixing 2 mL of plant extract with 40 uL of 0.02 M ferrous sulfate (FeSO4), 2 mL of phosphate buffer (0.2 M each of NaH2PO4 and Na2HPO4, pH 7.2), and 1 mL of 0.04 M 1,10-phenanthroline. Then, 1 mL of H2O2 (7 mM) solution was added to begin Fenton’s reaction. Using a UV-Spectrophotometer (UV-1100-China), absorbance at 560 nm was measured, and OH- radical scavenging potential was calculated by the formula given below [31].
Ferric Ion Reducing Antioxidant Power (FRAP) Assay
The methanolic extract (2 mL) was mixed with 0.1% potassium ferricyanide in 0.2 M phosphate buffer (pH 6.6) and incubated at 50ºC for 20 min. Subsequently, 2 mL of trichloroacetic acid (TCA) at a concentration of 10%, along with 2 mL of the supernatant and 0.01% ferric chloride (FeCl3), were added to the solution and left for 20 min at room temperature. The absorbance was then measured at 700 nm using a UV-Spectrophotometer (UV-1100-China). The concentration of antioxidants with ferric ion reducing power was expressed as FRAP, equivalent per 100 grams based on the sample’s fresh weight (mg AAE/100 g FW), [31].
Phosphomolybdenum Complex Assay (PMC)
The determination of the total antioxidant capacity (TAC) of the samples was calculated using the PMC assay. Ascorbic acid (AA) served as the standard in the PMC assay, as described previously by [32]. A fresh reagent solution comprising 6.6 mL of 28 M sodium phosphate and 0.6 M sulfuric acid was mixed with 2 mL of each sample extract. Subsequently, 4 M ammonium molybdate was introduced into the solution, and the mixture was subjected to incubation in a water bath for 90 minutes at a temperature of 95ºC. Finally, absorbance was calculated at 695 nm in contrast to a blank. The results recorded were shown with ascorbic acid as mg of antioxidant activity per 100 g of fresh sample (mg AAE/100 g, FW).
Statistical Analysis
The data were analyzed by using one-way analysis of variance (ANOVA) and Tukey’s test, which were performed using the univariate general linear model, which yielded significant differences between means that were distributed normally and compared at p≤0.05. These differences were labeled using small letters that were positioned at the top of each bar. The data are presented as the means±standard errors (SE). SPSS, the Statistical Package for the Social Sciences, version 23.0, was used to analyze the data.
Table 1.
Analysis of the soil samples collected from selected fields of the Mardan district.
Results
Characterization of the Soil of the Experimental Area
The EC of the topsoil (0-15 cm) was recorded at 8.9 dS m-1, which was 18.6% higher as compared to the subsoil (15-30 cm) with 7.5 dS m-1. The pH was more alkaline in topsoil (8.11) than in subsoil (7.83). The values of SSP and SAR were 37%, and 8.5 (mmolc L-1)1/2, respectively in the topsoil, compared to 34% and 8.26 (mmolc L-1)1/2, respectively, in the subsoil. The texture of the soil was characterized as clay. A higher concentration of Na+ was found in topsoil (0-15 cm), with 266 g kg-1, while in subsoil (15-30 cm) the concentration of Na+ was 180 g kg-1. The concentration of K+ was found to be higher in topsoil (53.9 g kg-1) than in subsoil (34.3 g kg-1). The concentration of Mg2+ was observed at 13.7 g kg-1 at a depth of 0-15 cm, and in the subsoil, the concentration of Mg2+ was 11.3 g kg-1. The concentration of Ca2+ was found at 86.6 g kg-1 and 58.9 g kg-1 in topsoil and subsoil, respectively (Table 1). Analysis of water used for irrigation revealed a pH of 7.73 and EC as 1.14 dS m-1, while SAR was 12 (mmolc L-1)1/2 and RSC as 3.17 mmolc L-1 (Table 2).
Agronomic Parameters in Response to Soil Amendments
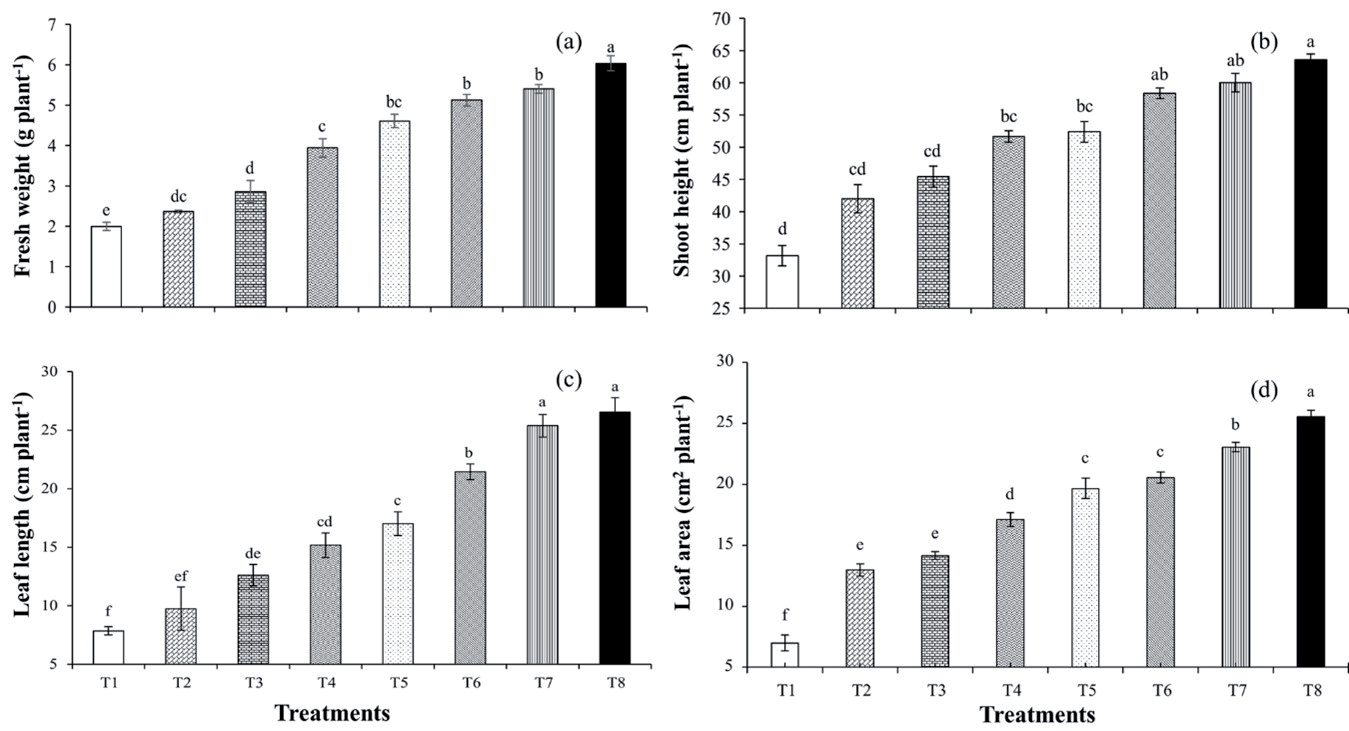
The maximum fresh biomass (6.03 g) was found in T8 (i.e., gypsum+farmyardmanure+ridges), and the least fresh biomass was observed in T1 (control), which was 1.99 g. When the fresh biomass of T1 was compared with other treatments, there was an increase of 18.7%, 43.5%, 98.1%, 131%, 157%, 171%, and 203% in treatments T2, T3, T4, T5, T6, T7, and T8, respectively (Fig. 1a). Treatments with a combination of two reclamation approaches (T5, T6, and T7) showed significant improvements in wheat fresh biomass as compared to alone amendments (T2, and T3).
Table 2.
Analysis of the water samples collected from Mardan.
| Parameters | Concentrations |
|---|---|
| pH | 7.73±0.28 |
| EC (dS m-1) | 1.14±0.69 |
| Ca2++Mg2+ (mM) | 5.61±3.18 |
| Na+ (mM) | 16.8±2.69 |
| CO32- (mM) | 5.15±1.45 |
| HCO3- (mM) | 7.45±1.1 |
| SAR (mmolc/L-1)1/2 | 12±2.46 |
| RSC (mmolc/L1)1/2 | 3.17±1.73 |
However, when compared to shoot height of wheat in treatment T1, there was a 26.6%, 37.1%, 55.7%, 58.1%, 76.1%, 81.1%, and 91.9% increase in treatments T2, T3, T4, T5, T6, T7, and T8, respectively (Fig. 1b). Among the alone reclamation treatments, the treatment with gypsum (T4) showed the highest shoot height compared to ridges (T2) and farmyard manure (T3). Moreover, treatments with two reclamation approaches, i.e., T5, T6, and T7, resulted in improved shoot height, especially in treatments with gypsum addition (Fig. 1b). Our findings related to the leaf length of wheat showed that, compared to treatment T1, all other treatments except T2 showed a significant increase under saline conditions. Moreover, when compared to treatment T1, the increase in leaf length in wheat in treatments T2, T3, T4, T5, T6, T7, and T8 was 24.1%, 60.5%, 93.1%, 116%, 173%, 223%, and 238%, respectively (Fig. 1c). Alone reclamation treatment with gypsum (T4) resulted in maximum leaf length compared to ridges (T2) and farmyard manure (T3). However, treatments with two reclamation approaches, i.e., T5, T6, and T7, resulted in significantly increased leaf length in treatment T7 with the addition of gypsum and farmyard manure. Findings related to leaf area suggested that treatment T8 (i.e., gypsum+farmyardmanure+ridges) resulted in a significant maximum leaf area (25.5 cm2) compared to all other treatments (Fig. 1d). In comparison to treatment T1 (control), there was an increase in leaf area by 85.3%, 102%, 144%, 181%, 193%, 229%, and 264% in treatments T2, T3, T4, T5, T6, T7, and T8, respectively (Fig. 1d). Treatment T4 with gypsum addition showed significantly higher leaf area compared to treatments with ridges (T2) and farmyard manure (T3). However, the comparison of combined treatments, i.e., T5, T6, and T7, exhibited maximum leaf area in treatment T7 with the addition of gypsum and farmyard manure combined.
Photosynthetic Parameters in Response to Soil Amendments
In comparison to the estimated chlorophyll contents of wheat in treatment T1 (control), there was an increase of 6.41%, 9.15%, 15.6%, 20.3%, 31.2%, 37.3%, and 45.1% in treatments T2, T3, T4, T5, T6, T7, and T8, respectively, with a maximum of 58.2 SPAD units in T8 (i.e., gypsum+farmyardmanure+ridges) and the least in treatment T1 (40.1 SPAD units) (Fig. 2a). When we compared the treatments alone, the treatment with gypsum (T4) showed the highest estimated chlorophyll contents compared to ridges (T2) and farmyard manure (T3). However, among the two reclamation approaches such as T5, T6, and T7, treatment T7 with the addition of gypsum and farmyard manure together resulted in maximum chlorophyll contents. In comparison to total protein contents in wheat in treatment T1 (control), there was an increase of 35.1%, 97.2%, 155%, 192%, 197%, 203%, and 230% in treatments T2, T3, T4, T5, T6, T7, and T8, respectively, with a maximum of 7.8 mg g-1 in T8 (i.e., gypsum+farmyardmanure+ridges) and the least in treatment T1 (2.6 mg g-1) (Fig. 2b). However, alone reclamation treatment with gypsum (T4) showed maximum total protein contents compared to ridges (T2) and farmyard manure (T3). Treatments with a combination of two reclamation approaches (T5, T6, and T7) presented significant improvements in total protein contents compared to the alone amendments T2, and T3 (Fig. 2b).
Fig. 1.
. Changes in fresh shoot biomass (g plant-1) a), shoot height (cm plant-1) b), leaf length (cm) c), leaf area (cm2) d) of wheat plants under the influence of various treatments T1; control, T2; ridges, T3; farmyard manure, T4; gypsum, T5; farmyard manure+ridges, T6; gypsum+ridges, T7; farmyard manure+gypsum, and T8; gypsum+farmyardmanure+ridges in the saline field of Mardan. Means were calculated from replicates (n≥5). Bars on the column indicate standard errors (±SE) and letters represent significant differences between treatments which were analyzed by using ANOVA followed by the Tukey test at p≤0.05.
Ionic Changes in Wheat in Response to Soil Amendments
In comparison to Na+ concentration in wheat in treatment T1 (control), there was a significant decrease of 35.3%, 45.7%, 43.2%, 55.6%, 55.9%, 53.4%, and 66.6% in treatments T2, T3, T4, T5, T6, T7, and T8, respectively, with the lowest 8.76 mg g-1 DW in T8 (i.e., gypsum+farmyardmanure+ridges) and the maximum in treatment T1 (26.2 mg g-1 DW) (Fig. 3a). Moreover, in treatment T8, Na+ concentration was significantly lowered when compared to treatments with one reclamation approach (i.e., T2, T3, and T4). In comparison to treatments with one reclamation approach (i.e., T2, T3, and T4), treatments with two reclamation strategies (i.e., T5, T6, and T7) resulted in reduced Na+ concentration in wheat plants (Fig. 3a). Findings related to K+ concentration in shoots suggested that treatment T8 (i.e., gypsum+farmyardmanure+ridges) exhibited a significantly maximum K+ concentration (68.9 mg g-1 DW) when compared to all other treatments (Fig. 3b). When we compared treatments with the alone reclamation approach, i.e., T2, T3, and T4, treatment with gypsum (T4) resulted in a maximum K+ concentration compared to ridges (T2) and farmyard manure (T3). However, treatments with two reclamation approaches, i.e., T5, T6, and T7, resulted in higher K+ concentrations compared to treatments with alone reclamation approaches, i.e., T2, T3, and T4 (Fig. 3b). A significant maximum Mg2+ concentration (38.1 mg g-1 DW) was observed in T8 when compared to other treatments. Mg2+ concentration was significantly higher in treatments T3 and T4 in comparison to treatment T2 when we compared treatments with the alone reclamation approach. Moreover, treatment T6 presented the maximum Mg2+ concentration when we compared it to treatments with two reclamation approaches (i.e., T5, T6, and T7) (Fig. 3c). Findings related to Ca2+ concentration revealed that in comparison to treatment T1 (control), there was a significant increase of 24.1%, 76.4%, 93.4%, 105%, 137%, and 179% in treatments T3, T4, T5, T6, T7, and T8, respectively.
Fig. 2.
Chlorophyll contents (SPAD units plant-1) a), total protein contents (mg g-1 plant-1 b) in wheat plants under various treatments T1; control, T2; ridges, T3; farmyard manure, T4; gypsum, T5; farmyard manure+ridges, T6; gypsum+ridges, T7; farmyard manure+gypsum, and T8; gypsum+farmyardmanure+ridges in the saline field of Mardan. Means were calculated from replicates (n≥5). Bars on the column indicate standard errors (±SE) and letters represent significant differences between various treatments which were analyzed by using ANOVA followed by the Tukey test at p≤0.05.
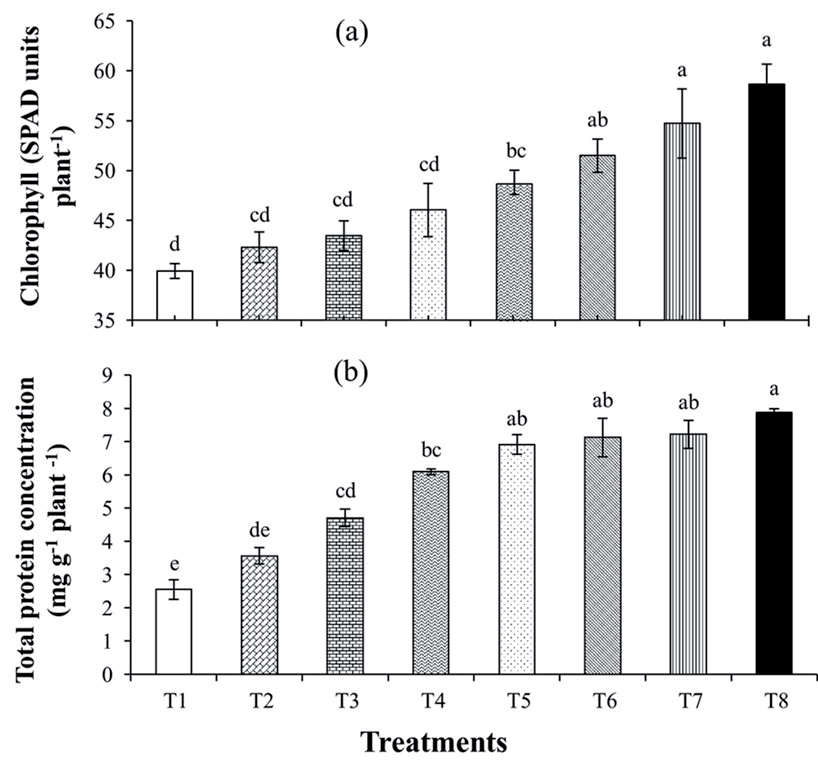
Fig. 3.
Ionic content (mg g-1 DW) of Na+ concentration a), K+ concentration b), Mg2+ concentration c) and Ca2+ concentration d) in wheat plants under various treatments T1; control, T2; ridges, T3; farmyard manure, T4; gypsum, T5; farmyard manure+ridges, T6; gypsum+ridges, T7; farmyard manure+gypsum, and T8; gypsum+farmyardmanure+ridges in the saline field of Mardan. Means were calculated from replicates (n≥5). Bars on the column indicate standard errors (±SE) and letters represent significant differences between various treatments which were analyzed by using ANOVA followed by the Tukey test at p≤0.05.
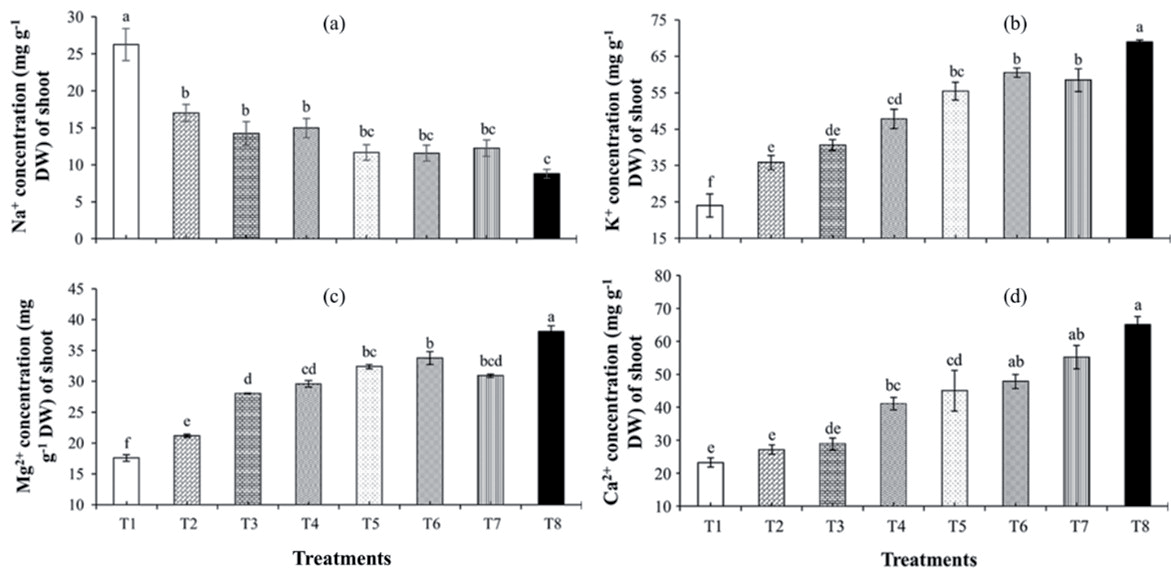
Fig. 4.
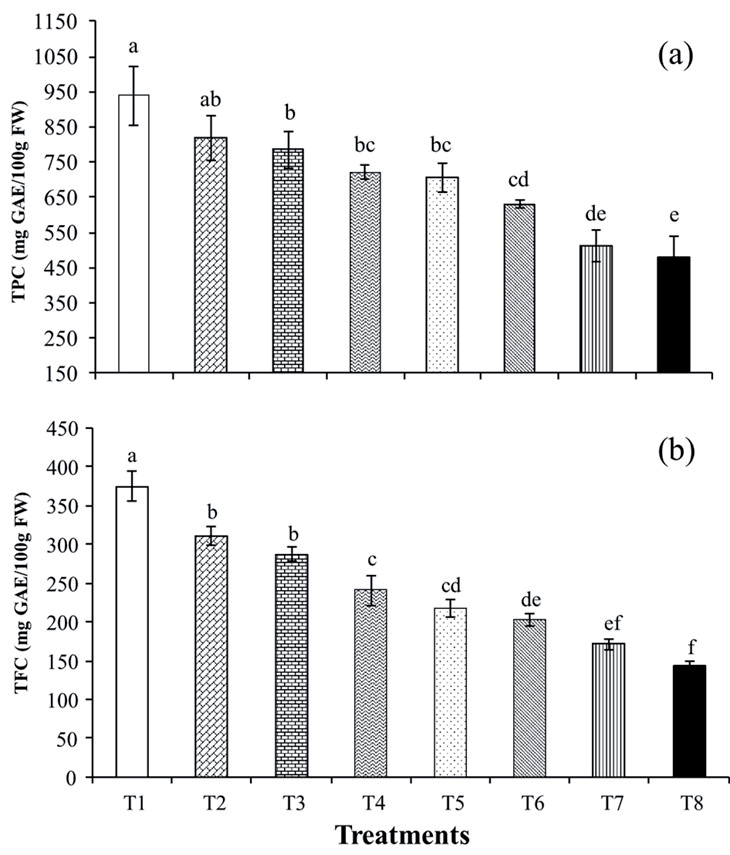
Total phenolic contents (TPC) a), and total flavonoid content (TFC) b) (mg GAE/100g FW) of wheat plants under various treatments T1; control, T2; ridges, T3; farmyard manure, T4; gypsum, T5; farmyard manure+ridges, T6; gypsum+ridges, T7; farmyard manure+gypsum, and T8; gypsum+farmyardmanure+ridges in the saline field of Mardan. Means were calculated from replicates (n≥5). Bars on the column indicate standard errors (±SE) and letters represent significant differences between various treatments which were analyzed by using ANOVA followed by the Tukey test at p≤0.05.
Antioxidant Response of Wheat by Soil Amendments
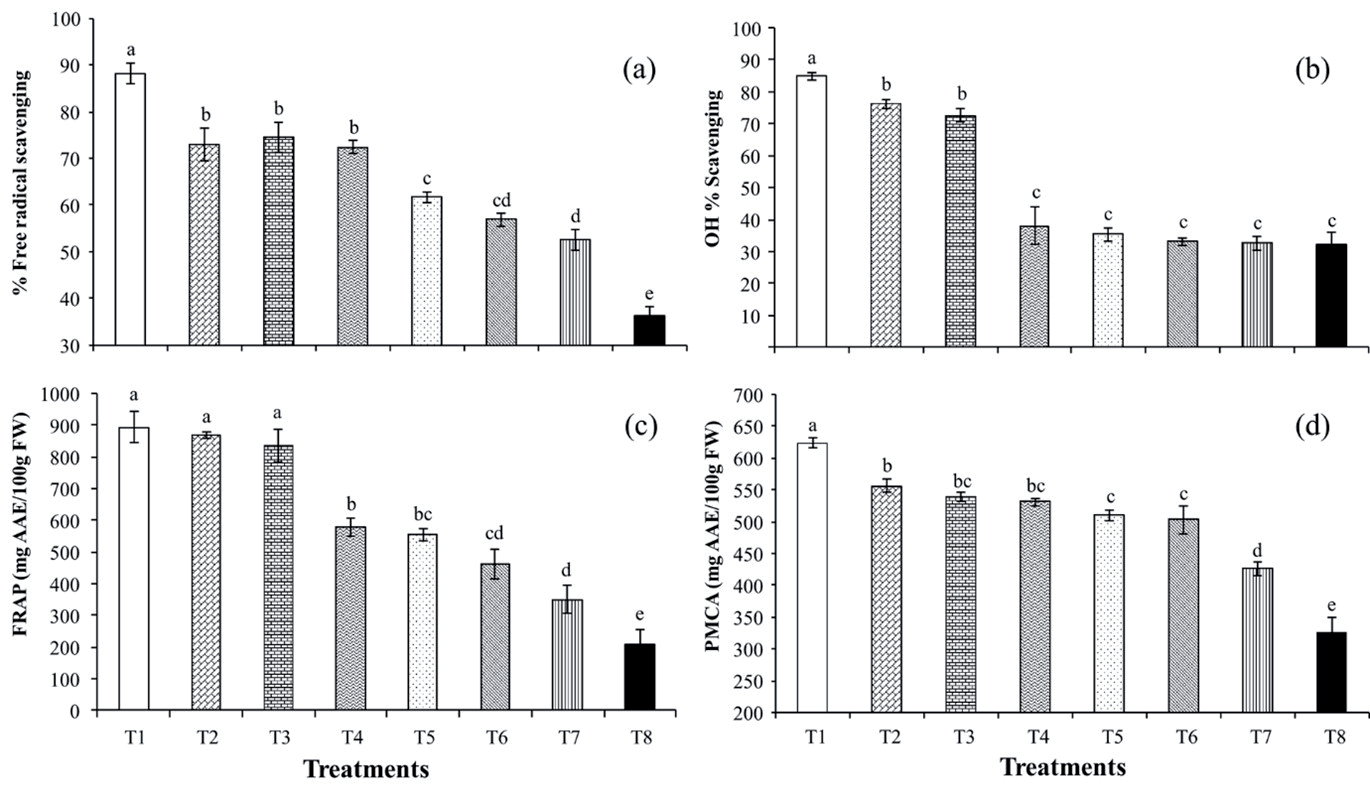
Saline soil enhanced the total phenolic contents (TPC) significantly in the control plants (914.65±1.2 mg GE/100g FW) as compared to all other treatments except T2, which demonstrated the second highest concentration (888.7±2.6 mg GE/100g FW). However, the combination of three amendments (T8) yielded the lowest TPC (338.7±3.8 mg GAE/100g FW) (Fig. 4a). The highest average level of total flavonoid contents (TFC) was observed in the control (T1) (407.4±19.2 mg QE/100g FW). TFC was found to be lower in the combination of three amendments (T8) (41.9±18.4 mg QE/100g FW) than in the rest of the treatments (Fig. 4b). The percentage of free radical scavenging activity (90.69%), hydroxyl radical scavenging (OH-) (85%), ferric-reducing antioxidant power (FRAP) (891±49.3 mg AAE/100g FW) and phosphomolybdenum complex (PMC) assay (665.4±1.2 mg AAE/100g FW) were found significantly maximum except FRAP compared to all other treatments i.e., T2, T3, T4, T5, T6, T7 and T8, in wheat plant under salinity stress in treatment T1 (i.e., control) (Fig. 5); however, the minimum inhibition potential was determined in the T8 (i.e., gypsum+farmyardmanure+ridges).
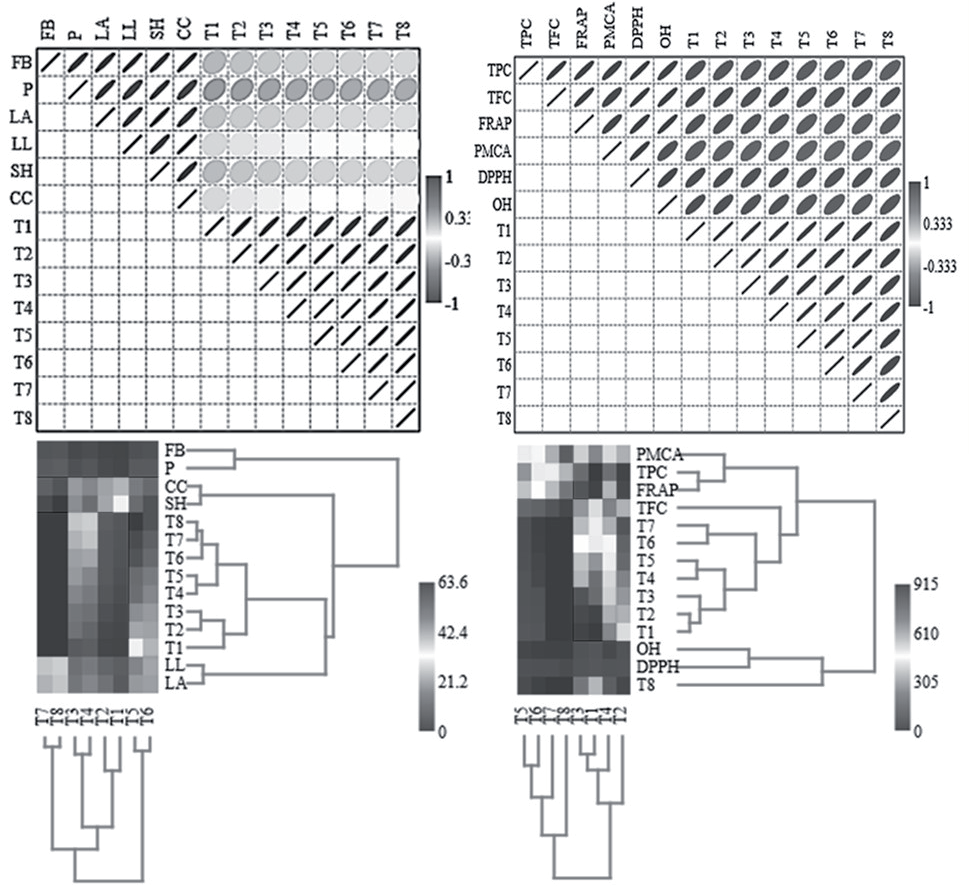
Pearson correlation analysis (PCA) revealed a significantly strong positive association between all the treatments and secondary metabolites, antioxidants, and growth parameters in wheat (Fig. 6). Shoot height, fresh biomass, leaf length, leaf area, proteins, and chlorophyll contents were most sensitive to salt stress and showed a positive correlation by increasing the amendments. Total phenolic and flavonoids content, ferric and molybdate ion reduction, DPPH, and hydroxyl scavengers in wheat depicted positive associations in descending order (i.e., 80.6%, 86.9%, 82.2%, 73%, 86%, and 84.5% in T1 and 71.4%, 81.2%, 73.4%, 68.1%, 79.3%, and 78.5% in T8). The results of cluster (C) analysis, which was carried out to determine relatively homogeneous groups of the studied samples based on the amendments with growth parameters, TPC, TFC, and antioxidant activities, are shown in Fig. (6), and all the studied samples were classified into three main clusters, each comprising eight amendments (T1 to T8). These clusters were further divided into subgroups where fresh biomass and proteins cluster with each other in C1. Chlorophyll content and shoot height are comprised in C2 on the basis of homogeneity. A similar trend was shown by leaf area with leaf length: (T1, T2, T3), (T4, T5), and (T6, T7, T8) encompass a third cluster with no significant variation and are closely placed in subgroups. When we analyzed secondary metabolites and antioxidants, there were two main clusters in which TPC, TFC, PMCA, and FRAP were grouped separately in the first cluster within the sub-clustering of TI to T7 due to a substantial variation; however, the second cluster contained OH, DPPH, and T8 with the least amount of variation (Fig. 6).
Fig. 5.
Antioxidants potential DPPH; 2,2-diphenyl-1-picrylhydrazyl a), OH; hydroxyl radical b) FRAP; ferric ion reducing antioxidant power c), PMCA; phosphomolybdenum complex assay d) in wheat plants under various treatments T1; control, T2; ridges, T3; farmyard manure, T4; gypsum, T5; farmyard manure+ridges, T6; gypsum+ridges, T7; farmyard manure+gypsum, and T8; gypsum+farmyardmanure+ridges in the saline field of Mardan. Means were calculated from replicates (n≥5). Bars on the column indicate standard errors (±SE) and letters represent significant differences between various treatments which were analyzed by using ANOVA followed by the Tukey test at p≤0.05.
Discussion
Plant growth is a key indicator of a plant’s response to different environmental stresses. Increasing salinity is generally associated with a decrease in growth parameters, such as shoot height, plant biomass, chlorophyll content, and root length [33]. The initial phase of salt stress is associated with a reduction in external water potential, which limits the plant’s ability to extract water from the rhizosphere under saline conditions [34]. Decreased turgor pressure results in an immediate reduction in the expansion of shoot cells [10]. Moreover, the osmotic stress induced by salinity disrupts several physiological and biochemical activities occurring in the cell, e.g., photosynthesis, which ultimately limits plant growth [35]. As in the present study with wheat, several reports showed compromised growth in response to salinity in different plants such as rice and maize [36]. However, the measured growth parameters, i.e., fresh and dry biomass, shoot and leaf length, leaf area, and chlorophyll content, in the current study were improved in plants grown on soils with amendments. Among the single amendments, i.e., the formation of ridges, the addition of farmyard manure, and the addition of gypsum, the latter proved significantly effective in promoting the growth parameters in the present case. These findings corroborate many earlier studies that gypsum application restores soil aggregates, water, and air permeability as a result of increased infiltration rate and decreased surface crusting. However, the addition of different amendments together can significantly improve soil properties, which can ultimately increase plant growth and yield. In the current study, the application of two amendments simultaneously promoted better plant growth compared to single amendments. An earlier investigation in which more than one soil amendment (i.e., straw compost and gypsum) was applied resulted in improved plant growth parameters in tomato plants [37], compared to plants grown on straw compost or gypsum alone, suggesting that no treatment alone is as effective as the combination of two or more [38]. Integrated soil amendments may be attributed to the synergistic effect of individual factors, i.e., ridges, farmyard manure, and gypsum [39]. which can alter the physical and chemical properties of the soil [40]. Therefore, the increase in plant growth may be ascribed to better soil characteristics with minimal uptake of the salts, which in turn can alleviate the salt stress [41].
Fig. 6.
Correlation and cluster analysis between different amendments, phenolic, antioxidants, and growth parameters in wheat. T1; control, T2; ridges, T3; farmyard manure, T4; gypsum, T5; farmyard manure+ridges, T6; gypsum+ridges, T7; farmyard manure+gypsum, and T8; gypsum+farmyard manure+ridges, FB; fresh biomass, P; protiens, LA; leaf area, LL; leaf length, SH; shoot height, CC; chlorophyll content, TPC; total phenolic content, TFC; total flavonoid content; FRAP; ferric ion reducing antioxidant power, PMCA; phosphomolybdenum complex assay, DPPH; 2,2-diphenyl-1-picrylhydrazyl, OH; hydroxyl radical.
Saline soils are abundant with Na+ salt, whereas the relative concentration of salts in other macronutrients such as K+, Ca2+, and Mg2+ is often low and competes with Na+ for their uptake by the plant [42]. The present study recorded the highest Na+ concentration in the control plants, whereas the integrated treatment with gypsum, ridges, and farmyard manure resulted in the lowest concentration (Fig. 3). The reduction in Na+ content in treated plants can be attributed to the amendments of gypsum, ridges, and farmyard manure. Gypsum, known for its calcium and sulfur content, has been reported to mitigate salt-induced nutritional imbalances by displacing excess Na+ at exchangeable sites in the soil. These findings correlate with an earlier study [16], which recommends raised beds as the best planting method because they hold the least salinity compared to the top and bottom of the soil. Similarly, organic matter and manure are extensively documented to diminish the level of exchangeable Na+ in the soil by enhancing salt leaching and water infiltration [43]. The increase in K+ concentration in treatments employing integrated physical and chemical approaches may be attributed to reduced competition between Na+ and K+ at the root surface. Additionally, the decrease in soil pH due to chemical amendments may contribute to the enhanced uptake of K+ from the soil [44]. The K+/Na+ ratio is identified as a crucial determinant of cellular toxicity levels. Interestingly, Ca2+ levels also regulate K+ concentration in plants; for instance, it has been reported that the application of calcium salt retained K+ in the cell [45]. Moreover, Ca2+ shields the cell membrane against the harmful effects of salinity by competing with Na+ for binding sites on the membrane [46]. Mg2+ plays the main role in photosynthesis, and it is needed for the synthesis of chlorophyll and was significantly higher in T8 when compared to all other treatments [47].
The current study revealed that treatment T8, i.e., ridges, farmyard manure, and gypsum, presented a higher potential for total phenolic content, total flavonoid content, and antioxidant activity compared to the control plants under salinity. To the best of our knowledge, this is the first report showing TPC, TFC, and antioxidant levels in the wheat plant grown on salt-affected soil with integrated amendments studied. The growth parameters, secondary metabolites, phytochemicals, and antioxidant potential of plants were improved by organic and inorganic practices [48]. Wheat plants use a variety of physiological, biochemical, and molecular mechanisms to adapt to salinity stress at the cell, tissue, and whole plant levels to maximize growth and yield by counteracting the negative effects of saline soil [2]. Recently, several antioxidants, including enzymatic and non-enzymatic, have been studied to prevent oxidative damage in higher plants by scavenging reactive oxygen species (ROS). Our findings with improved wheat growth along with integrated amendments suggest that the physiological as well as biochemical activities in plants might have been rehabilitated with the given amendments, especially with treatment T8, in comparison to the control which had the most detrimental effects on the growth of wheat [49].
Conclusion
In conclusion, salinity stress significantly hampers plant growth parameters. Gypsum emerges as a superior single amendment compared to other alone amendments and improves wheat growth under salt stress. Simultaneous application of two amendments demonstrated synergistic effects, promoting superior plant growth compared to individual treatments. However, the integrated approach significantly reduced Na+ concentrations in wheat, and along with this, the decrease in K+, Ca2+, and Mg2+ concentrations due to salinity stress was remedied, ultimately improving plant growth. Additionally, the integrated approach exhibited the lowest phytochemical contents (i.e., total phenolic and flavonoid content, ferric and molybdate ion reduction, DPPH, and hydroxyl scavengers) in wheat, suggesting a positive correlation with growth. This comprehensive analysis supports the potential of integrated soil amendments in mitigating salt stress and improving wheat production, emphasizing the need for sustainable practices to ensure food security in the face of salinity-induced challenges.

