

Introduction
Soil salinity is a major type of abiotic stress that limits crop productivity and affects plant growth and development. Salinity has degraded millions of hectares worldwide, seriously threatening food production in a third of the world’s arable land [1]. The detrimental effects of water, salt, and drought stress on maize growth and yield have intensified in recent years, with salt stress, in particular, causing substantial damage and resulting in significant losses. Therefore, there is a need to explore strategies for improving maize salt tolerance.
Salinity induces three primary types of plant stresses - osmotic stress, ionic stress, and oxidative stress [2], primarily mediated by the accumulation of Na+ in cells. The low K+/Na+ ratio ion imbalances inhibit plant growth. Plants employ various gene expression evolution mechanisms to adapt to salinity-induced stress [3], regulating critical biological processes, including signal transduction, energy metabolism, transcription, protein biosynthesis, membrane trafficking, and photosynthesis [4-7]. Plant responses to salt stress could be shaped by gene regulation. In addition to the known salinity tolerance genes (e.g., HKT1, SOS members, DREB2, APX, GR, GST), certain small proteins, such as the HSPs, enhance plant salt resistance [8, 9]. Notably, genes mediate salinity resistance in different ways. Physiological and transcriptomic analyses [10- 13] have been utilized to analyze how plants cope with abiotic stresses. Although transcriptome sequencing is a powerful method for identifying novel transcripts and analyzing gene expression, this approach alone is not enough. Also, plant transgene is a good choice for varying candidate genes.
In this present study, we identified the distinct gene expression patterns in response to salt stress in the salt-tolerant and salt-sensitive maize using transcriptome data. The differentially expressed genes (DEGs) between the salt-tolerant and salt-sensitive varieties were identified and analyzed. The role of potentially salinity-related genes in maize was validated in tobacco. Our findings provide new knowledge on plant physiology under stress, especially the physiological mechanism of salt tolerance.
Materials and Methods
Plant Culture and Salt Stress Treatment
Salt-tolerant maize variety 8723 (designated as Tol) and salt-sensitive maize variety P138 (designated as Sens) were utilized in a study to investigate the mechanisms underlying salt tolerance in maize [14]. The seeds were sourced from the maize seed bank at Gansu Agricultural University. Seeds of the respective maize varieties were cultivated in solutions containing 0, 100, 200, and 300 mM NaCl to assess their salt resistance capabilities. The germination rate (GR), germination potential (GP), and germination index (GI) were evaluated after a five-day germination period following established protocols [15]. The 8723 and P138 maize inbred lines were then treated with 0, 100, 200, and 300 mM NaCl solutions. The experiment was performed in the greenhouse at 25±2ºC, 12/112 h light, and dark cycle under 60% relative humidity. NaCl solution was added every three days after the plants in control grew to the three-leaf stage (about seven days). The flag leaf of each plant was collected and preserved at −80ºC in liquid nitrogen till further analysis.
Determination of Antioxidant Enzymatic Activity
The level of antioxidant enzymes in flag leaf plant extracts was analyzed as described by Ahmad et al. [16]. Briefly, flag leaves were frozen in liquid nitrogen and then homogenized on ice using 10 mL of 50 mM phosphate buffer (pH 7.8). Following centrifugation at 4,000g for 15 minutes at 4ºC, the resulting supernatant was collected for the determination of enzyme activities. The activities of malondialdehyde (MDA), superoxide dismutase (SOD), catalase (CAT), and peroxidase (POD) were assessed using specific kits (kit Numbers: A003-1, A001-1, A007-1, A084-3, respectively) from Nanjing Jiancheng Bioengineering Institute, China, in accordance with the manufacturer’s instructions [17].
Transcriptome Analysis
The optimal concentration of salt treatment for transcriptome analysis was selected based on the germination and antioxidant enzyme results. The total RNA of the flag leaves was extracted using a commercial kit (Takara, Dalian, China). Then, the purified total RNA was used to construct the sequence library. The mDNA sequence library was constructed using the NEBNext Ultra RNA Library Prep Kit for Illumina, following the manufacturer’s instructions. A total of 12 samples (triplicates per group) were used for library construction (i.e., 8723-CK, 8723-T, P138-CK, and P138-T). Sequencing was then performed using an Illumina HiSeq X10 platform.
The raw sequence data were analyzed using the FastQC software (http://www.bioinformatics.babraham. ac.uk/projects/fastqc/) under default parameters. The clean sequence data were mapped to the maize genome downloaded from the Maize Genome Database (MaizeGDB; https://www.maizegdb.org/). The reference genome was converted into an index using HISAT2 software and an improved Burrows–Wheeler transform (BWT) algorithm. Then, the gene expression level was determined based on fragments per kilobase per million bases (FPKM). Read counts data were normalized using TMM method, and p-value was calculated with the Poisson distribution model. The FDR (false discovery rate) is determined by p-value ranges in multiple tests. In this study, the threshold of |log2FC (fold change)| > 2 with q-value < 0.01 was selected as simulated biological variation to determine whether a gene has significantly differential expression in the DEGseq2 analysis [18]. GO classification (GO database, http://www.geneontology. org.) and KEGG pathway (KEGG database, http:// www.genome.jp/kegg/) methods were carried out for allocating genes to different functional categories and predicting their biological functions, respectively. The KEGG pathway enrichment and GO enrichment analysis were performed with the condition of corrected p value < 0.05 [19].
Subcellular Localization of Salt Stress-Related Protein
In order to ascertain the subcellular localization of a potential stress-related protein, constructs containing the 35S gene-GFP and 35S-GFP vectors were generated and introduced into tobacco epidermal cells through injection, following established protocols [20]. The fluorescence signals in the inner epidermal cells were observed using a confocal laser scanning microscope.
Construction of Tobacco Lines Overexpressing the Salt-Tolerant Gene
The full-length RNA of the potentially salt-related gene was reverse transcribed into the cDNA. Overexpression of salt-related genes in tobacco (Nicotiana tabacum) was induced through leaf disk transformation with Agrobacterium. The full-length cDNA of the salt-related gene was cloned into the modified binary vector pMV (derived from pBI121 vector) to form the pMV-EsFLS construct under the control of the CaMV 35S promoter. The plasmids were electroporated into Agrobacterium tumefaciens strain EHA105. Tobacco immature embryos (IEs) of 1.5 to 2.0 mm were isolated from ears harvested 10 d after pollination into 2.0 mL tubes with 1.8 mL inoculation medium and were infected with Agrobacterium suspension (inoculation medium with 200 μM of acetosyringone and Agrobacterium cells) for 5 min, then poured onto co-cultivation medium. Kanamycin (100 μg/mL) resistance was used as the marker to select the transformed plants, whereas the presence of the exogenous transgene was detected using PCR. Three transgenic tobacco plants overexpressing the salt-related gene were salt tolerant. Transgenic tobacco plants overexpressing empty pMV were used as the negative control.
Development of Transgenic Tobacco
For the germination assay, 25 seeds (per repeat) of transgenic salt-tolerant and WT tobaccos were surface sterilized using Xyz and placed on Petri plates containing 1/2 strength Murashige and Skoog (MS) basal medium supplemented with 0 and 50 mM NaCl, respectively. The Petri plates were kept in a growth chamber at 25ºC under a 16 h photoperiod for 7 days. The germination rates were recorded every day after sowing for 7 days. For root length measurements, germinated seeds were supplied with the same nutrients and grown at 0, 150, 175, and 200 mM NaCl stress for one additional week. The root length was measured after 14 days, separately from each experiment. The fresh weight of tobacco seedlings was also measured. In addition, the leaf MDA, SOD, POD, and CAT content were analyzed as described in the preceding sections.
qRT-PCR Analysis
For qPCR analysis, a 20 μl reaction volume was employed, consisting of 1 μl of cDNA template, 0.6 μl each of reverse and forward primers, 7.4 μl of ddH2O, 0.4 μl of ROX, and 10 μl of the PCR master mix from Thermo Fisher Scientific (Waltham, MA, USA). Amplification was carried out in the ABI 7500 system, following the specified conditions: initial denaturation for 30 s at 95ºC, subsequent denaturation through 40 cycles for 5 s at 95ºC, and annealing at 60ºC for 30 s. All reactions, including control reactions, were performed in triplicate to ensure accuracy. The DNA quantity was determined using the 2-ΔΔCt method.
Statistical Analyses
Data were analyzed using the SPSS software, version 15.0 (SPSS, Inc., Chicago, IL, United States). Differences between groups were analyzed using the Student’s t-test. Statistical significance was set at P<0.05. Continuous normally distributed variables were expressed at mean± the Standard Deviation (SD).
Results and Discussion
Effects of Salt Stress on Germination
Salinity exerted a notable reduction in the germination rate of maize seeds, with the inhibitory impact of salt stress being more pronounced in the inbred maize line P138 compared to the inbred line 8723, as detailed in Table 1. No significant disparity in germination rates was observed between the inbred lines under non-stress conditions. Also, there was no significant difference in GR and GP of 8723 at 100 and 200 mM NaCl. However, the GR and GP of 8723 were significantly higher and lower at 100 and 200 mM NaCl than at 300 mM NaCl and under non-stress conditions, respectively. Conversely, for the P138 line, the GR, GP, and GI decreased significantly with an increase in salinity. As expected, the GR and GP of 8723 were significantly higher than P138 under the same salinity but not under non-saline conditions. The GI of both 8723 and P138 decreased significantly at high salinity.
Table 1.
Effects of the salt stress on germination characteristics.
Efffects of Salt Stress on MDA, SOD, POD, and CAT Activities
MDA contents were higher in Sens than in Tol under all salinity levels. The MDA activity increased with salinity in both maize cultivars (Fig. 1 A). However, the activities of SOD, POD, and CAT reduced with salinity level (Fig. 1 B, C, and D).
Transcriptome Differences in Response to Salt Stress Between Two Maize Inbred Lines
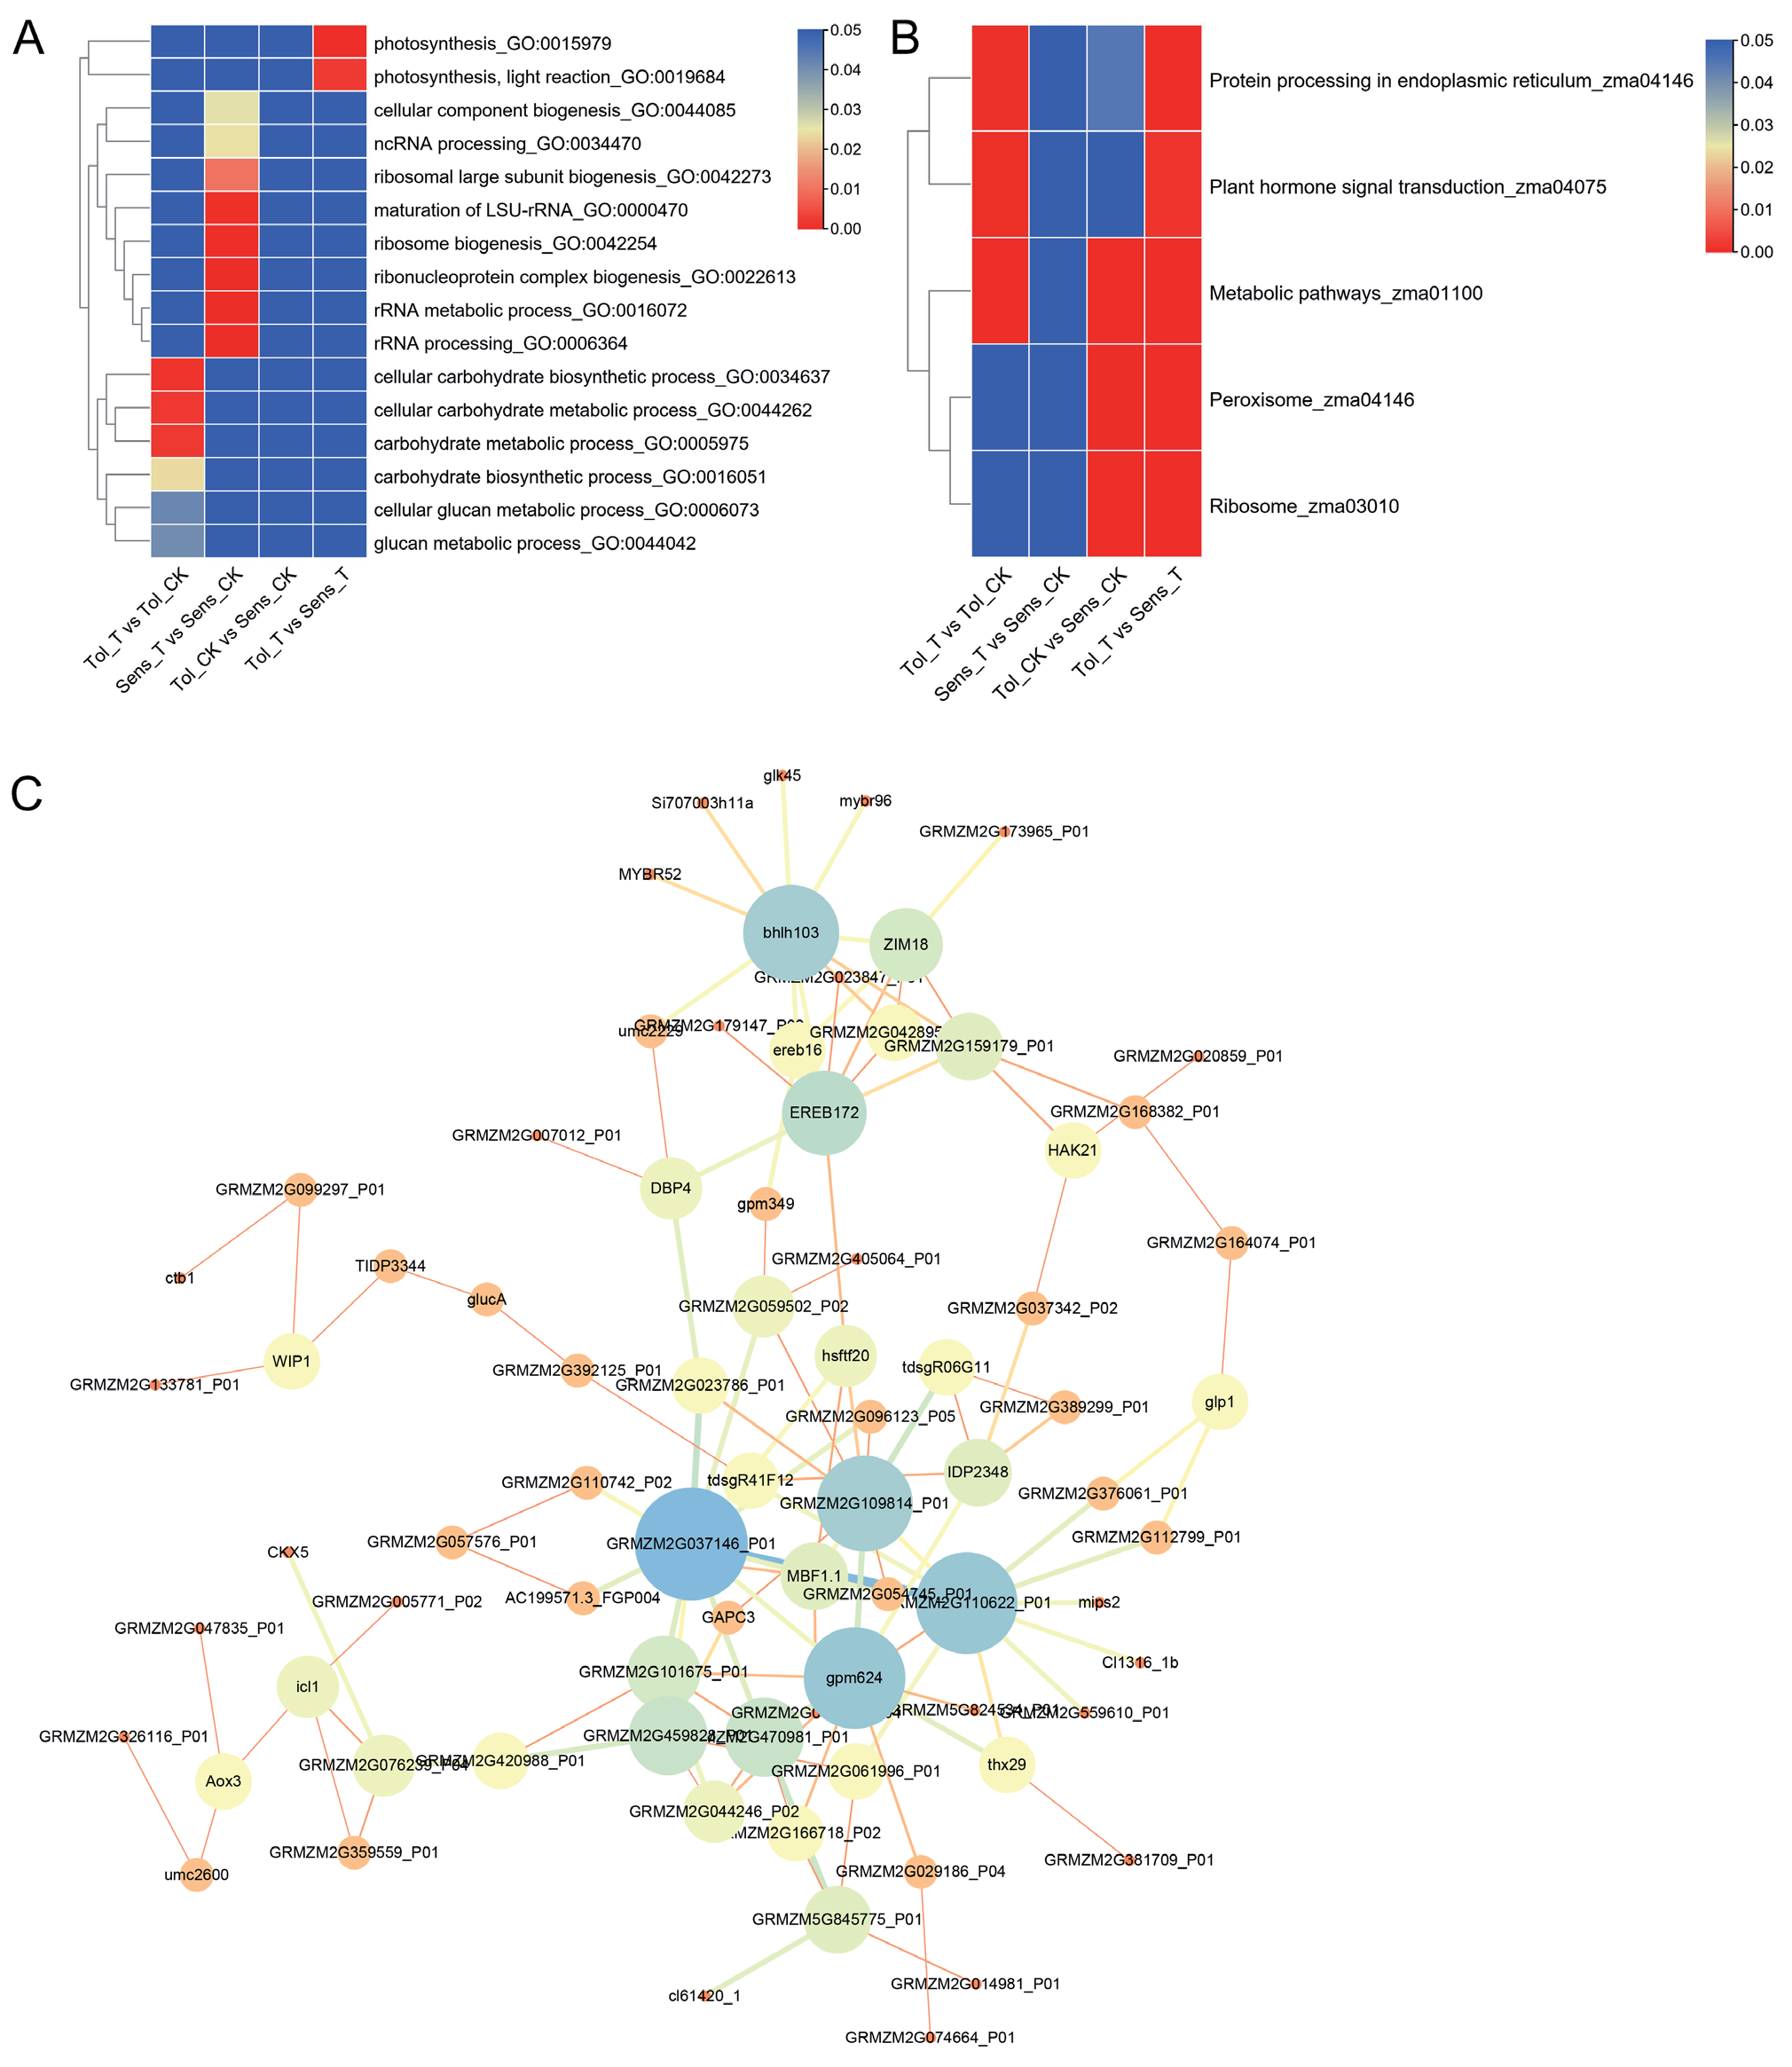
RNA-seq generated between 47,213,066 and 77,151,924 clean reads for each library. The average percentage of Q20 and Q30 is 99.71% and 94.32, respectively (Table 2). Totally, 20,579 DEGs were identified in four comparisons: Tol-T vs. Tol-CK (2,239 up-regulated and 2,502 down-regulated), Sens-T vs. Sens-CK (5,921 up-regulated and 5,586 down-regulated), Tol-CK vs. Sens-CK (5,371 up-regulated and 4,676 down-regulated) and Tol-T vs. Sens-T (7,137 up-regulated and 6,920 down-regulated). GO and KEGG enrichment analyses were performed with all DEGs to further explore their functions. The GO enrichment results showed that, between T and CK, many up-regulated DEGs in Tol plants were enriched in “carbohydrate metabolic process” and “carbohydrate biosynthetic process”; lots of down-regulated DEGs (compared with CK) in Sens plants were enriched in “ribonucleoprotein complex biogenesis” and “photosynthesis” terms, when. Additionally, DEGs in Tol-T vs. Sens-T were significantly enriched in the “photosynthesis” term, and no significant GO terms found in the enrichment results of Tol-CK vs. Sens-CK (Fig. 2 A). The KEGG enrichment results showed that “Protein processing in endoplasmic reticulum” and “plant hormone signal transduction” were significantly enriched in Tol-T vs. Tol-CK; “Metabolic pathways”, “Ribosome” and “Peroxisome” were significantly enriched in Tol-CK vs. Sens-CK; “Protein processing in endoplasmic reticulum”, “Ribosome”, “plant hormone signal transduction” etc. were significantly enriched in Tol-T vs. Sens-T; no pathways were significantly enriched in Sens-T vs. Sens-CK (Fig. 2 B). DEGs with high foldchange and at the core of the pathway were defined as candidate genes. Additionally, A PPI network of candidate DEGs was constructed (Fig. 2 C).
Fig. 1.
Effects of salt stress on MDA, POD, SOD, and CAT activities in maize cultivars. A, B, C, and D, the content of MDA, POD, SOD, and CAT in both maize cultivars. Tol, Salt-tolerant 8723; Sens, salt-sensitive P138. Histograms on top of which the same letter appears represent means that are not statistically different (p>0.05); different letters identify means that are significantly different (p<0.05).
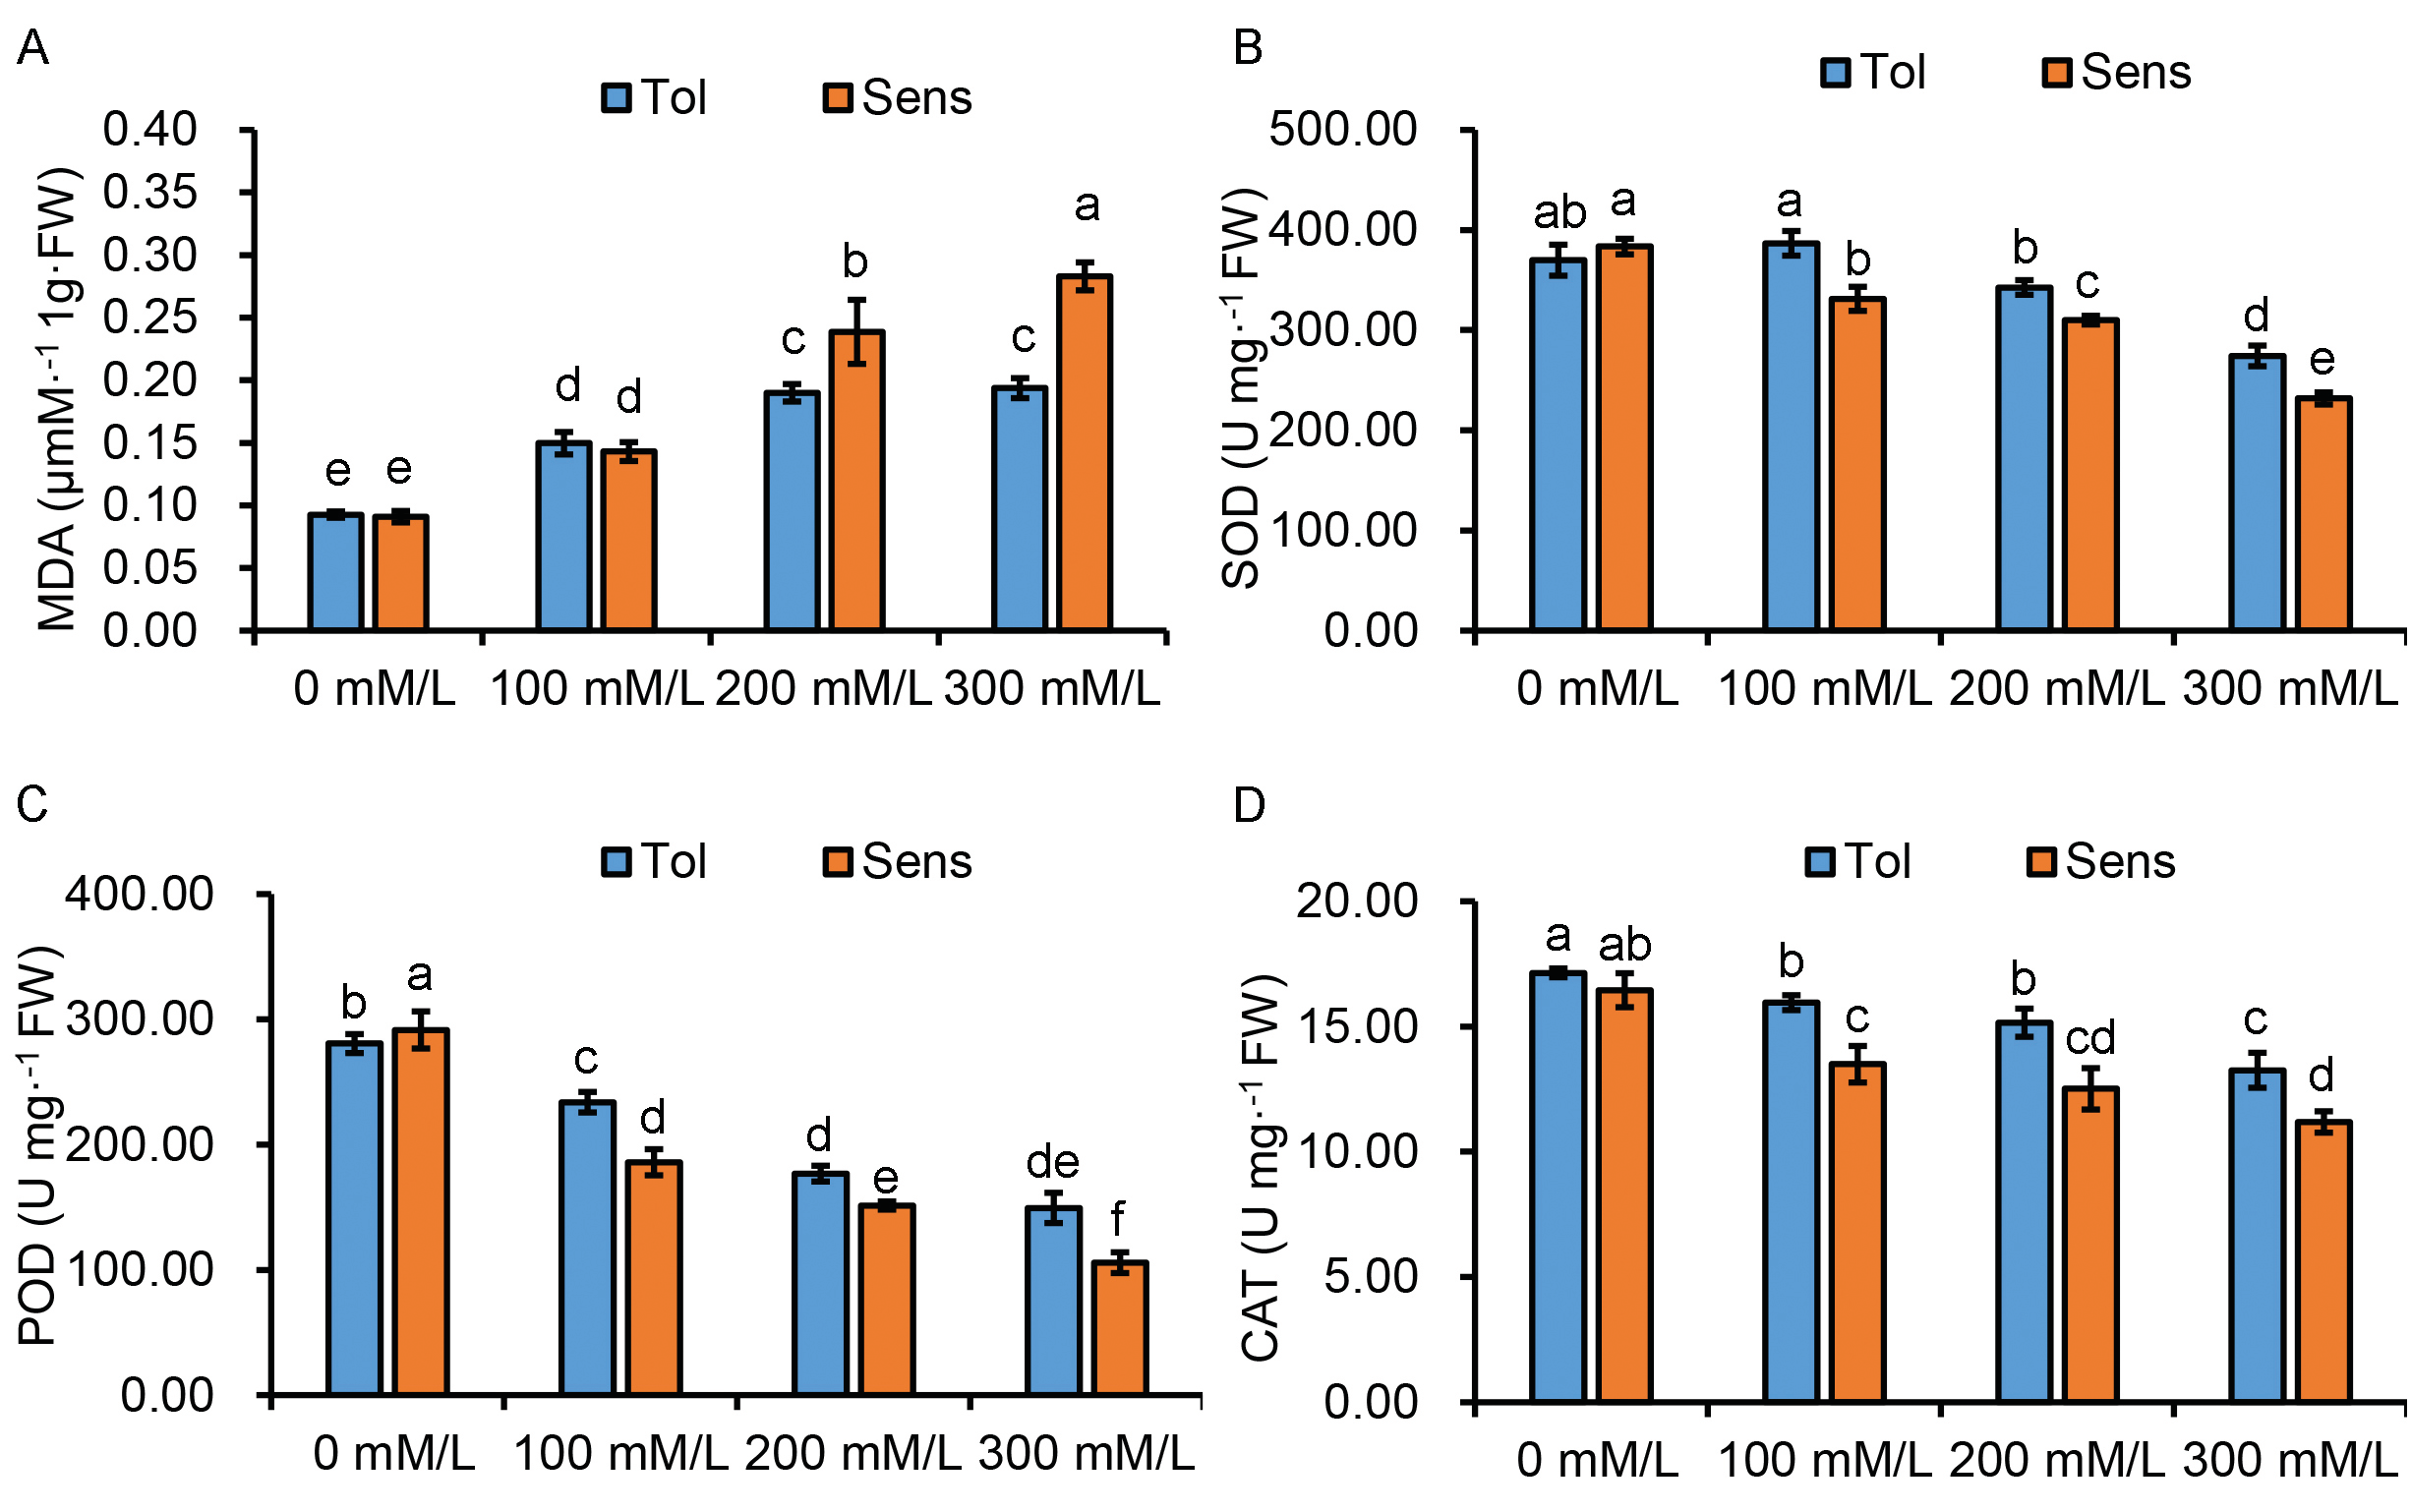
Table 2.
Sequence data quality control summary.
The top five genes with the highest degree in the PPI network were GRMZM2G037146_P01, GRMZM2G109814_P01, GRMZM2G110622_P01, gpm624 and bhlh103. Among the five genes, the annotation information of GRMZM2G037146_P01 and GRMZM2G109814_P01 is ZmHSP20. The expression of ZmHSP20 in Tol was upregulated after salt stress treatment, but not in Sens plants. Therefore, we have reason to believe that ZmHSP20 played an important role in the salt stress tolerance of maize.
Salt Stress on ZmHSP20 Overexpressing Tobacco Seedlings
ZmHSP20 fusion protein was seen in the nucleus (Fig. 3 A), whereas the 35S-GFP (control) was distributed throughout the cells (Fig. 3 A). To test the function of ZmHSP20, we developed transgenic tobaccos overexpressing ZmHSP20 (OE#1, OE#2, and OE#3). The overexpression of ZmHSP20 in the OE#1, OE#2, and OE#3, but not in WT tobaccos, was confirmed using PCR (Fig. 3 B). To investigate the effect of ZmHSP20 overexpression on germination, transgenic tobaccos were grown on 1/2 strength MS medium supplemented with 0 and 50 mM NaCl treatments. We found no significant GR difference between the WT and ZmHSP20 tobacco seeds under non-saline condition (Fig. 3 C). However, the GR of tobacco seeds overexpressing ZmHSP20 was significantly higher than that of the WT after 14 days in 100 mM NaCl stress conditions (Fig. 3 C). However, there was no significant reduction in the root length of ZmHSP20 overexpressing seedlings and the WT under both saline and non-saline conditions (Fig. 3 D). There was also a significant difference in fresh plant weight between the WT and the ZmHSP20 overexpression seedlings under 150, 175, as well as 200 mM NaCl stress and non-saline condition (Fig. 3 E).
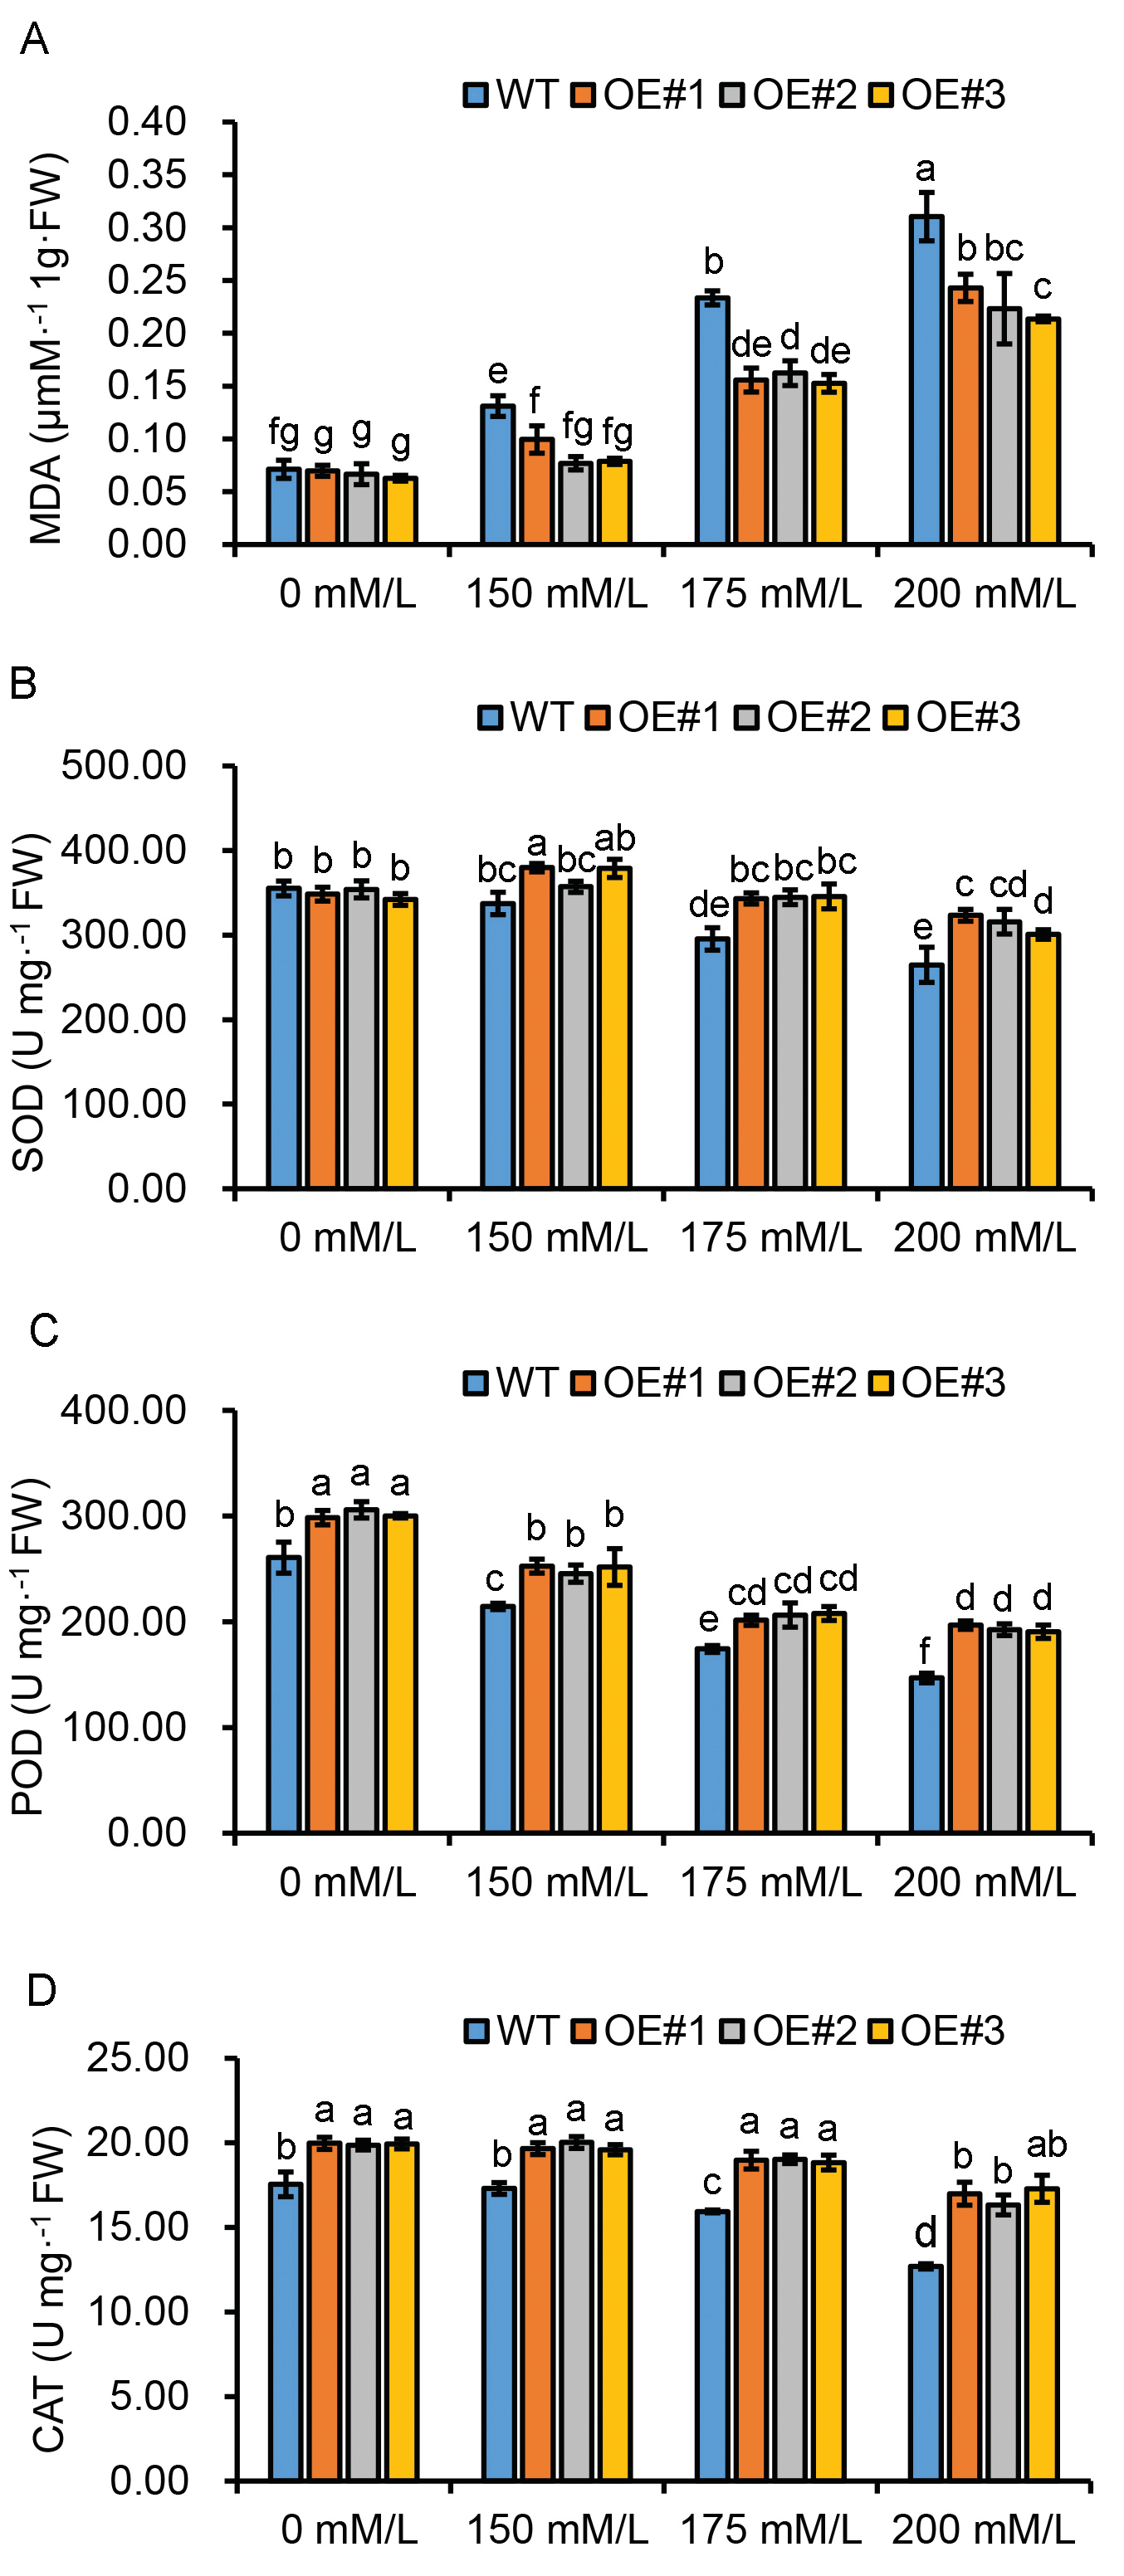
The MDA content increased from 0 to 200 mM/L NaCl in WT, OE#1, OE#2, and OE#3. At the same salt stress concentration, the MDA level was higher in the WT group than in the ZmHSP20 overexpression lines (Fig. 4 A). The SOD, POD, and CAT activity decreased significantly in all the plant groups with an increase in salinity (Fig. 4 B, C, and D). Additionally, the activity of antioxidant enzymes was significantly higher in the ZmHSP20 tobacco seedlings than in the WT seedlings.
Discussion
Salt stress induces the production and accumulation of reactive oxygen species (ROS), leading to irreversible oxidative damage in cells and impeding plant growth [21]. Our findings revealed that under salinity conditions, GR, GP, GI, SOD, POD, and CAT activities were higher in Tol plants than in Sens under salinity, indicating that Tol plants respond to salt stress by increasing the activity of antioxidant enzymes. Additionally, heightened Malondialdehyde (MDA) activity suggested an increase in oxidative damage with rising salt concentration, particularly in Sens maize. Transcriptome analysis revealed that carbohydrate metabolism-related genes were differentially expressed between the Tol-T and Tol-CK groups but not in the Sens plants. Carbohydrate metabolism plays an important role in plant growth, development, and stress response [22]. Abiotic stress dysregulates the expression of genes involved in carbohydrate metabolism [23]. In our study, an upregulation of genes associated with carbohydrate metabolism was observed, likely as a response to the elevated energy demand induced by salt stress. Contrastingly, the dearth of gene abundance in the carbohydrate metabolism pathway in Sens maize suggested challenges in meeting the energy requirements to counteract salt stress.
Fig. 2.
Main results of transcriptome sequencing. A and B, The GO and KEGG enrichment results. The redder the color, the smaller the significance value. Tol, Salt-tolerant 8723; Sens, salt-sensitive P138; T, salt treatment; CK, control. C, PPI network of candidate DEGs. The size of the nodes is relative to the number of connections, indicating that the more the number of connections is, the bigger is the size of the nodes.
Further interaction network analyses were performed to uncover the role of the ZmHSP20 gene. Plants respond to biotic and abiotic stressors by regulating the expression of related genes. Many chaperones are considered HSP, one of the largest protein families in higher plants, and are essential in biotic and abiotic stress tolerance, particularly heat, drought, and salinity tolerance [24-28]. Research shows that HSP17.0, HSP23.7, and HSP20 significantly enhance salt tolerance in rice [8, 25]. Overexpression of Populus trichocarpa HSP17.8 enhances the survival rate and promotes the growth of Arabidopsis roots under salt stress [29]. In the present study, we found that salinity upregulated the expression of ZmHSP20 in Tol but not in Sens.
Fig. 3.
Salt stress on ZmHSP20 overexpressing tobacco seedlings. A, Subcellular localization. B, RT-qPCR results of ZmHSP20 in tobacco lines. C, The germination rate in the WT and ZmHSP20 tobacco seeds. D, The root length of ZmHSP20 overexpressing seedlings and the WT under both saline and non-saline conditions. E, Fresh plant weight of WT and the ZmHSP20 overexpression seedlings under different salt content stress; Histograms on top of which the same letter appears represent means that are not statistically different (p>0.05); different letters identify means that are significantly different (p<0.05).
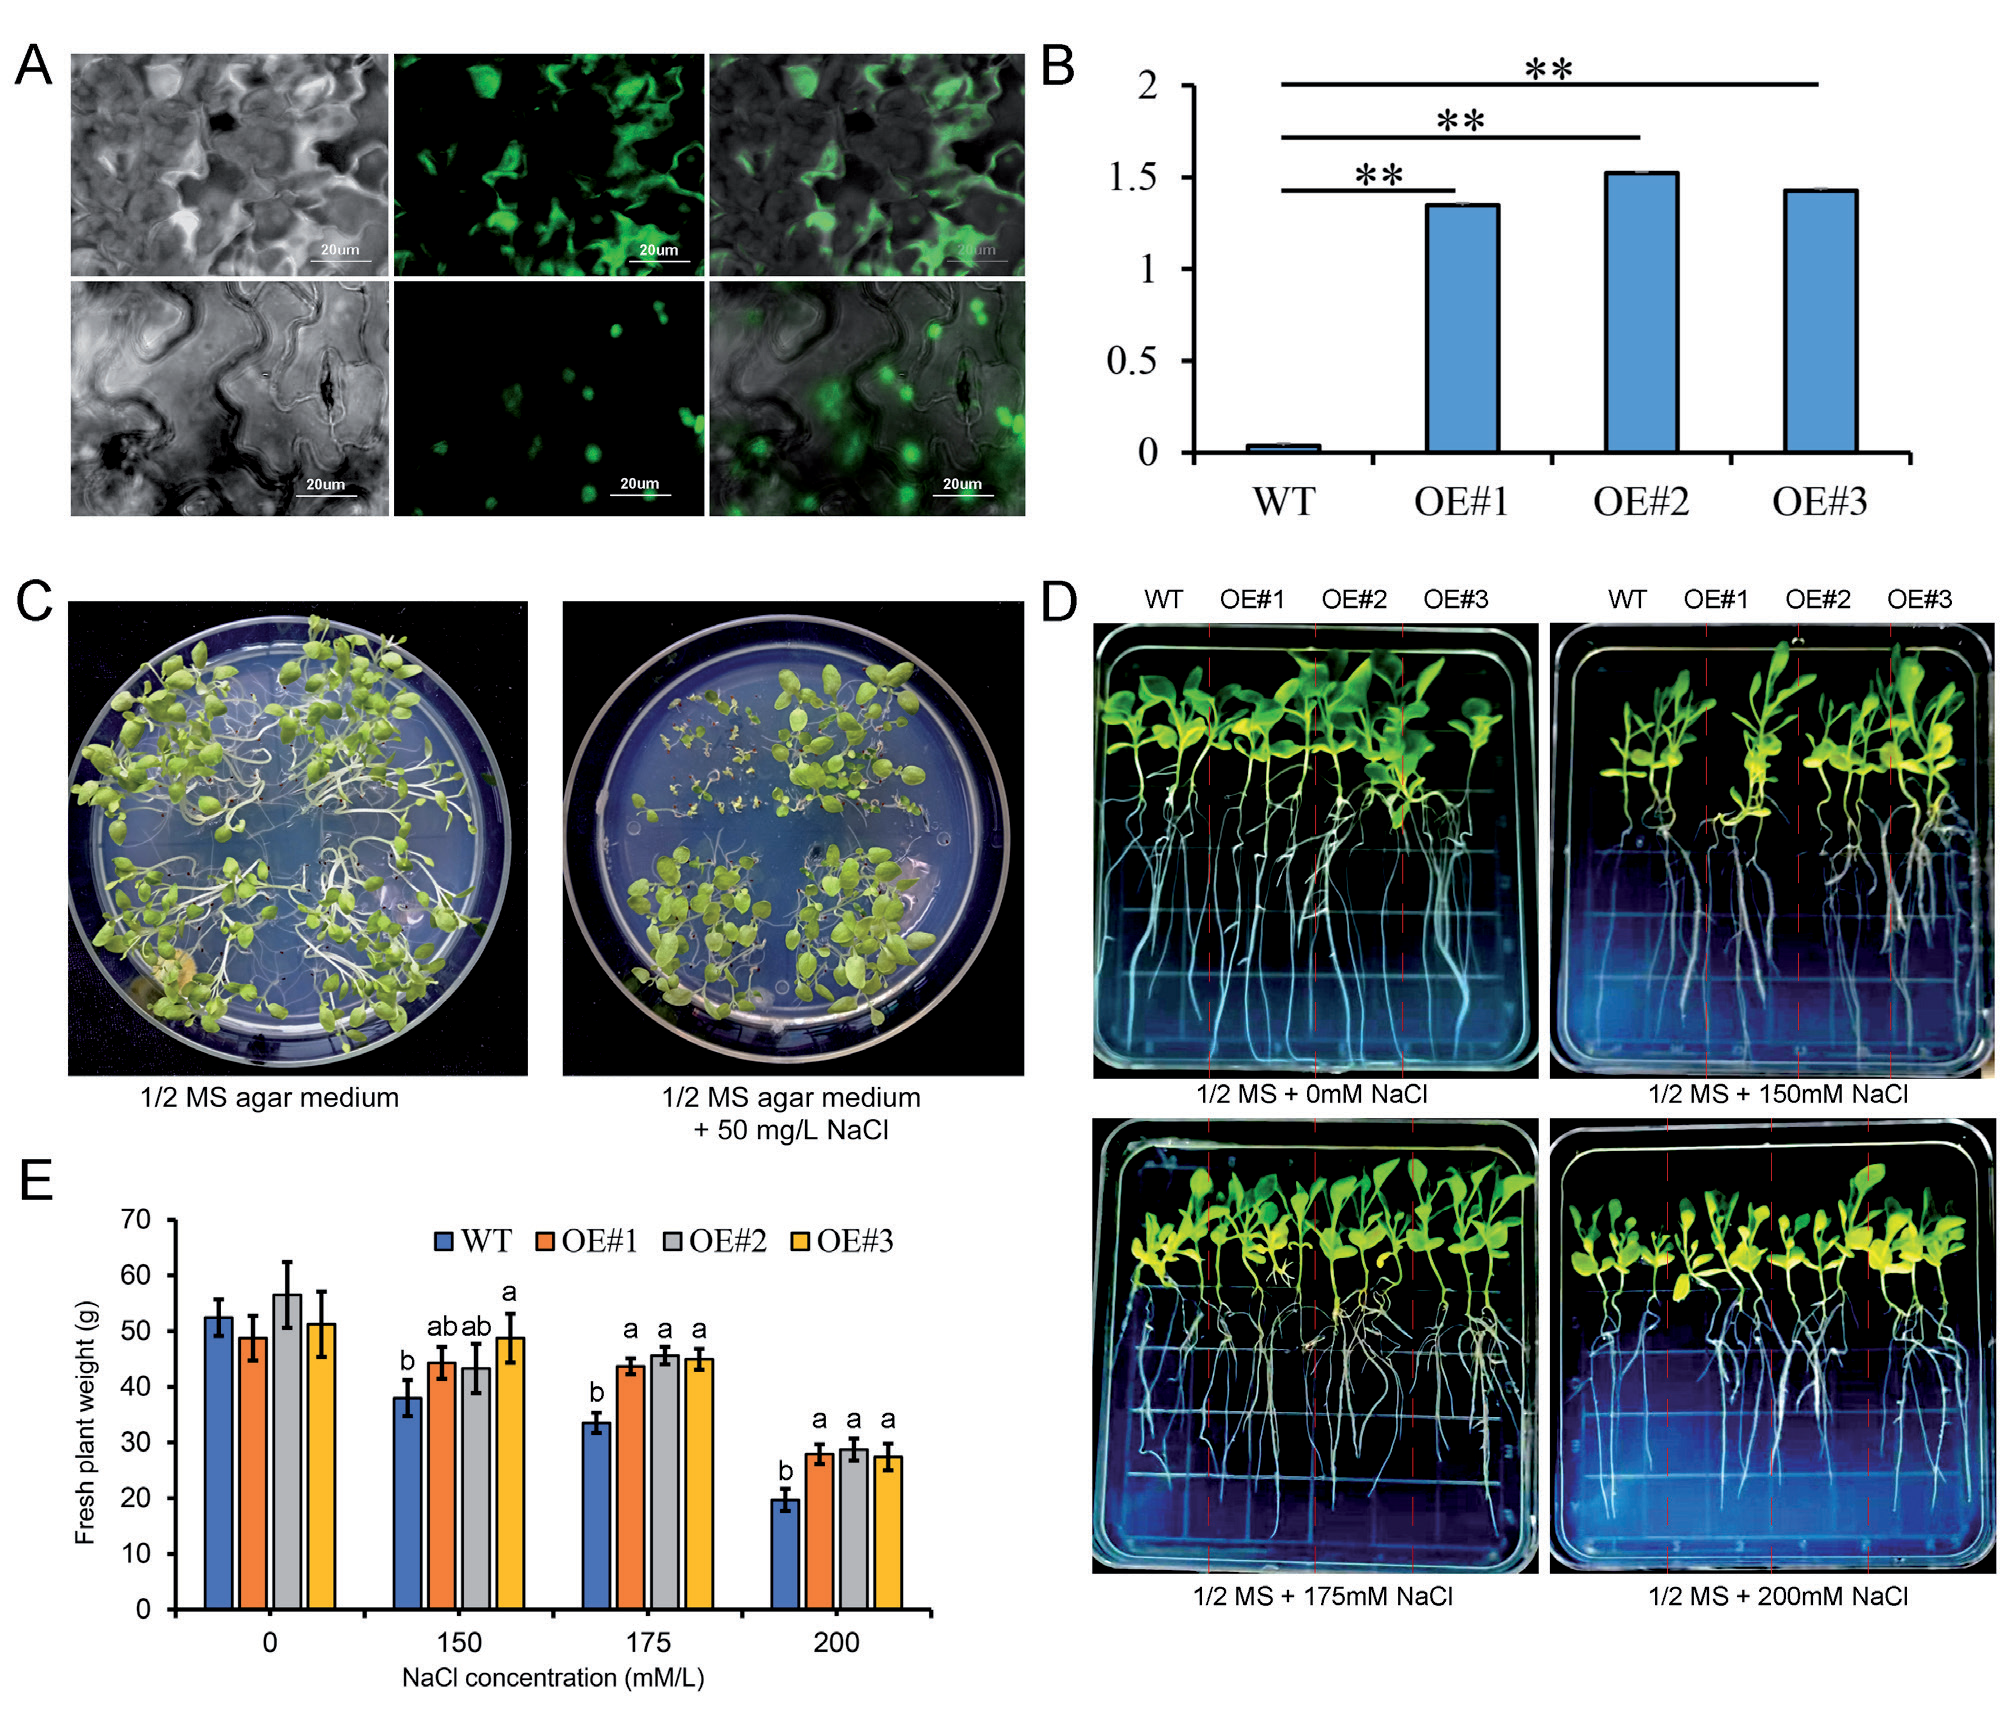
Fig. 4.
Effects of salt stress on MDA, POD, SOD, and CAT activities in ZmHSP20 overexpression tobacco lines. A, B, C, and D, the content of MDA, POD, SOD, and CAT in both maize cultivars. WT, wild-type tobacco lines; OE#1, OE#2, and OE#3 means different ZmHSP20 overexpression tobacco lines. Histograms on top of which the same letter appears represent means that are not statistically different (p>0.05); different letters identify means that are significantly different (p<0.05).
Salt stress can induce oxidative stress bursts by increasing the production of ROS [30]. Meanwhile, oxidative stress induces the expression of HSPs [31]. As a heat-response protein, AtHSFA2 overexpression enhances heat and oxidative stress tolerance in Arabidopsis thaliana [32]. In addition to tobacco’s own NtHSP20, the high expression of ZmHSP20 enhanced the salt tolerance of transgenic tobacco. Also, the MDA activity was higher in tobacco overexpressing ZmHSP20, implying alleviation of oxidative stress. Hence, it can be hypothesized that salt stress induces oxidative stress, but tobaccos cautioned themselves against related damages by increasing the expression of ZmHSP20. In addition, we found that overexpression of ZmHSP20 increased the activity of antioxidant enzymes, consistent with previous reports [13, 33, 34]. Studies have also shown that HSP gene expression positively correlated with the activities of (oxidative stress-related enzymes) protective enzymes. Over-expression of HSP17.8 enhances the SOD activity in Arabidopsis, whereas HSP16.9 increases the activities of POD, CAT, and SOD in tobacco [35]. Post-transcriptional modification, such as alternative splicing, also regulates the expression of HSFs. Under heat stress, HSFA2 binds to its promoter region to promote its transcription in a positive auto-regulatory loop. Similarly, DREB2 regulates the expression of HSFA under stress, which regulates the expression of stress-related genes in many plants [36]. Similarly, miRNAs also play a vital role in the stress response by down-regulating the expression of stress-related genes. The transcription of certain miRNAs such as miR159, miR319, miR395, and miR402 are over-transcribed under drought, cold, salinity, hormone, and nutrient deficiency stresses [37]. Also, miR398 negatively regulates the expression of CSD1, CSD2, and CCS, increasing the expression of SOD in Arabidopsis [35]. So, the changes of miRNA cannot be ignored and should be included in our next step study.
In this study, the overexpression of ZmHSP20 could effectively increase the activities of SOD, POD, and CAT, whether these effects occur as the consequence of ZmHSP20 impacting a single pathway or multiple pathways continues to be investigated. Although this study has obtained a large amount of data to prove that the ZmHSP20 gene has a certain salt tolerance effect, there are still shortcomings. Further validation is required through overexpression and interference experiments in maize in the later stage.
Conclusions
Here, we identified ZmHSP20 gene in maize seedlings that were highly expressed when subjected to salt stress. ZmHSP20 could alleviate the oxidative stress that is induced by salt stress. Also, ZmHSP20 might act as a crossing role of different biological processes related to resistance to stress. Overexpressing of ZmHSP20 increased the resistance of tobacco against salt stress, and enhanced the SOD, POD and CAT activity. In brief, our study establishes a basic foundation for further research on the function of ZmHSP20, and reports a preliminary exploration of the role of ZmHSP20 resistance to salt stress. Further investigations are required to reveal the mechanism by which ZmHSP20 regulates resistance against salt stress in maize and tobacco.

