

Introduction
According to previous research, the J. mandshurica possesses both dioecious and heterozygous traits and exhibits two main types of reproduction: male-first-female and female-first-male [1]. Flower formation is a critical node in the plant life cycle, as it plays a vital role in maintaining plant yield and quality by regulating flower development [2]. The J. mandshurica reproductive characteristic of the huckleberry, which is dioecious and heterozygous, affects the flowering time between male and female flowers, leading to unstable pollination and fruiting rates [3]. Therefore, understanding the J. mandshurica of sex differentiation regulation of the huckleberry is important for improving fruit set and yield, and subsequently increasing its economic value.
Sexual differentiation is a crucial mechanism that allows plants to adapt to their surroundings and compete with other species [4]. This process is coordinately controlled by sex chromosomes [5-10], phytohormones [11-14], and environmental factors [15-18], which results in the emergence of distinct morphologies. Research has thoroughly investigated sex differentiation in various plant species, such as Juniperus chinensis, Ginkgo biloba, and Populus. The deletion of plant-related enzyme-encoding genes, rate-limiting step enzymes in ethylene (ETH) biosynthesis, gibberellins, oleoresin steroids, dehydration status of the plant, fungal infection, and key transcription factors have been found to play a crucial role in the control of sex differentiation [19-27]. Advances in biotechnology, genomics, and high-throughput sequencing have enabled the investigation of species such as Citrus reticulata, Morus alba, and Camellia oleifera using transcriptomic analysis, which provides an important reference to reveal the molecular regulation of plant sex differentiation [28-37]. Despite the existence of relevant literature, research specifically addressing the asynchrony between male and female flower bud development in Juglans regia is limited [38].
In this study, we performed transcriptome sequencing of J. mandshurica flower buds during the crucial physiological differentiation stage to unravel the underlying molecular mechanisms governing the development of male and female buds. Through comparative analysis of differentially expressed genes, our aim was to identify and characterize the pivotal candidate genes involved in this complex biological process. By delving into this intricate process, we can gain profound insights into the mechanisms driving the development of male and female buds. Moreover, it enables us to shed light on the broader aspects of reproductive biology in woody plants.This study lays a solid foundation for expanding the existing knowledge on the reproductive biology of woody plants. It also offers a theoretical basis and technical support for future endeavors aimed at enhancing fruit yield and quality, as well as selecting and breeding superior varieties for forestry production. The outcomes of this research have immense potential for advancements in the field and contribute to the sustainable development of the forestry industry.
Materials and Methods
Plant Material
The experimental materials were collected on April 2, 2021, during the physiological differentiation period of rowan bud development, from rowan trees growing in the natural forests of the experimental forestry field in the Dichegou area of Liaoning Province (latitude and longitude coordinates). Three robust female-preferred and male-preferred rowan plants were carefully selected. Male- and female-preferred flower buds were collected from these plants. The pre-pistillate female flower bud is designated as T1, with three replicates labeled as A1, A2, and A3; the pre-pistillate male flower bud is designated as T2, with three replicates labeled as A4, A5, and A6; the pre-male female flower bud is designated as M1, with three replicates labeled as B1, B2, and B3; the pre-male male flower bud is designated as M2, with three replicates labeled as B4, B5, and B6, totaling 12 samples (Table 1). Upon collection, the male and female flower buds were rapidly frozen in liquid nitrogen and subsequently stored at -80ºC. The samples were handled and preserved under consistent conditions to maintain their integrity for further analysis (Fig. 1).
RNA-Seq and Data Processing
A total of 12 RNAseq libraries were constructed (A1-6, B1-6), with each group comprising three libraries as triplicates. The collected samples were sent to Paisano Biotechnology Ltd (Shanghai, China) for high-throughput sequencing of the cDNA libraries. The data filtering procedure involved the utilization of Cutadapt to eliminate junctions at the 3’ end and reads with an average mass fraction below Q20 [39-42]. This was done to obtain clean reads suitable for further analysis (Table 2).
Identification of Differentially Expressed Genes (DEGs) and Functional Annotation
The updated version of TopHat2, HISAT2 software, was employed to align the filtered reads to the reference genome. HTSeq was utilized to perform statistical comparisons of the read count values for each gene, representing the raw gene expression levels. To facilitate the comparability of gene expression levels across genes and samples, the expression amounts were normalized using FPKM (Fragments Per Kilobase of transcript per Million mapped reads) [43, 44]. FPKM is calculated as the number of fragments per kilobase of gene length per million mapped fragments, based on the alignment results. Differential expression analysis of genes was conducted using DESeq [45]. The criteria for identifying differentially expressed genes were a fold change |log2FoldChange|>1 and a significance level of P-value<0.05.
Table 1.
Statistics of the RNA-Seq results.
Following the completion of differential gene analysis, the differentially expressed genes were classified based on the annotation information of the genome. GO enrichment analysis was performed using topGO [46], which calculates gene lists and the number of genes associated with each GO term using the differentially expressed genes annotated with GO terms. It then determines the significance of enrichment using hypergeometric distribution (with the criteria for significant enrichment being a P-value<0.05). This analysis helps identify the significantly enriched GO terms associated with differential genes, providing insight into the main biological functions governed by these genes. KEGG (Kyoto Encyclopedia of Genes and Genomes) enrichment analysis was conducted using clusterprofiler [47]. It calculates the list of genes and the number of genes involved in each pathway using the differentially expressed genes annotated with KEGG pathways. A hypergeometric distribution is employed to determine the significance of enrichment (with the criteria for significant enrichment being a P-value<0.05). This analysis identifies the KEGG pathways significantly enriched with differential genes compared to the whole genomic background, revealing the major biological functions regulated by these genes.
Cluster Analysis and Trend Analysis
The combined sets and samples of differentially expressed genes from all comparison groups were subjected to two-way clustering using the R language Pheatmap software package. This clustering was based on the expression levels of the same gene in different samples and the expression patterns of different genes in the same sample. The results of the two-way clustering heatmap analysis were utilized to further classify the genes into clusters based on the similarity of their expression patterns, defaulting to nine clusters. It is postulated that genes within each cluster belong to a distinct category and are more likely to exhibit similar functions.
Fig. 1.
Different types of floral buds comparison. a, gynoecious precocious female floral bud; b, gynoecious precocious male floral bud; c, androecious precocious female floral bud; d, androecious precocious male floral bud.
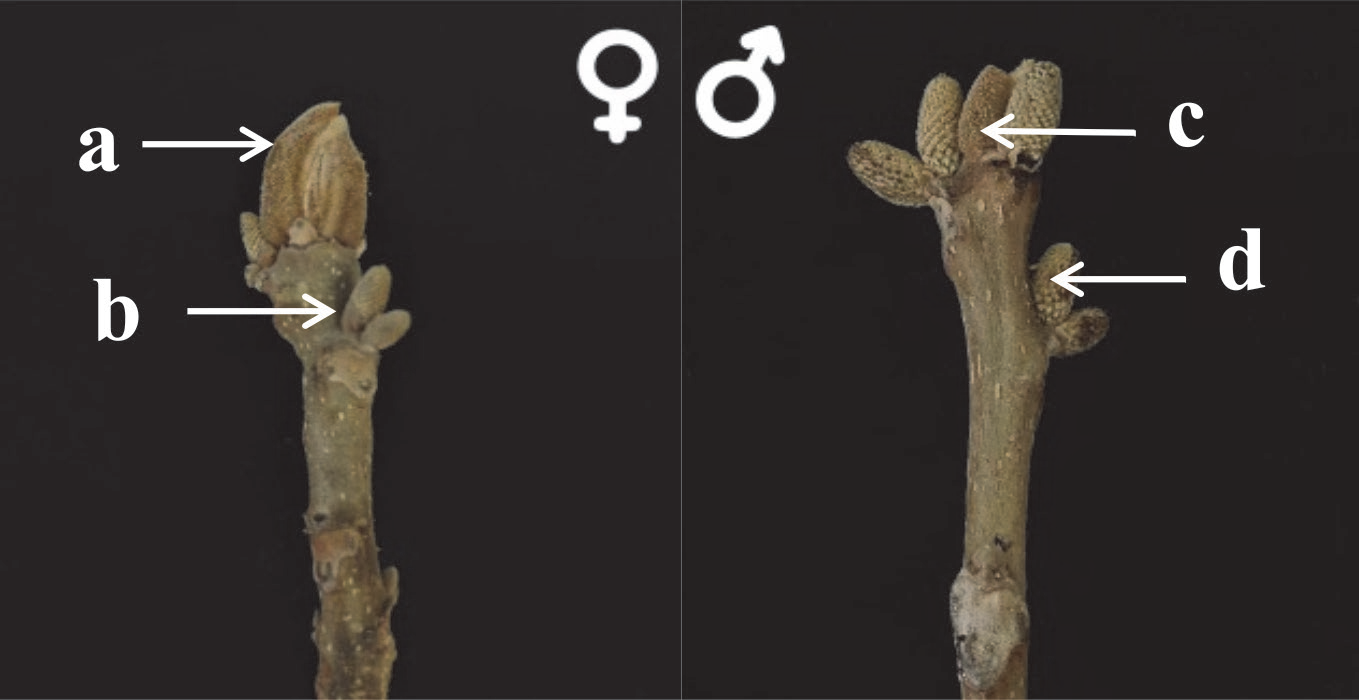
Table 2.
Quantitative primer table.
The visualization of the expression trends of different gene types across samples is represented by the blue trend line, enabling a focused analysis on key genes. The distance calculation was performed using the Euclidean method, and hierarchical clustering employing the complete linkage method was used for clustering. This approach aids in identifying genes with similar expression patterns and provides insights into their potential functional similarities.
qRT-PCR Validation of RNA-seq Data
Seven differentially expressed key genes were randomly selected for validation of their expression in different samples using RT-qPCR, aiming to confirm the accuracy of the RNA-Seq data. Total RNA extraction in this experiment was performed using the TIANGEN kit, and the qPCR reaction system had a total volume of 20 μL, comprising 10 μL of 2 × ChamQ Universal SYBR qPCR Master Mix (Vazyme Biotechnology, Nanjing, China), each containing 0.4 μmol/L forward and reverse primers, 1 μL of tenfold diluted cDNA template, and 8.2 μL of ddH2O.
The PCR conditions were as follows: initial denaturation at 9ºC for 30 s, followed by 40 cycles of denaturation at 95ºC for 10 s, and annealing/extension at 60ºC for 30 s. These PCR conditions were employed to ensure accurate amplification of the specific gene targets and to maintain the integrity of the qPCR process.
Results
RNA-Seq Data Analysis
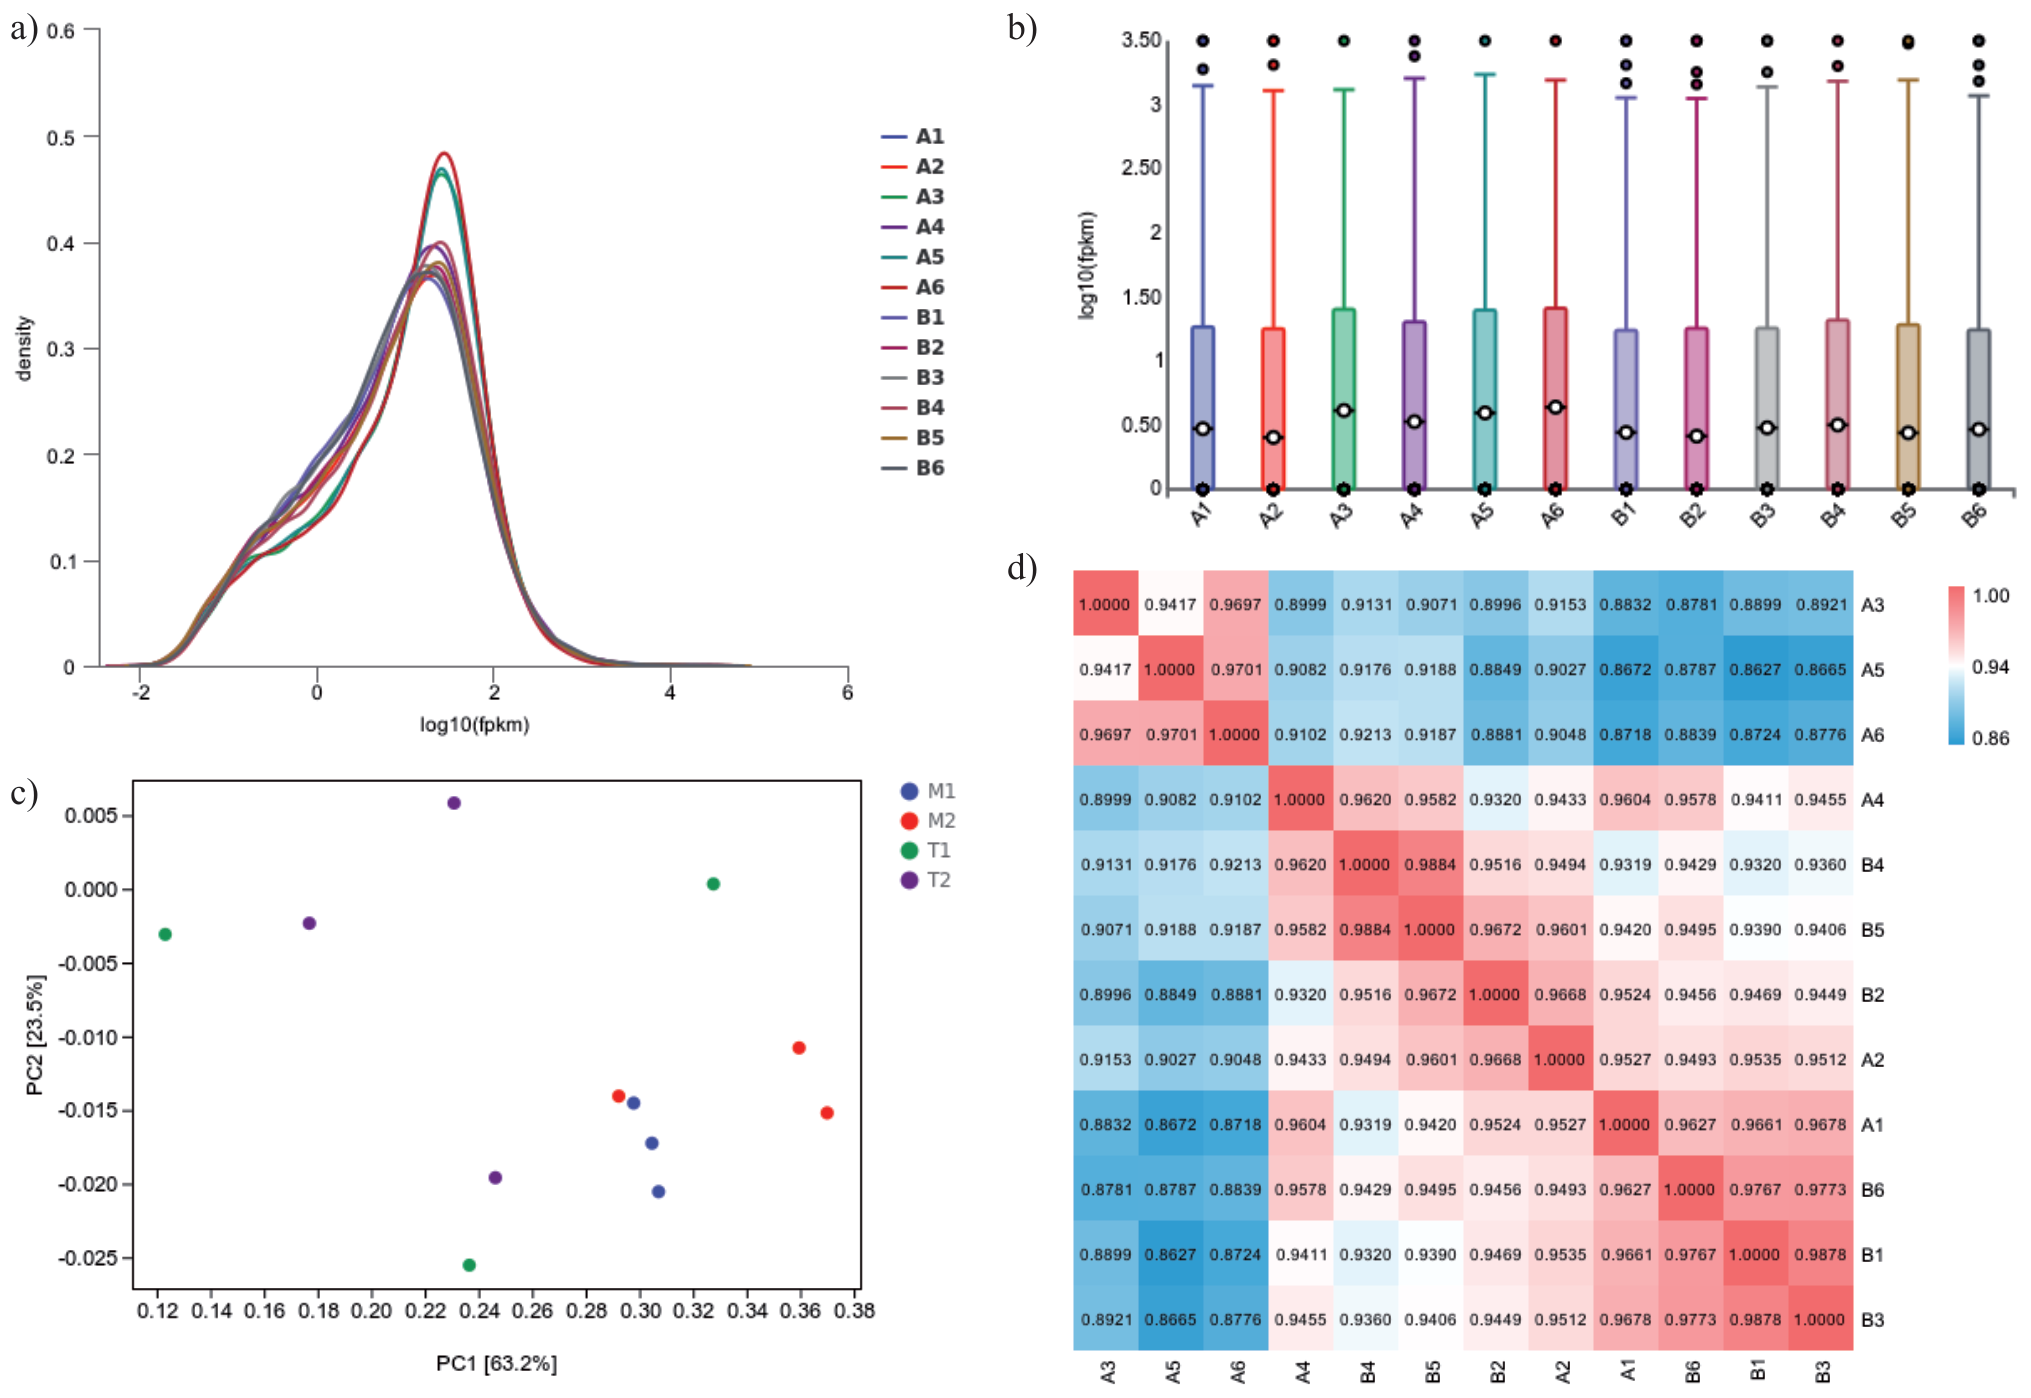
The Q30 base percentage of all 12 sequenced libraries exceeded 90%. Additionally, the percentage of high-quality sequence bases in each library after filtering surpassed 90% of the sequenced bases. The filtered reads were aligned to the reference genome, and the comparison results revealed a mapping ratio of over 70%, indicating the appropriate selection of the reference genome and the absence of relevant data contamination (Table 2). The gene expression profiles across sample groups exhibited a favorable abundance pattern, signifying a uniform distribution of gene expression levels (Fig. 2A). Violin plots were primarily employed to visualize the distribution of probability densities of the data samples (Fig. 2B).
PCA analysis facilitated the clustering of similar samples, with the proximity between samples indicating higher similarity. Based on the PCA analysis, the three biological replicates within each of the four subgroups clustered together, reflecting the consistency within each subgroup (Fig. 2C). Pearson’s correlation coefficient was utilized to assess the correlation of gene expression levels among different samples. The resulting analysis portrayed the strength and direction of the linear relationship between variables, with correlation coefficients exceeding 0.95 (Fig. 2D), indicative of robust inter-sample correlation.
Comparative Transcriptomic Analysis of Different Types of Male and Female Flower Buds
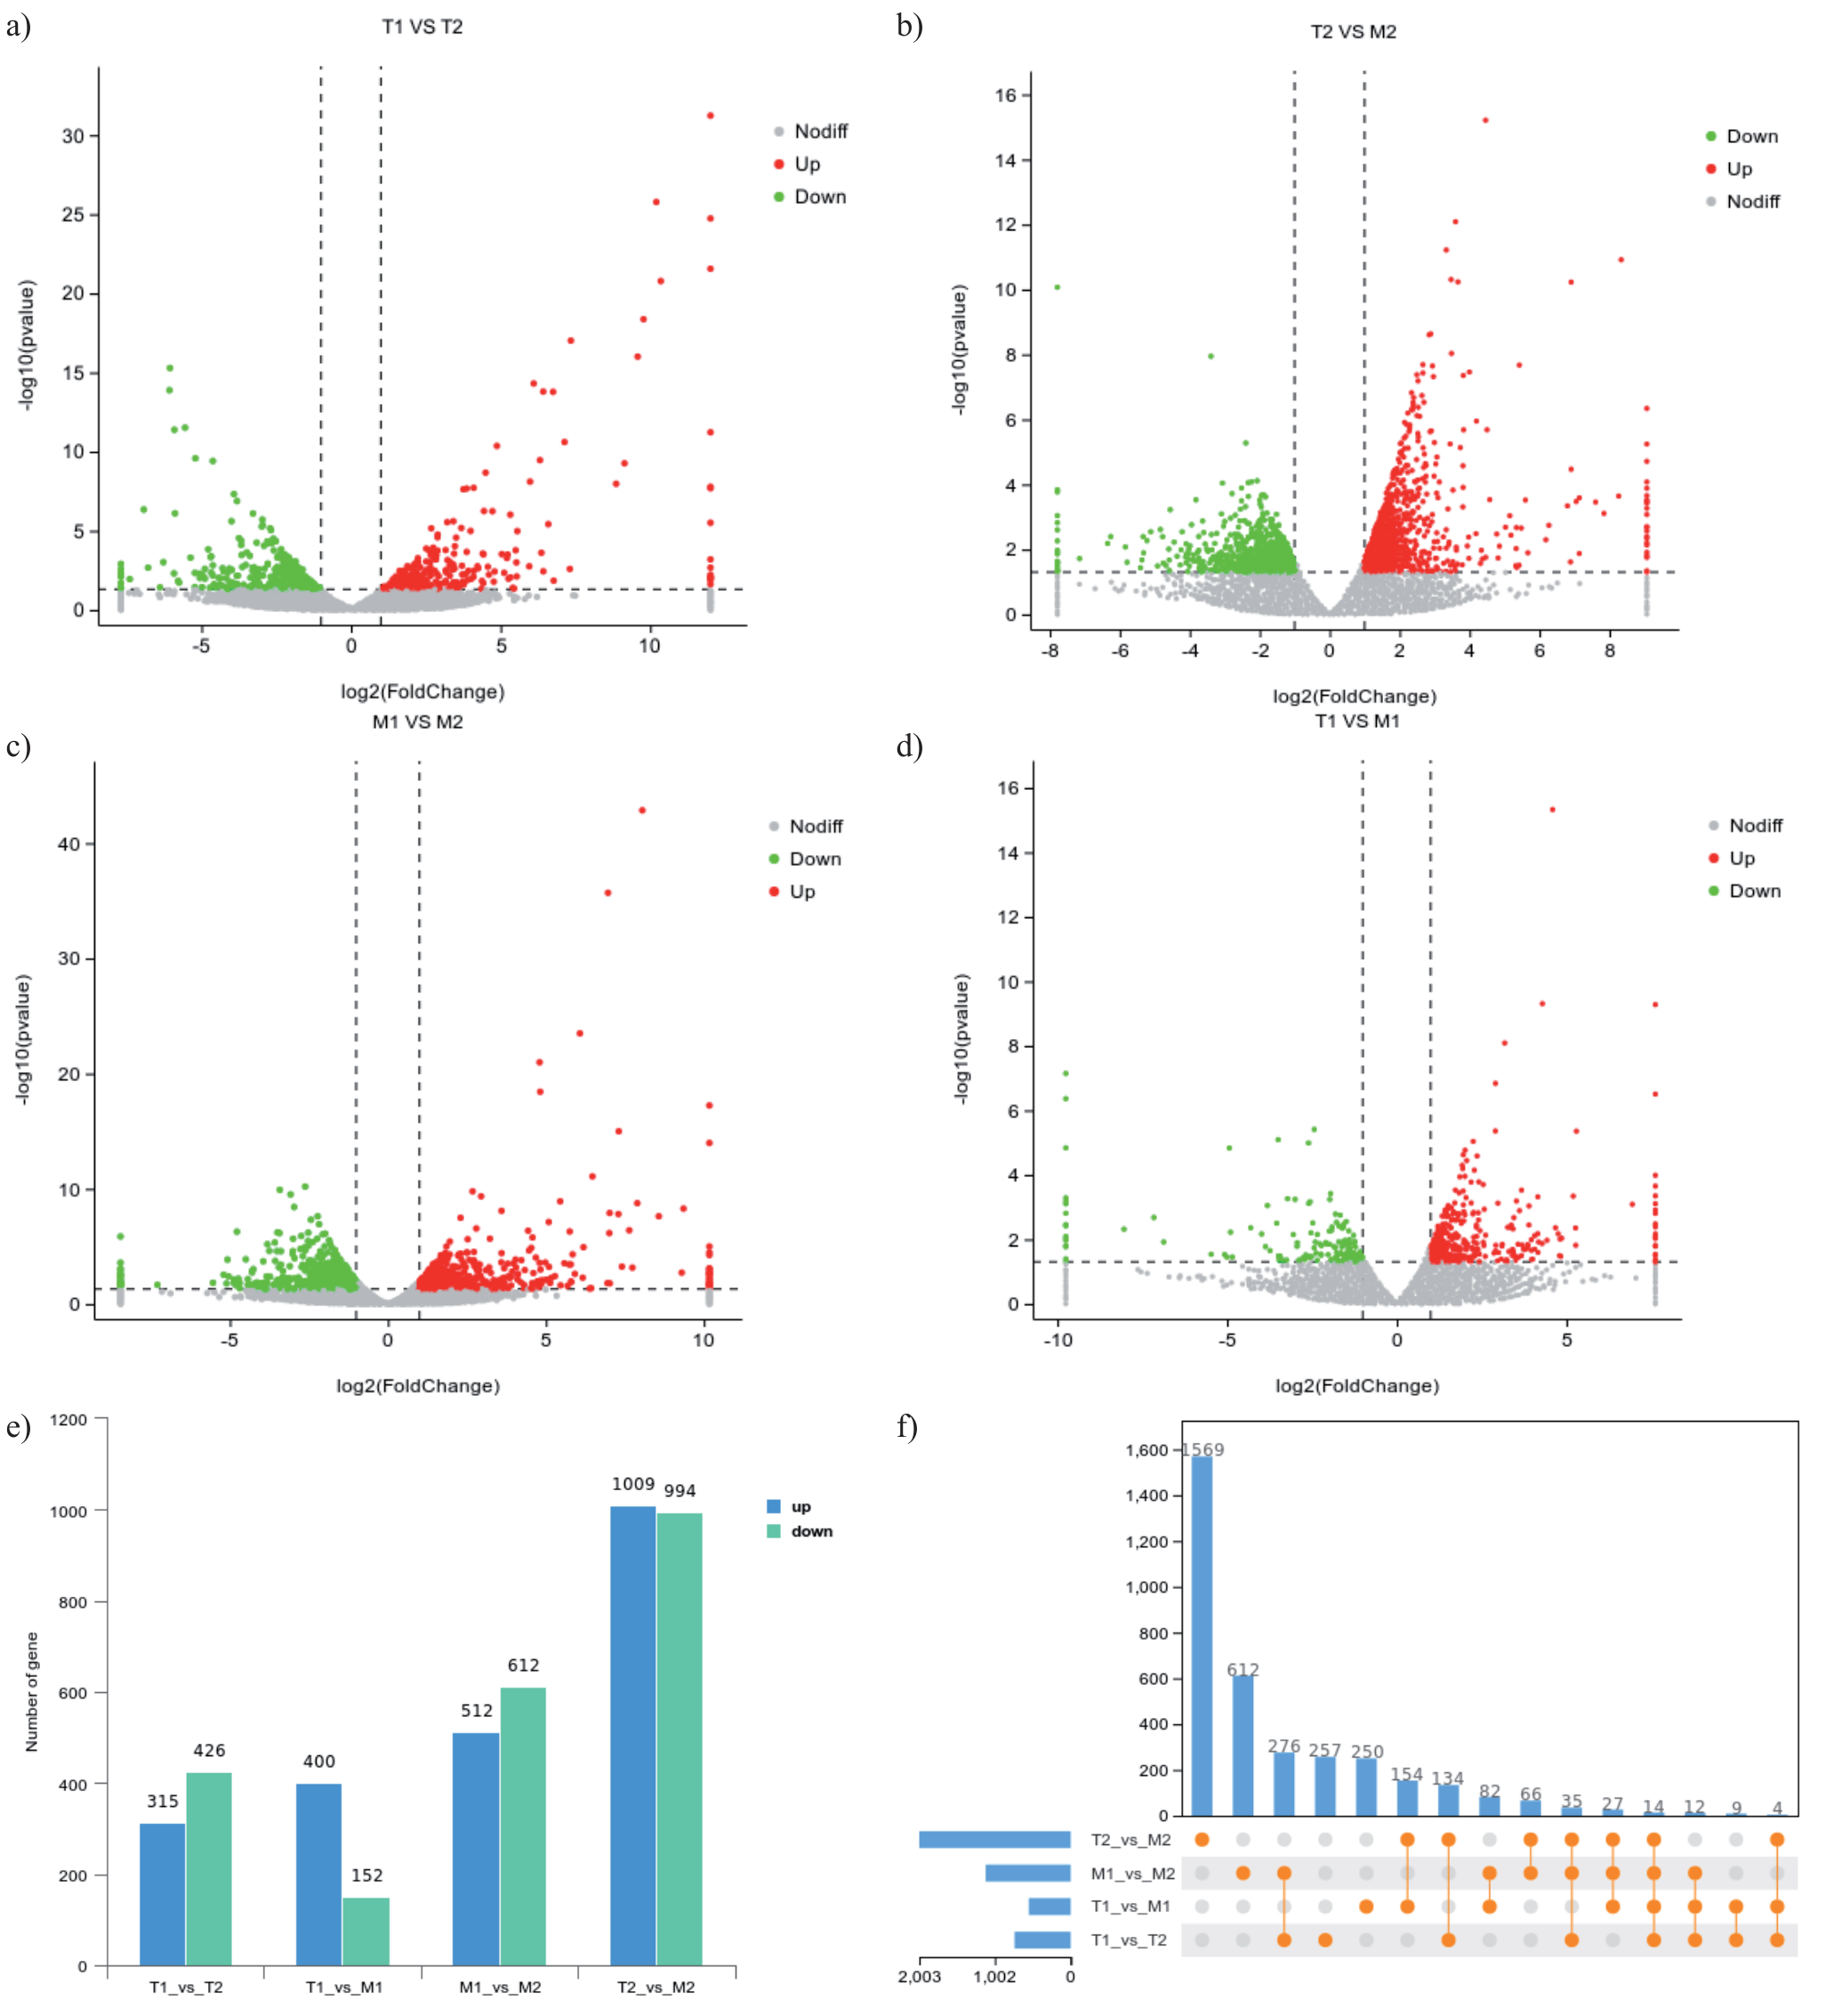
To comprehensively elucidate the variability in gene expression patterns during the development of male and female flower buds, differential gene expression analysis was conducted using DESeq across four comparison groups (T1 VS T2, T1 VS M1, T2 VS M2, M1 VS M2). Genes with a fold change |log2FoldChange|>1 and a significant P-value<0.05 were considered for differential analysis. A total of 3,501 differentially expressed genes (DEGs) were identified, comprising 741 DEGs (315 up-regulated, 426 down-regulated) in the T1_vs_T2 comparison group, 552 DEGs (400 up-regulated, 152 down-regulated) in the T1_vs_M1 comparison group, 1124 DEGs (512 up-regulated, 612 down-regulated) in the M1_vs_M2 comparison group, and 2003 DEGs in the T2_vs_M2 comparison group (1009 up-regulated, 994 down-regulated). The substantial number of differentially expressed genes observed across the various comparison groups highlights the divergent genetic regulation between the two types of flower buds during male and female flower bud development. Further analyses will be pivotal in identifying key developmental genes and enhancing our understanding of the mechanisms underlying plant male and female floral organ development (Fig. 3A-F).
Fig. 2.
RNA-Seq data analysis. a) density plot: the x-axis represents the log10 (FPKM) value of the gene, while the y-axis illustrates the density of the gene distribution corresponding to the level of expression. b) violin plot: the horizontal line within the central box denotes the median, with the upper and lower edges of the box representing the 75th and 25th percentiles, respectively. The wider areas adjacent to the box depict kernel density estimates. c) the x-axis corresponds to the first principal component, and the y-axis represents the second principal component. Different shapes within the plot denote distinct samples, while varying colors indicate different groupings. d) The left and top sides of the plot showcase the sample clustering patterns, while the right and bottom sides display the sample names. Different colored squares signify varying degrees of correlation between two samples.
GO and KEGG Enrichment Analysis of Common DEGs in Four Comparison Groups
The GO enrichment analysis of the four comparison groups revealed a significant enrichment of biological process functions. Specifically, five biological process functions — bud phylogeny, germinal bud phylogeny, floral development, floral organ development, and template transcriptional regulation — were enriched in both the T1VsT2 and M1VsM2 groups, with bud phylogeny showing the highest level of enrichment. These findings indicate that the gene regulation of several biological process functions is involved in the sex differentiation of male and female flower buds. Notably, shoot phylogeny was significantly enriched in the sex differentiation process, suggesting its substantial influence on the sex determination of flower buds (Fig. 4A,C,E,G).
The analysis of KEGG pathways in the four comparison groups identified a total of 212 differentially expressed genes (91 up-regulated and 121 down-regulated) mapped to 70 pathways in the T1 vs T2 group. Enrichment analysis revealed significant enrichment of these 212 DEGs in essential biological processes such as phytohormone signaling, phenylpropane biosynthesis, photosynthesis antenna proteins, riboflavin metabolism, biosynthesis of neomycin/kanamycin/gentamycin, nitrogen metabolism, starch and sucrose metabolism, and galactose metabolism. Notably, the higher number of down-regulated genes indicates potential inhibition of certain biological processes during bud differentiation, warranting further investigation (Fig. 4B).
Fig. 3.
Comparative transcriptomic analysis of different types of male and female flower buds. A-D, volcano plots depicting log2FoldChange on the horizontal axis and significance level as negative logarithms to the base 10 on the vertical axis. Dashed lines represent thresholds for differential expression, with colors indicating up-regulated, down-regulated, or non-significantly differentially expressed genes. E, statistical summary of differential expression results: Comparison groups are represented on the horizontal axis, while the vertical axis illustrates the number of differentially expressed genes, with colors denoting up- or down-regulation. F, Upset plots displaying the number of differential genes in each comparison group, shared differential genes across multiple comparison groups, and the unique set of differential genes in each comparison group. Points on the horizontal axis represent unique differential genes, while lines connect points corresponding to shared differential genes across multiple comparison groups.
In the M1 vs M2 group, a total of 383 differentially expressed genes (80 up-regulated and 203 down-regulated) were mapped to 97 enriched pathways. In addition to the pathways identified in the T1 vs T2 group, specific enriched pathways such as MAPK signaling, arginine and proline metabolism, and glycosaminoglycan degradation were also identified. These pathways may play crucial roles in bud development and growth. Furthermore, similar to the T1 vs T2 group, the higher proportion of down-regulated genes suggests the existence of inhibitory effects during flower bud development. Further research is warranted to explore the potential roles of these enriched pathways in flower bud development and growth given their significant enrichment and the observed higher number of down-regulated genes (Fig. 4F).
Fig. 4.
GO and KEGG enrichment analysis of common DEGs in four comparison groups. (A/C/E/G), GO Enrichment Histograms. The horizontal axis represents the specific GO Term, while the vertical axis depicts the -log10 (p-value) of GO Term enrichment. (B/D/ F/H), KEGG Enrichment Factor Plots.The horizontal axis displays the rich factor (number of differentially expressed genes annotated to the Pathway divided by the total number of genes annotated to the Pathway), while the vertical axis indicates the specific Pathway. The size of the dots in the plots corresponds to the number of differentially expressed genes (up-regulated or down-regulated) annotated to the respective Pathway, and the darkness of the color represents the number of genes annotated to the Pathway. Additionally, the color shade reflects the level of significance for the enrichment (up- or down-regulated, depending on the set of genes selected for analysis).
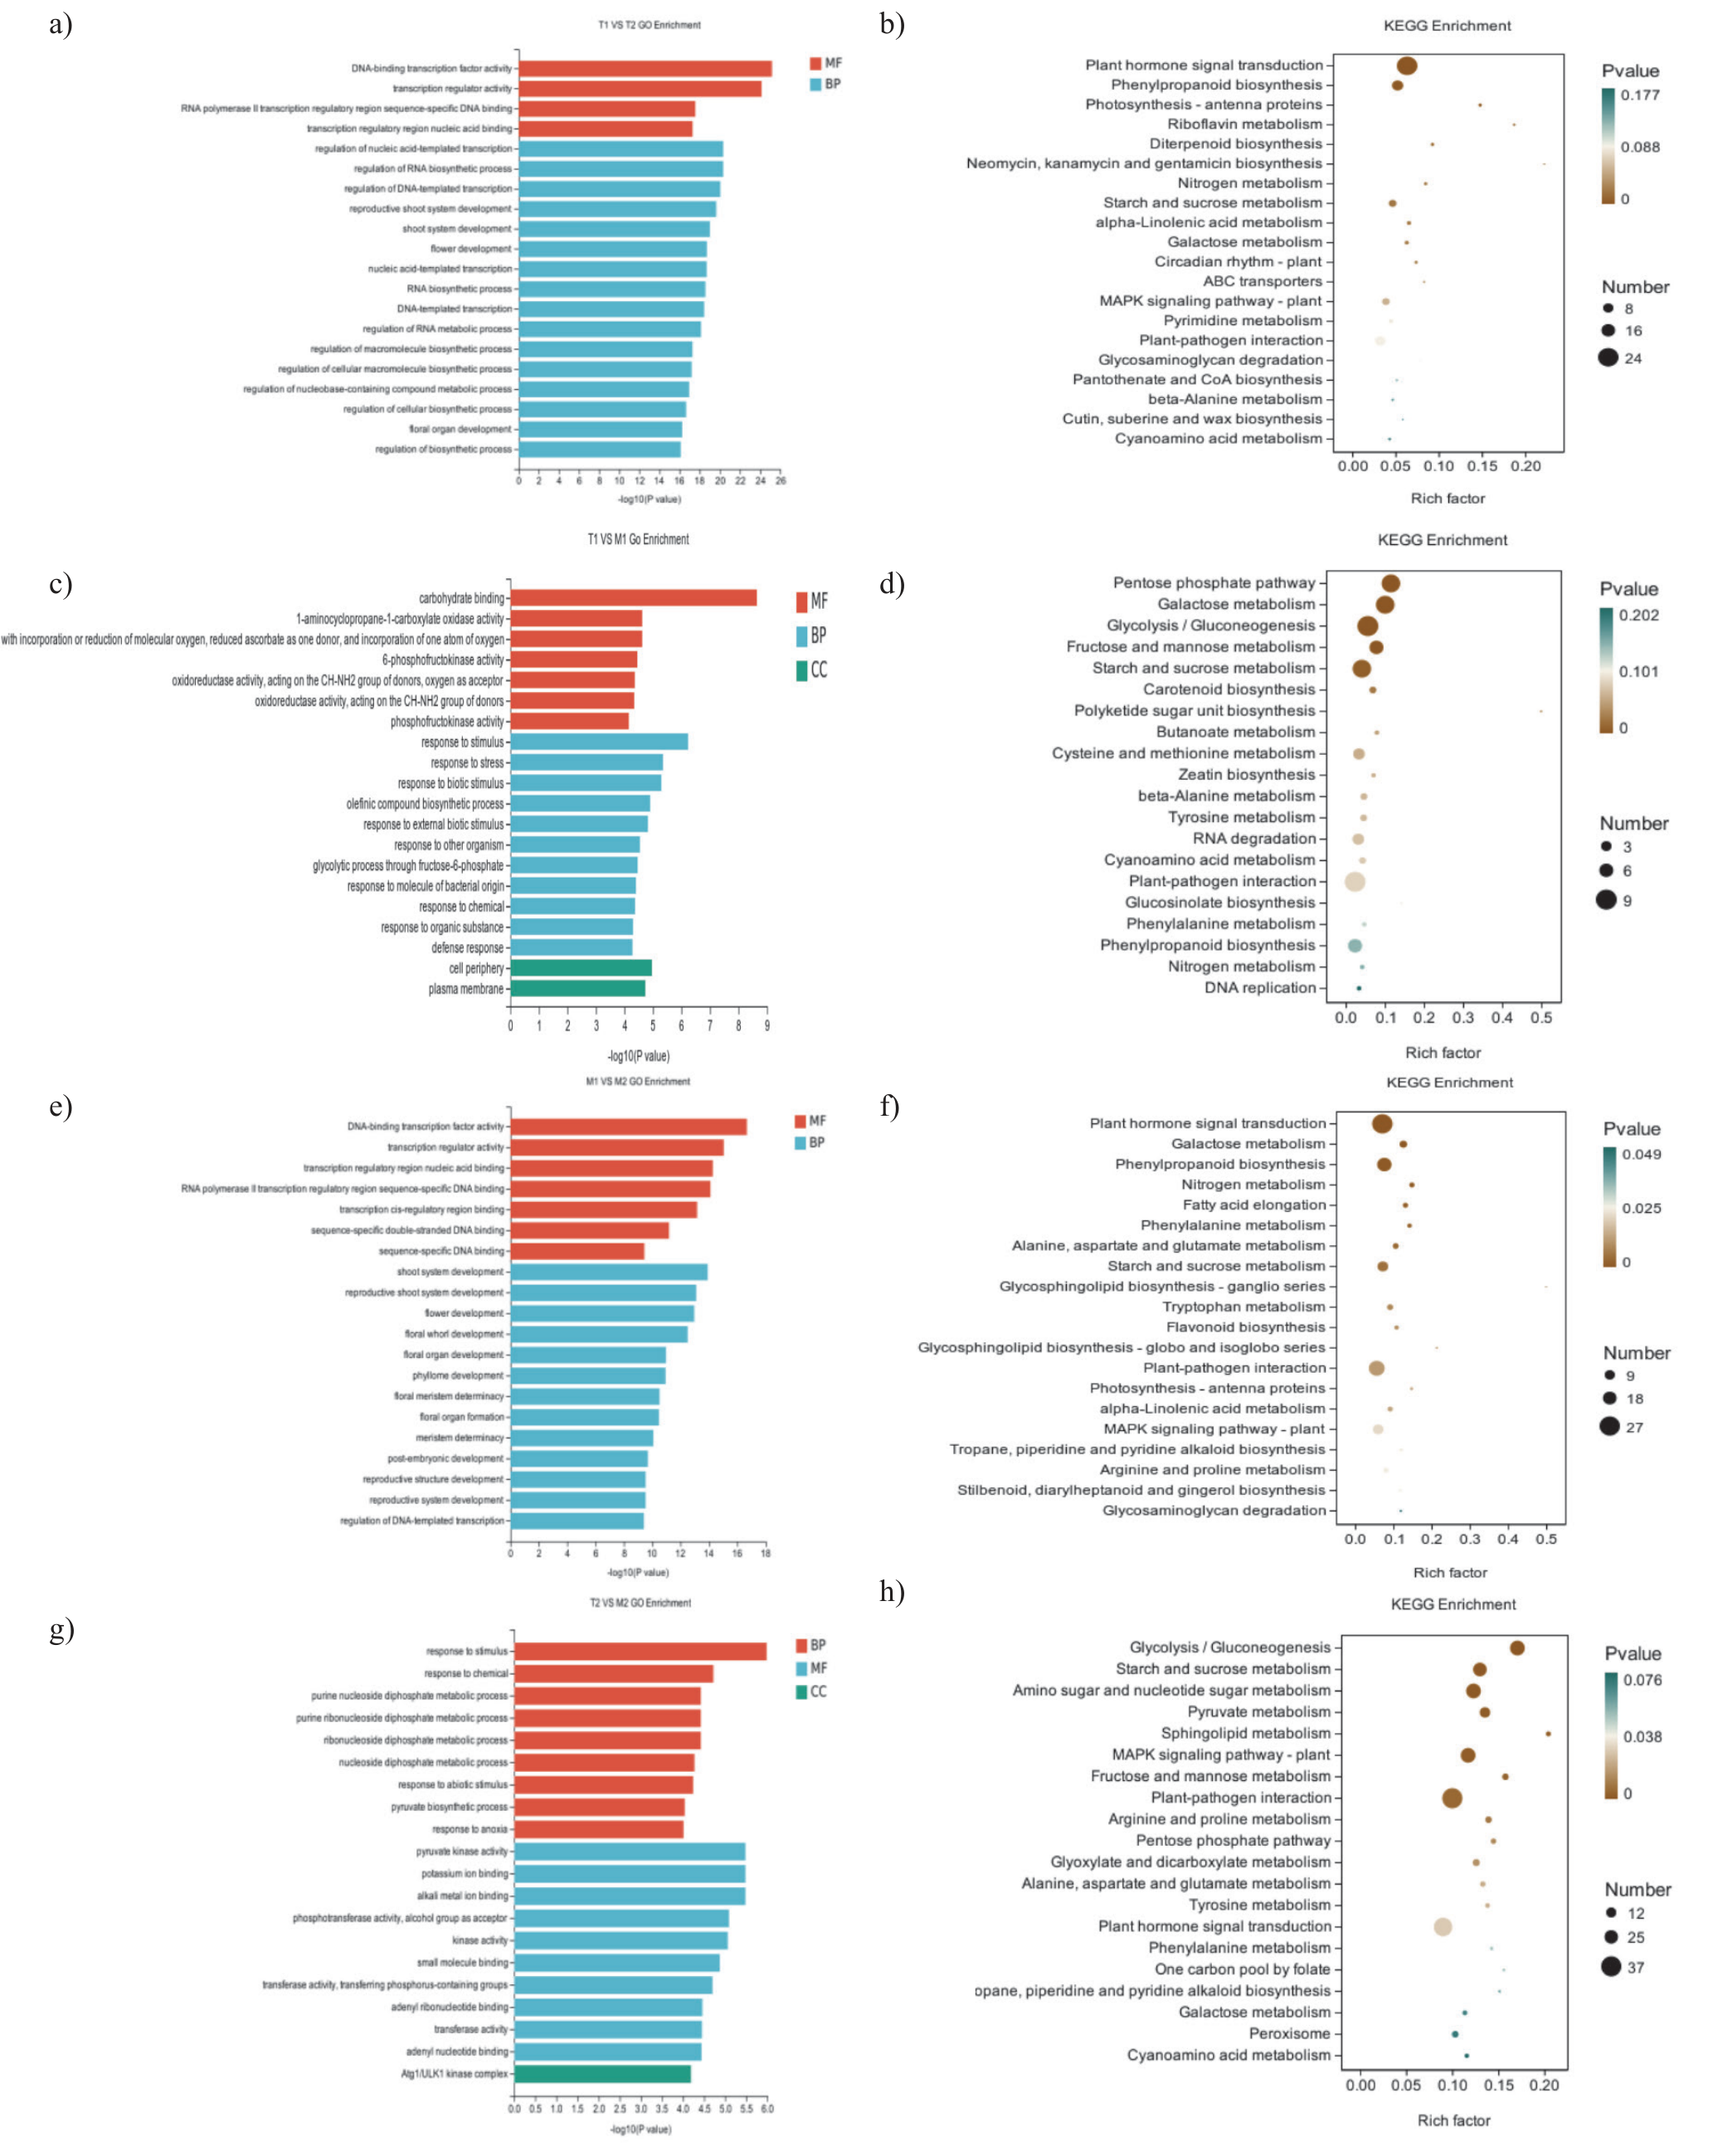
This study presents a comparative analysis of gene expression and pathway enrichment during flower bud differentiation. The T2 vs M2 and T1 vs M1 comparison groups were examined, revealing distinct patterns of differentially expressed genes (DEGs) and enriched pathways associated with cell biological processes such as energy supply, carbohydrate metabolism, and signaling. A total of 710 DEGs (346 up-regulated, 364 down-regulated) were identified in the T2 vs M2 comparison group, mapping to 117 pathways. In comparison, the T1 vs M1 group exhibited 159 DEGs (116 up-regulated, 43 down-regulated) mapped to 62 pathways. Notably, the T1 vs M1 comparison group demonstrated a higher proportion of up-regulated genes, indicating enhanced metabolic activities during flower bud differentiation. Specifically, enriched pathways including the pentose phosphate pathway, galactose metabolism, and glycolysis/gluconeogenesis were found to play pivotal roles in metabolism, with potential synergistic effects on bud differentiation. These findings shed light on the metabolic regulatory mechanisms underlying flower bud differentiation, serving as a valuable reference for future studies in this area (Fig. 4D,H).
Cluster Analysis of Differentially Expressed Genes
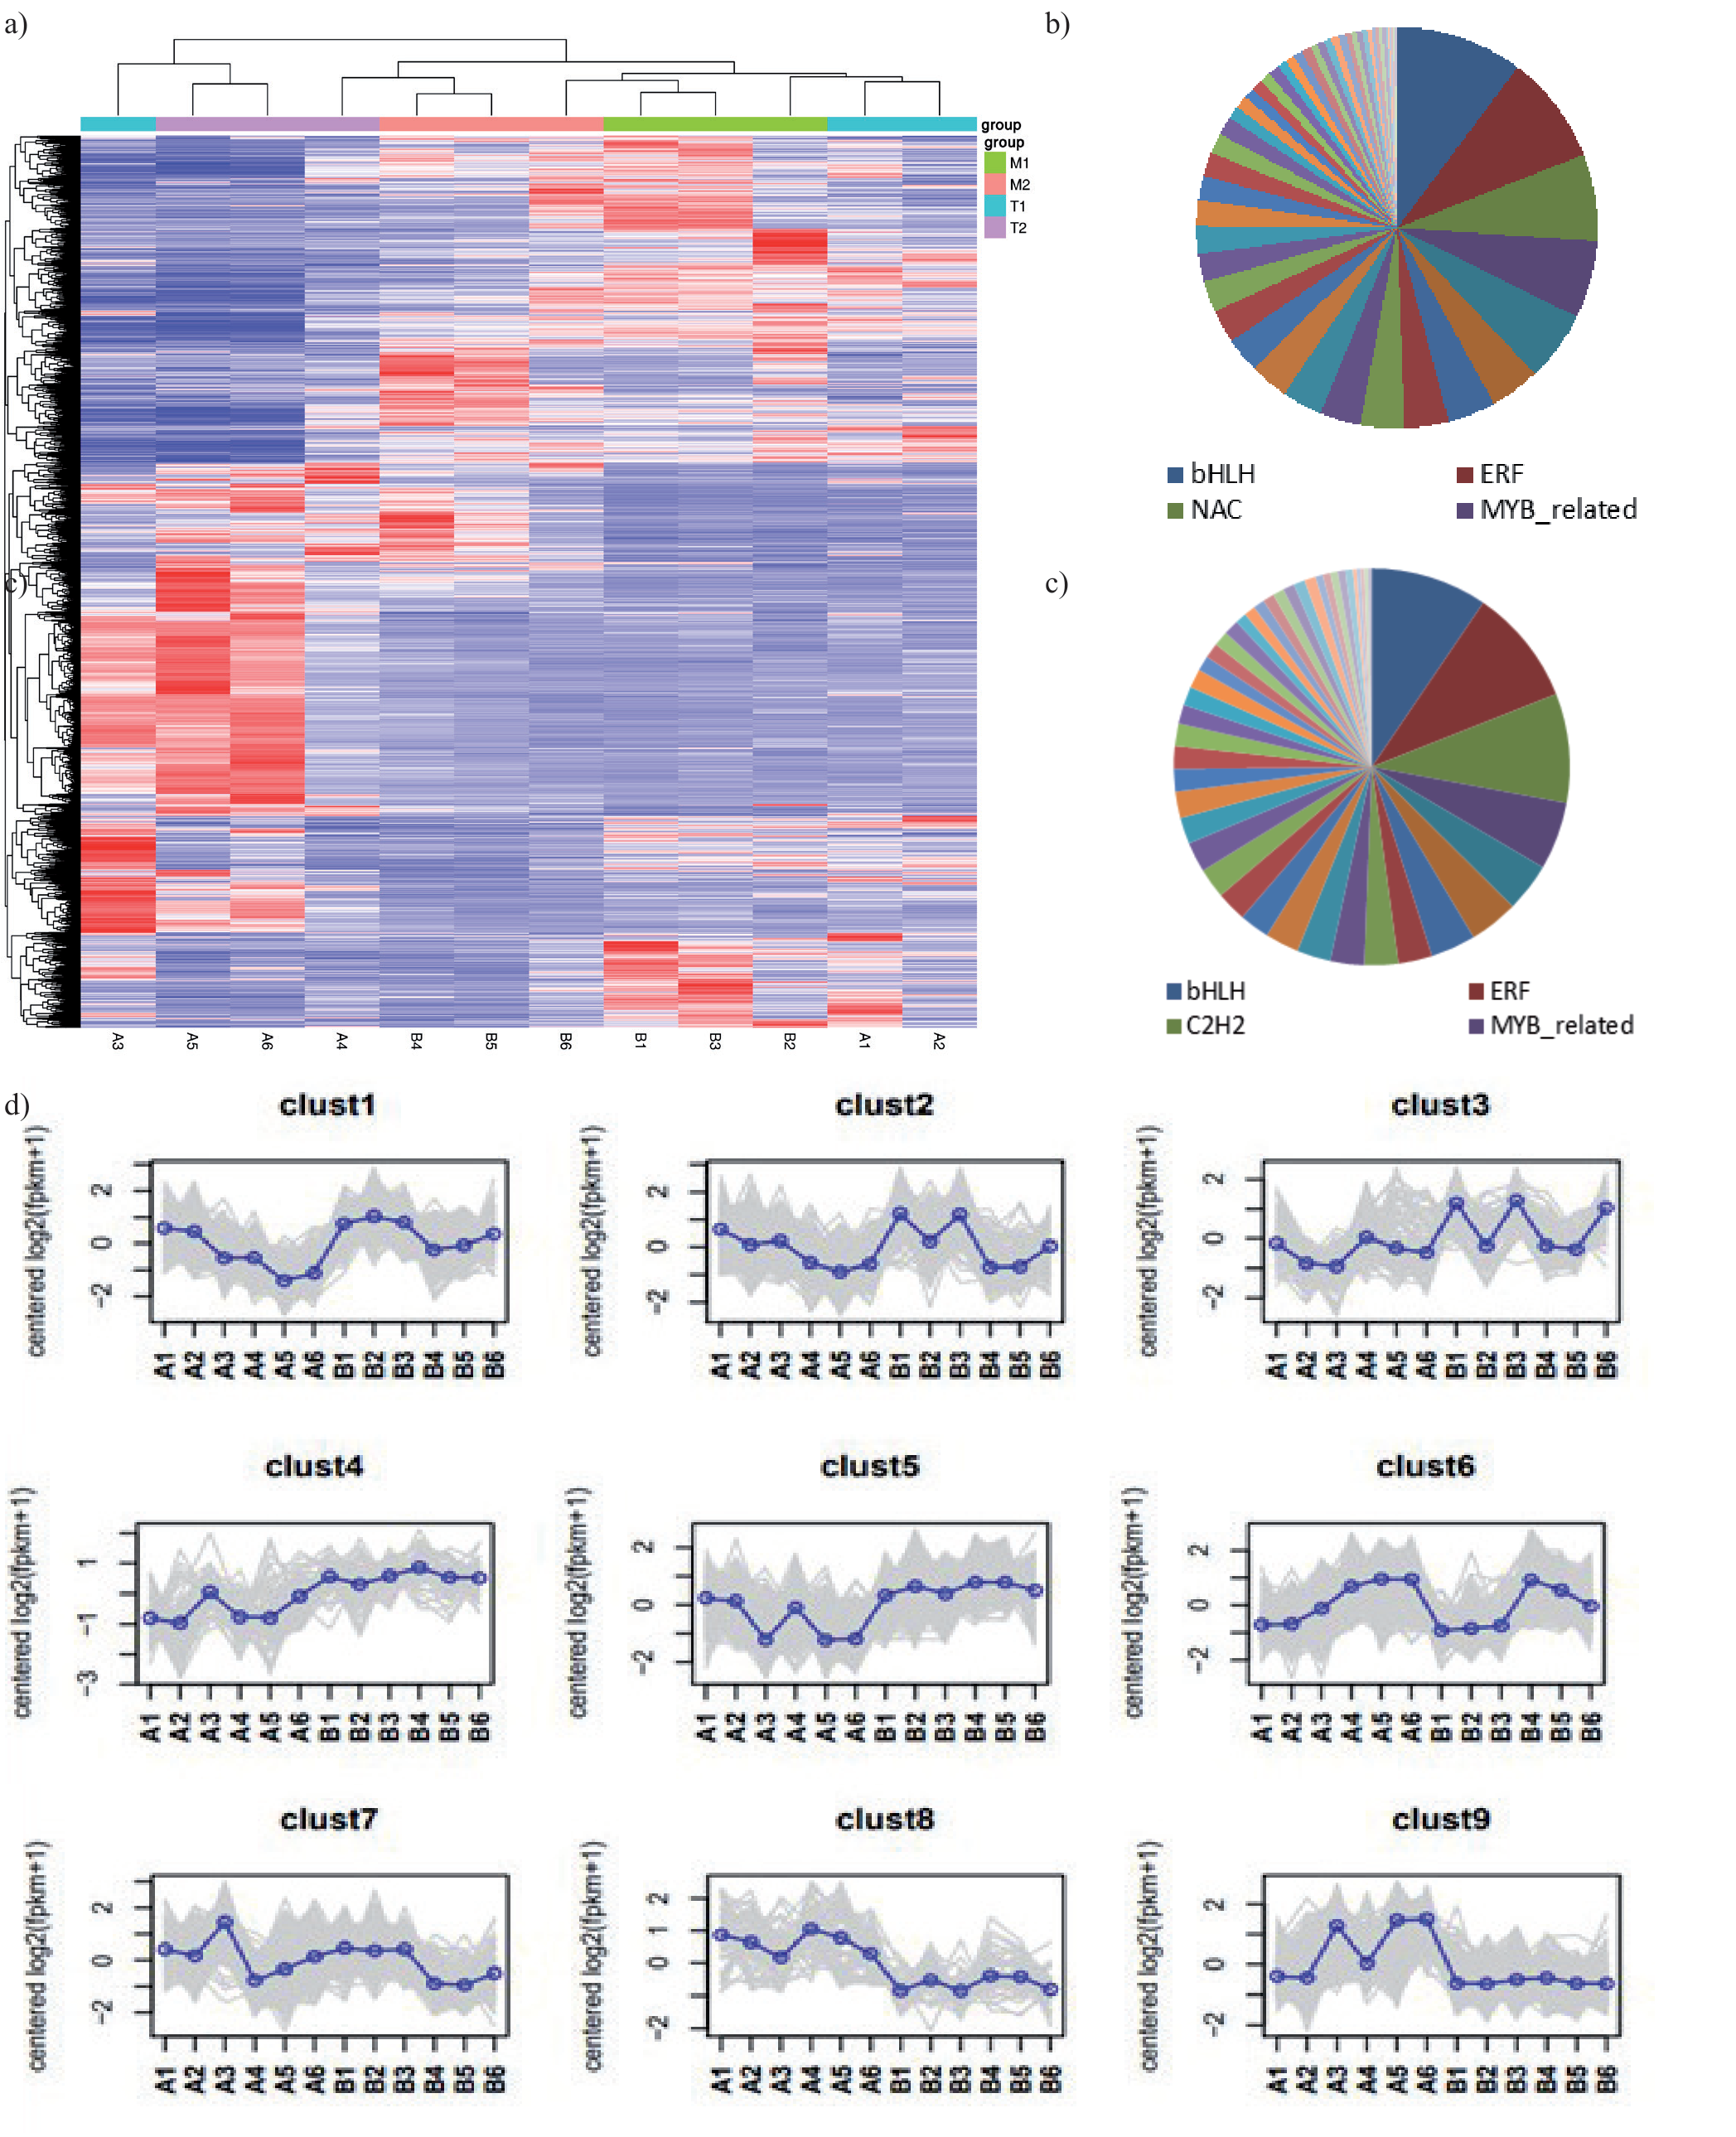
The transcriptome data underwent clustering and were subsequently partitioned into distinct clusters (default set at 9) based on bi-directional clustering heatmap analysis, reflecting the similarity of gene expression patterns. Each cluster signifies a group of genes likely to perform similar functions, enabling a focused analysis on key genes and the identification of two distinct cluster types (Fig. 5A, D).
The first type consists of Cluster 1, Cluster 2, Cluster 6, and Cluster 7, representing genes exhibiting higher variability in both types of buds. Within these clusters, gene expression was observed to be higher in female buds compared to male buds in Clusters 1, 2, and 7, and lower in Cluster 6 compared to male buds in both types. These findings suggest the potential involvement of genes within these clusters in bud differentiation in R. hirsutus and imply their role in sex development within Juglans mandshurica flower buds. The differential expression patterns of female and male buds across the clusters indicate that genes within Clusters 1, 2, and 7 may be associated with female-predominant sex differentiation, while genes in Cluster 6 may be linked to male-predominant sex differentiation (Fig. 5D).
The second type consisted of clusters 4, 5, 8, and 9. In clusters 4 and 5, the expression of male-predominant genes was found to be higher than that of female-predominant genes in both female and male flower buds. Conversely, clusters 8 and 9 demonstrated the opposite pattern, with higher expression of female-predominant genes compared to male-predominant genes. These findings suggest that certain genes within clusters 4 and 5 may be involved in female-predominant sex differentiation, while genes within clusters 8 and 9 may be associated with male-predominant sex differentiation. Interestingly, no significant difference in expression was observed between female and male flower buds within these four clusters. This indicates that these genes play a role in regulating sex differentiation in both female-predominant and male-predominant phenotypes. In other words, these genes regulate the sex differentiation of flower buds regardless of the predominant sex, resulting in no discernible expression difference between female and male flower buds within these four clusters (Fig. 5D)
A pie chart comparing the transcription factors involved in genes within the two types of clusters revealed that 672 transcription factors were associated with gynoecious-related clusters, while 326 transcription factors were implicated in androecious-related clusters. Notably, the number of transcription factor families related to androecious-related genes was higher, with bHLH having 31, ERF having 31, and C2H2 having 29 representatives. On the other hand, genes related to female-predominant traits displayed a higher number of transcription factor families, including bHLH with 69, ERF with 59, and NAC with 47 representatives. Interestingly, both male-predominant and female-predominant genes exhibited a high presence of bHLH and ERF families. These findings suggest that bHLH and ERF family transcription factors may play crucial roles in regulating sex expression in Nutria species. Additionally, the NAC family was also highly represented in female-predominant-related genes, indicating that NAC transcription factors likely play a significant role in the differential expression of female-predominant and male-predominant sex differentiation. Furthermore, other families such as MYB_related, WRKY, MIKC_MADS, FAR1, C3H, etc., also showed a certain representation in female-predominant-related genes, suggesting their potential regulatory roles in female development and sex expression in huckleberry (Fig. 5B,C)
Based on the aforementioned analysis, our focus encompassed genes within clusters 1, 2, 4, 5, and 7, with the aim of identifying key genes involved in the sex differentiation of female-predominant flower buds. Additionally, attention was directed towards genes within clusters 6, 8, and 9, to conduct a thorough analysis of the key genes implicated in the sex differentiation of male-predominant flower buds.
Fig. 5.
Cluster analysis of differentially expressed genes. A, clustering diagram of differentially expressed genes, where genes are represented horizontally and each column represents a sample. The color red denotes highly expressed genes, while green indicates genes with low expression levels (According to the similarity of gene expression patterns, they were classified into 9 distinct clusters.) B, pie chart detailing the top transcription factor families with the highest number of differentially expressed genes associated with femalepredisposed traits. C, pie chart depicting the transcription factor families predominantly present among differentially expressed genes associated with the female-predisposing phenotype. D, Scatter plot. The gray lines in the figure show the expression patterns of individual genes within each cluster, while the blue lines represent the average expression values of all genes in the cluster across samples.
Screening the Key Genes
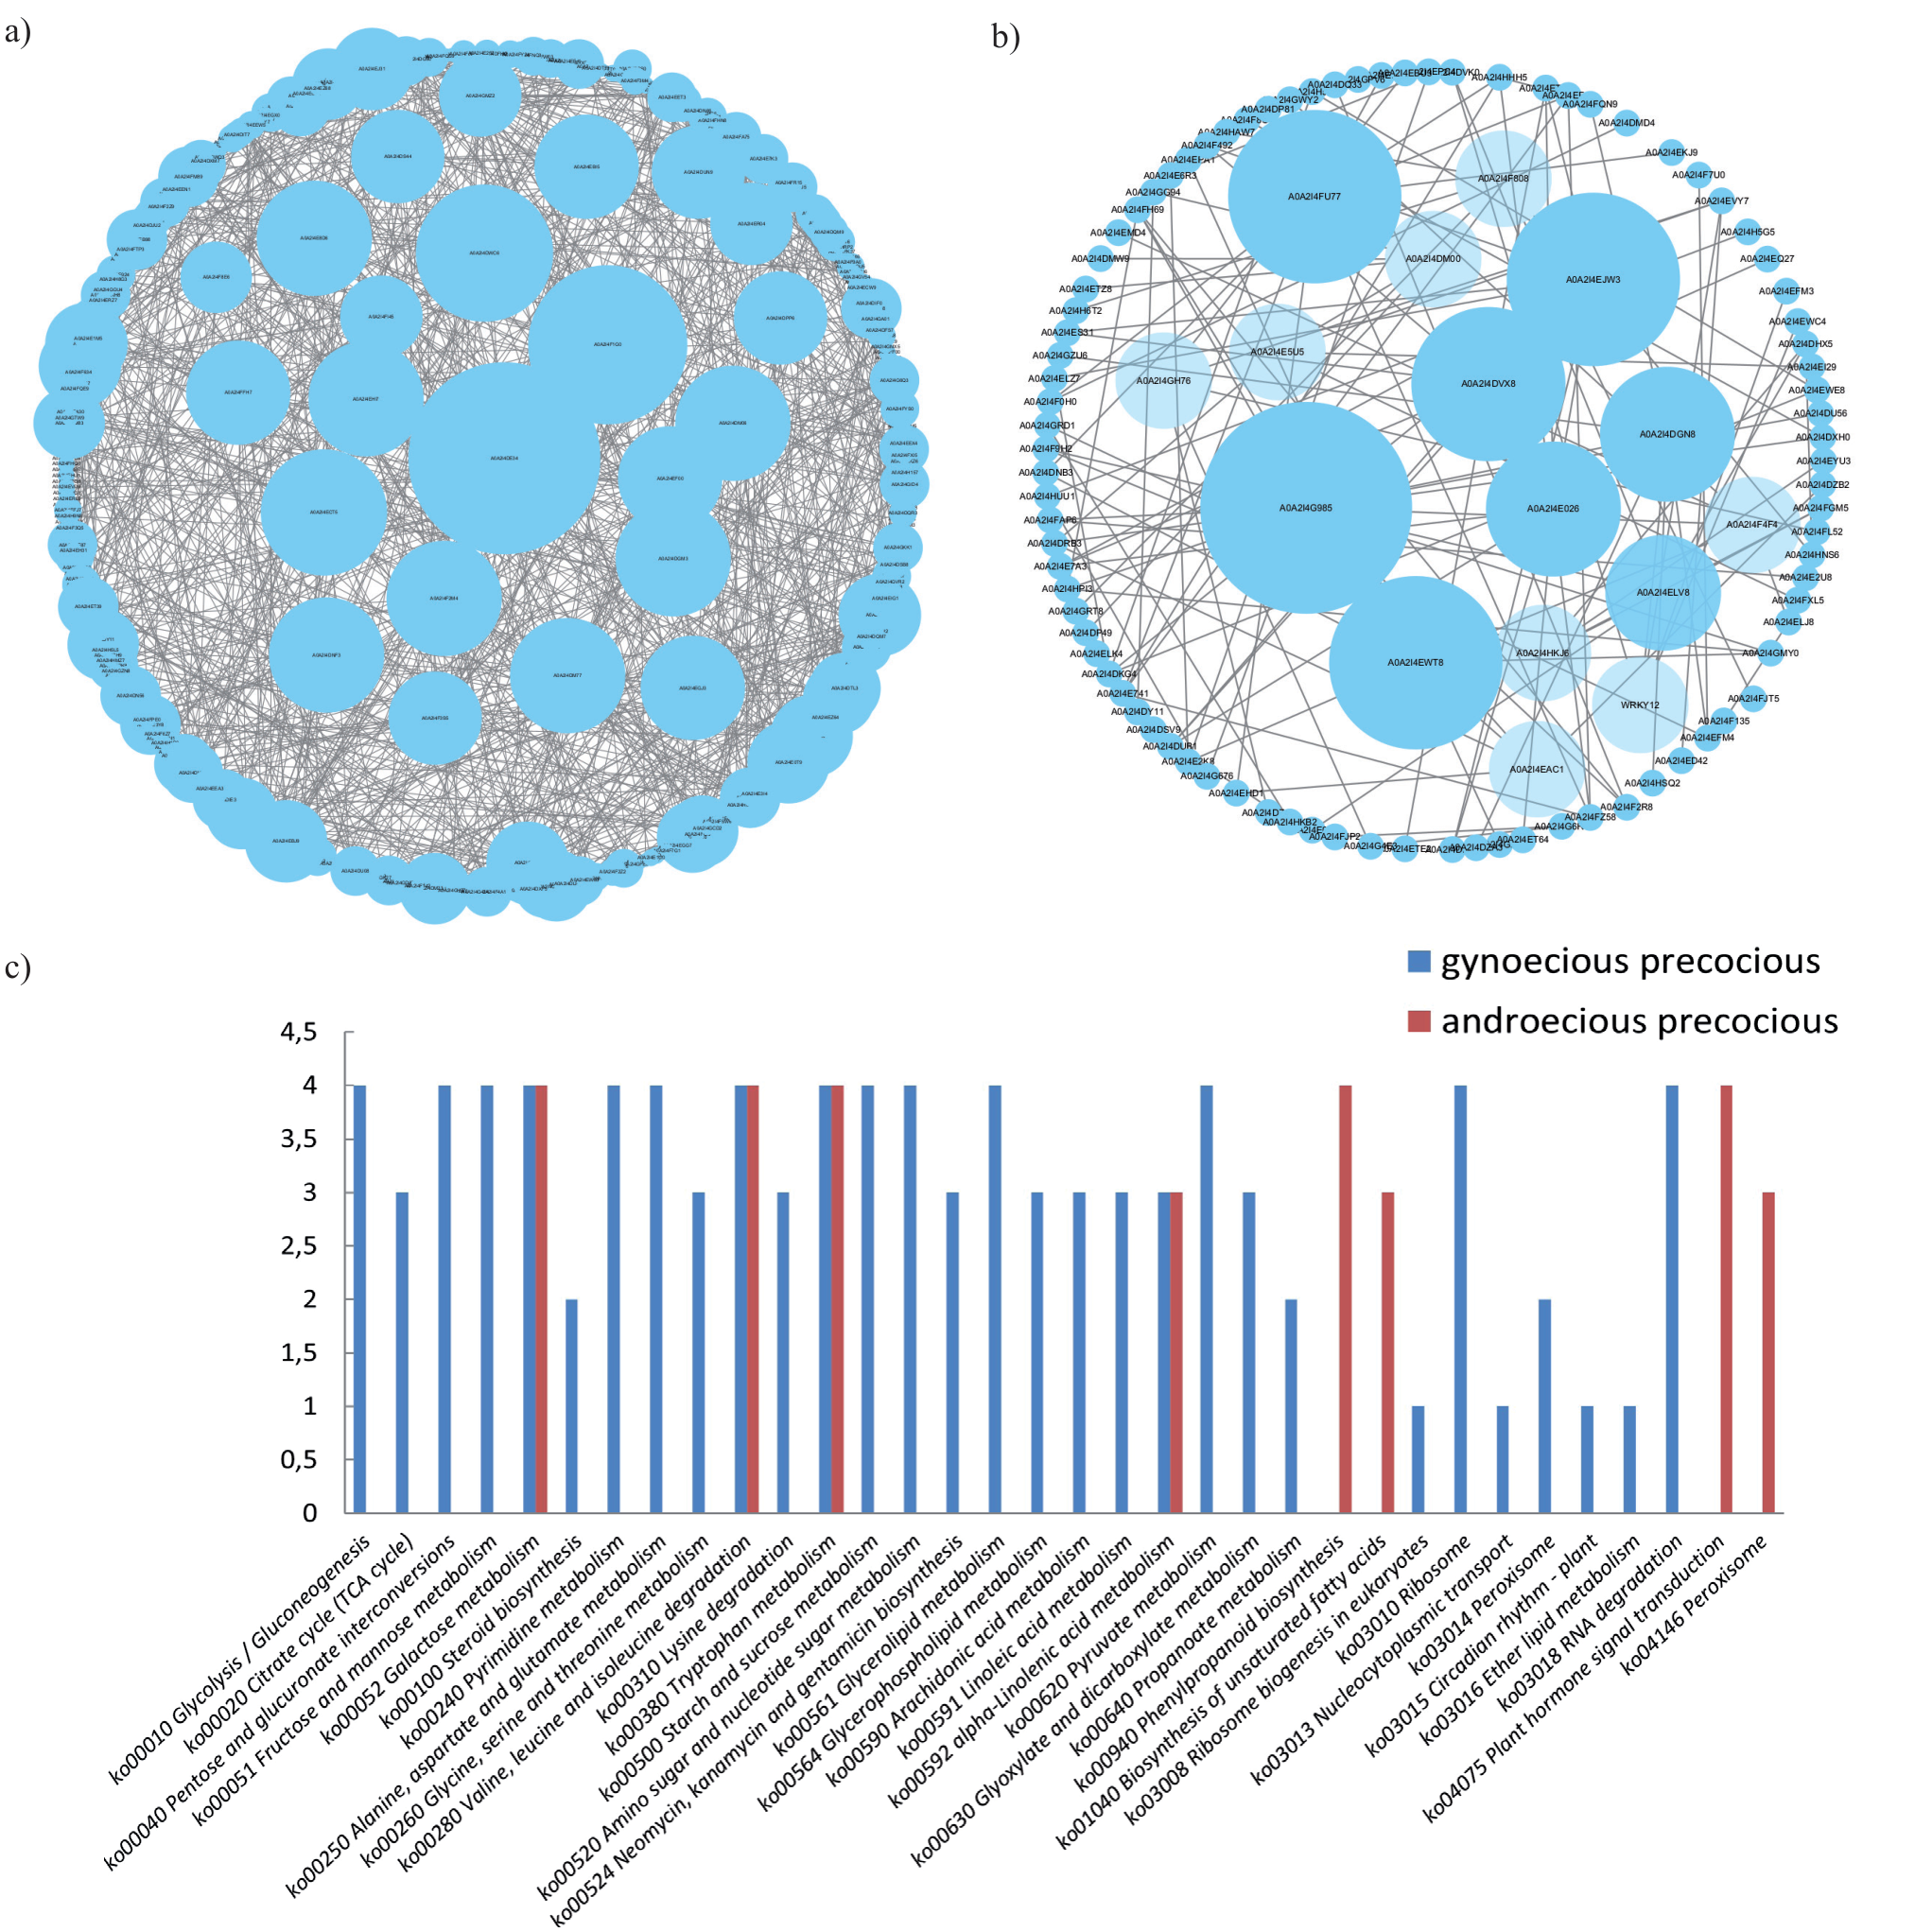
A protein-protein interaction (PPI) network graph was constructed using the genes identified in the key clusters as input, integrating known protein interaction databases. Within the PPI network, proteins with the highest number of associations were identified. Eleven key genes associated with female-predominant sex differentiation were screened: SUS3, HXK1, UGP1, RPL27AC, NMD3, CRY1, SGAT, DLS2, SDP1, CPS, and ENO1 (Fig. 6A). Additionally, ten key genes related to male-predominant sex differentiation were identified: IAA6, At3g47200, ARF6, AUX1, ARF3, KNAT1, OMT1, SRP43, KAT2, and MED28 (Fig. 6B).
Comparative analyses of the pathways associated with these key genes across the four comparative groups revealed common pathways for female-predominant and male-predominant key genes, including galactose metabolism (ko00052), valine, leucine and isoleucine degradation (ko00280), tryptophan metabolism (ko00380), and α-linolenic acid metabolism (ko00592). Male-specific pathways encompassed primary amine biosynthesis (ko00940), unsaturated fatty acid biosynthesis (ko01040), phytohormone signaling (ko04075), peroxisome (ko04146), and female-specific pathways such as glycolysis/gluconeogenesis (ko00010), the citric acid cycle (TCA cycle) (ko00020), α-linolenic acid metabolism (ko00592), pentose and glucuronate interconversions (ko00040), and additional metabolic and biosynthesis pathways.
Comparison further revealed differences in pathway composition between male-predominant and female-predominant key genes, indicative of biological disparities and differential expression of significant functions within Juglans mandshurica individuals. Detailed studies and analyses are requisite to comprehensively comprehend these differences and their impact on sex differentiation between female-predominant and male-predominant individuals in Juglans mandshurica (Fig. 6C).
Quantitative Real-Time PCR (qRT-PCR) Validation of Differentially Expressed Genes (DEGs)
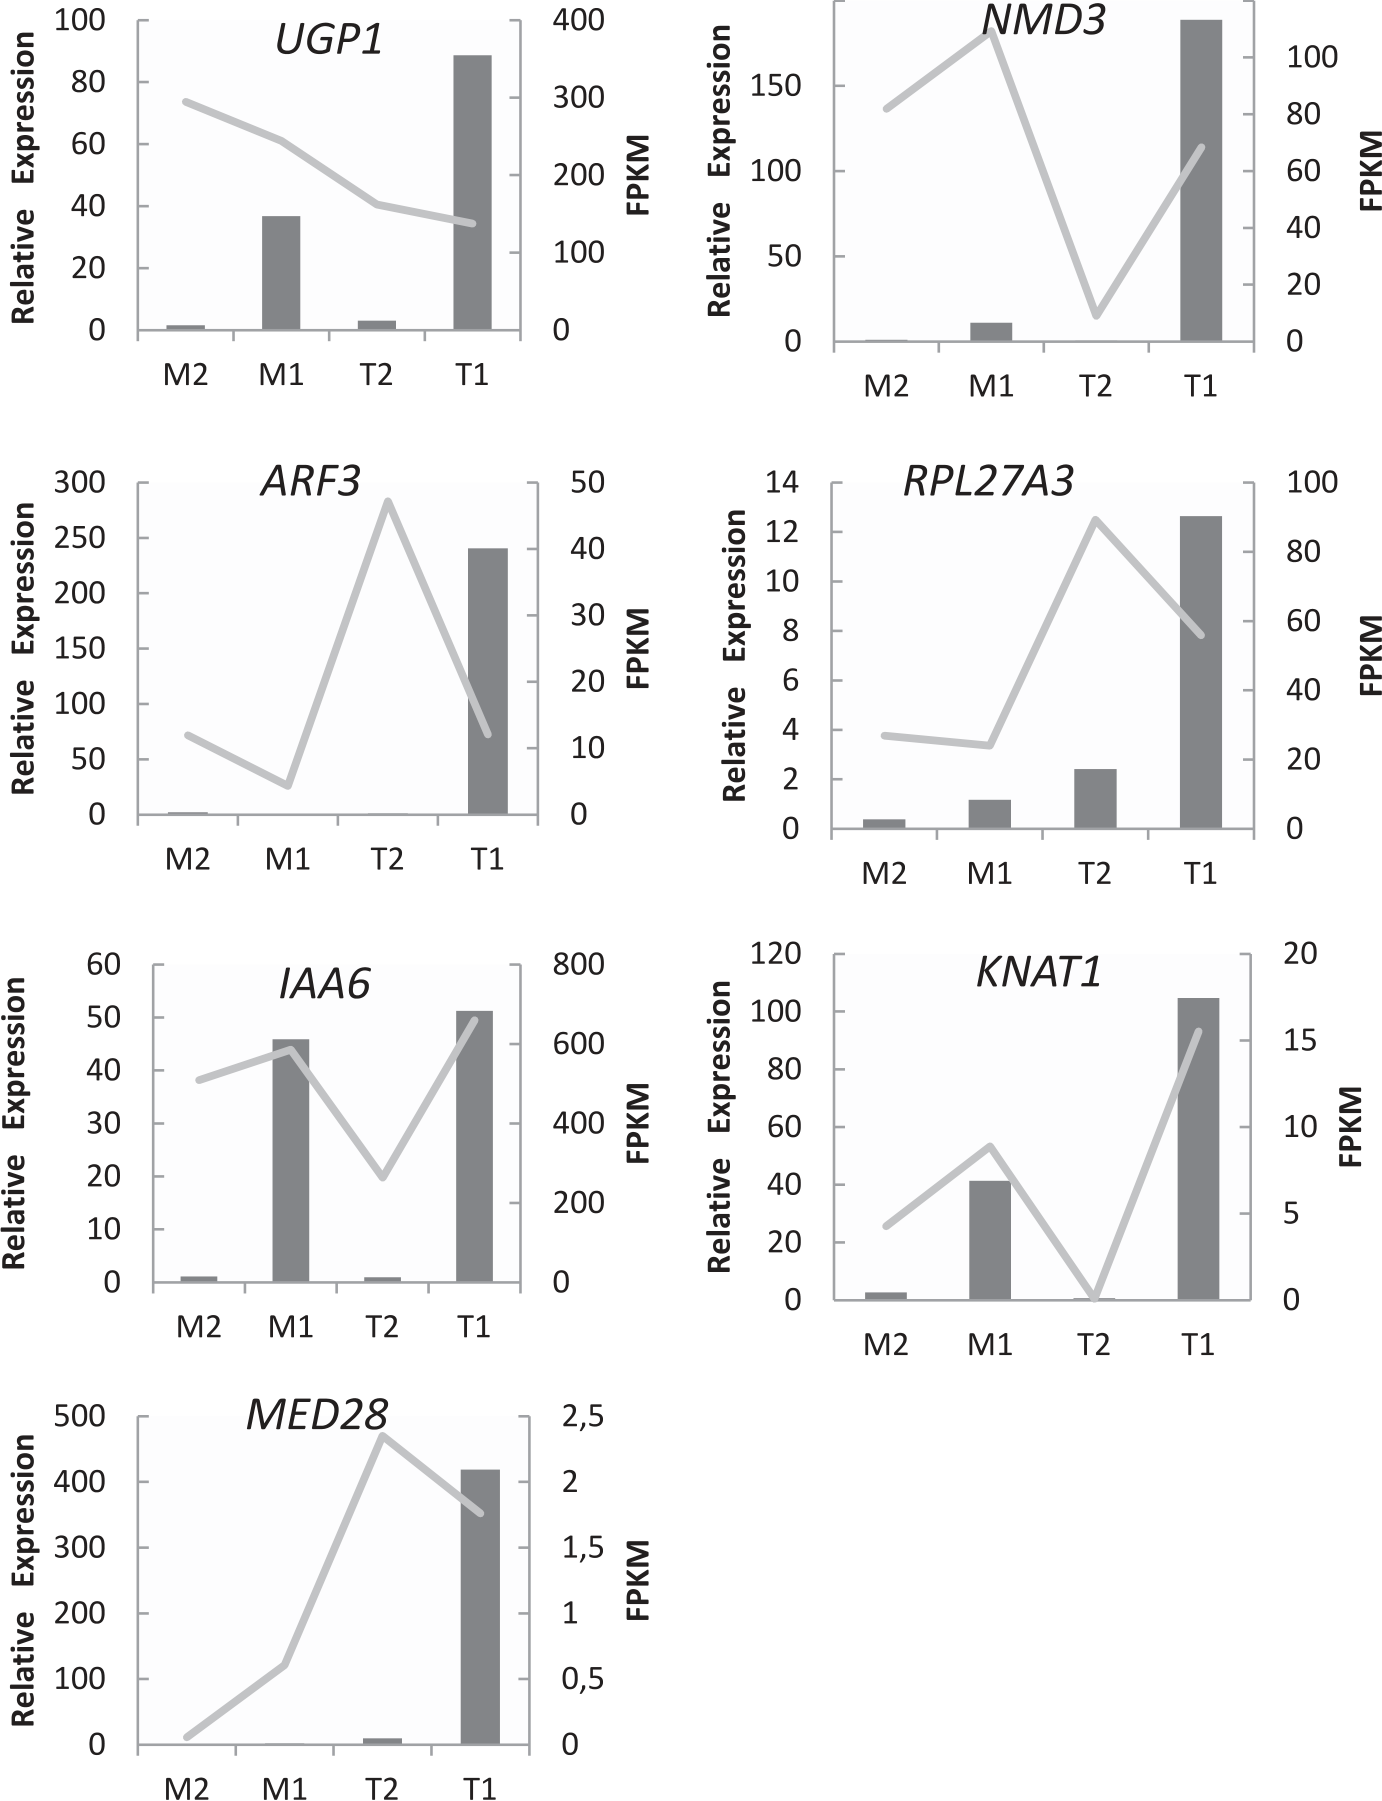
To validate the accuracy of the transcriptome data, seven DEGs were randomly selected from the differentially expressed genes screened in the four comparison groups for real-time quantitative PCR (qRT-PCR) experiments. Three biological and technical replicates were performed for each organ and gene, respectively. The results showed that the expression regulation patterns were consistent with the results obtained by transcriptome sequencing (Fig. 7). The expression of all seven genes showed the same trend between the qPCR and RNA-Seq results, indicating that the RNA-Seq data are highly reliable for further analysis.
Fig. 7.
Presents the results of the qRT-PCR analysis for the seven randomly selected key genes. The X-axis represents the different types of flower buds, while the left Y-axis represents the relative expression levels. The right Y-axis represents the FPKM values. The bars represent the qPCR while the line represents the results of RNA-seq.
Discussion
Understanding the molecular mechanisms that govern gene expression patterns in organisms represents a significant challenge in modern biology. This understanding is essential for obtaining deeper insights into the molecular underpinnings of organism development, morphology, and function. RNA-Seq is a widely adopted technique for exploring differentially expressed genes (DEGs) between female and male flowers, and has been extensively employed in various plant species [48, 49]. Leveraging the advantages of RNA-Seq technology holds remarkable potential for further elucidating the mechanisms of sex differentiation in C. hirsutus. In this study, RNA-Seq technology facilitated the identification of a substantial number of differentially expressed genes. A comparison of DEGs in male and female buds across different sets of comparative groups revealed a higher number of differentially expressed genes in male and female buds within the same type of comparison group. This observation suggests that genes play a pivotal role in influencing sex differentiation during bud development, irrespective of the prioritization of female or male buds. The varying counts of up-regulated and down-regulated differentially expressed genes in different control groups imply the presence of potential inhibitory effects during flower bud development. Consequently, further investigations could be directed towards exploring these differentially expressed genes to gain insights into abnormal flower bud development.
Through the analysis of enrichment and metabolic pathways associated with the identified differentially expressed genes (DEGs), we observed that the phytohormone signal transduction pathway exhibited the highest level of enrichment across all control groups. This finding aligns with a previously published article [50], which further validates the crucial role of phytohormones in the process of floral bud differentiation. Moreover, it provides a promising avenue for further exploration and enhancement of our understanding of the molecular mechanisms underlying bud sex differentiation. Notably, we observed variations in the enriched pathways across different control groups, predominantly involving diverse biological processes such as sugar metabolism, nitrogen metabolism, and nucleotide metabolism. These pathways and metabolic processes are likely involved in key biological events during bud differentiation, including bud growth and metabolism. Therefore, a comprehensive investigation into the roles and mechanisms of these pathways and metabolic processes in bud differentiation is warranted to uncover the intricate biological regulatory mechanisms governing the sex differentiation of male and female flower buds during physiological development.
Through bidirectional clustering heat map analysis and PPI network diagram examination, we identified 21 key genes. Among the male-predominant key genes, IAA6, ARF6, AUX1, and ARF3 were found to be associated with growth hormone-related genes, consistent with previous experimental verifications of the effect of hormones on inflorescence development [51]. Additionally, the transcription factor KNAT1, known for its homologous heterodimeric structural domain, plays a crucial role in inflorescence development, as evidenced by its significant function in several species [52, 53]. OMT1, primarily linked to phytocaffeic acid-O-methyltransferase, has been implicated in the methylation alteration pathway, possibly involved in the demethylation pathway in sex differentiation in Nutmeg buds [54]. Moreover, KAT2, known for its role in peroxisomal β-oxidation, has demonstrated effects on inflorescence meristem phenotypes [55]. Furthermore, SRP43 and MED28 were identified as components involved in RNA recognition and RNA polymerase II binding and transcriptional control of class II genes, respectively.
Conversely, among the female-predominant key genes, SUS3 and UGP1 were found to be important in sugar metabolism [56, 57], while HXK1 has been shown to play a significant role in the Arabidopsis photoperiodic pathway and phytohormone signaling pathway [58]. Similarly, CRY1 has been suggested to act as a photoreceptor regulating plant morphogenesis and GA signaling [59], while RPL27A3 and NMD3 encode ribosomal proteins. Furthermore, enzymes such as SGAT, DLD2, SDP1, CPS, and ENO1 were found to be crucial in flower bud differentiation, primarily responsible for plant photorespiration and sugar metabolism.
The observed differences between the female-and male-predominant key genes, with the former mainly involved in enzymes, sugar metabolism, and photoperiodic pathways, and the latter being primarily related to growth hormones, RNAs, and specific transcription factors, may be closely linked to the dioecious maturation mechanism of rowan. This finding holds significant theoretical and practical value, providing a scientific basis for further exploring the mechanism of rowan sex differentiation.
The high concordance between the qRT-PCR validation results and the transcriptome data attests to the accuracy and reliability of the transcriptome analysis. The qPCR results further support the differential expression patterns observed in the RNA-Seq data, indicating that the transcriptome data serve as a credible foundation for further analyses.
Sex differentiation in rowan is a complex and evolutionary process influenced by genes, environmental factors, hormones, and other regulatory factors. Despite advancements in genomics, molecular genetics, and gene mining technology, our understanding of the underlying mechanisms of sex differentiation in rowan remains limited. To further elucidate the regulatory network of sex differentiation, it is imperative to improve the existing framework by integrating multiple metabolic and pathway pathways. This comprehensive approach will facilitate a clearer understanding of the relationship between sex differentiation and the distinct flower types in rowan. Future studies should focus on analyzing the functions and interactions of key genes and advancing the gene regulatory network of sex differentiation. Additionally, establishing an internal and external multifactorial interaction regulatory network will serve as a cornerstone for studying bud differentiation and contribute to the development of high-yield and stable cultivation practices and phenotypic genetic breeding of rowan.
Conclusions
Differential gene expression analysis of male and female flower buds in Juglans mandshurica revealed 3,501 differentially expressed genes (DEGs), including 2236 up-regulated genes and 2184 down-regulated genes. This suggests distinct genetic regulation differences between female-priority and male-priority flower buds during their development. Functional enrichment analysis and pathway annotation of C. hirsutus demonstrated the involvement of complex biological processes and regulatory mechanisms in flower bud differentiation. Notably, the phytohormone signal transduction pathway was identified as the most significantly enriched pathway, highlighting the important role of phytohormones in flower bud differentiation.
Bidirectional clustering heat map analysis was employed to identify key genes associated with sex differentiation in female-predominant and male-predominant flower buds. A total of 11 key genes involved in female-predominant sex differentiation were identified, including SUS3, HXK1, UGP1, RPL27AC, NMD3, CRY1, SGAT, DLS2, SDP1, CPS, and ENO1. Similarly, 10 key genes involved in male-predominant sex differentiation were identified, including IAA6, At3g47200, ARF6, AUX1, ARF3, KNAT1, OMT1, SRP43, KAT2, and MED28. The metabolic pathways associated with these key genes displayed significant variability, highlighting the importance of metabolic pathways in the study of sex differentiation.

