Introduction
The presence of phosphorus in natural water has become the main factor in water pollution, and the presence of high-level phosphorus in water often leads to eutrophication [1, 2]. This will lead to the outbreak of cyanobacteria, which will seriously damage the ecological environment of the water body, resulting in the death of a large number of aquatic organisms, such as fish. The algal toxins and algal odor substances produced by cyanobacteria bloom will also directly affect the safety of drinking water and ultimately affect human health and life safety [3]. Therefore, in order to reduce the impact on the environment, the purification of phosphate has become a top priority.
Currently, chemical precipitation, biological processes, and adsorption methods have been developed to remove phosphorus from water [4, 5]. Among the various technologies used to remove phosphate, the adsorption method can steadily remove phosphate from water. In addition, compared to other methods, the adsorption process has attracted much attention due to its advantages such as low cost, easy operation, and simple design [6]. There are various materials that can adsorb PO43-, such as metal oxides [7], fly ash [8, 9], and red mud [10, 11], which were used to remove phosphate. However, non-specific interactions between these adsorbents and phosphates often result in poor selectivity.
Metal-organic frameworks are currently receiving a great deal of attention in the adsorption and removal of phosphate. Compared with the above traditional solid adsorbents, MOFs show more advantages. Metal-organic skeleton (MOF), as a multifunctional nanoporous material, is composed of a crystal network structure of metal ions or metal clusters coordinated with organic ligands. Because they not only have open metal sites, but also high porosity and a high specific surface area, they create sufficient active sites for ion adsorption. The rich functional group composition of MOFS can improve their adsorption selectivity for target metal ions. Therefore, MOFs have great advantages in adsorption elimination. [12, 13]. To date, various metal- organic frameworks (MOFs) have been applied to the adsorption of aqueous pollutants. For example, by adjusting the molar ratio of Fe to Al in the precursor solution, a series of AL-MIL-101 analogs were synthesized to remove phosphate [14]; two stable metal-organic frameworks (MOFs) based on amine-functionalized NH-MIL-101 (Al/Fe) with trivalent aluminum and iron were synthesized by a simple solvothermal method and used as adsorbents to trap high strength phosphate ions [15]; the preparation of UiO-66-NH2 using an amine substitution system and the high selectivity of phosphates shown by UiO MOFs make it an effective and selective adsorbent for the removal of phosphates from water and urine[16]; a magnetic composite of a FeO core and a carbon shell (MFC) functionalized with UiO-66 (represented as MFC@ UiO-66) was used to stably adsorb phosphate [17]; the high selectivity of the iron-based organic framework (MOF) NH2-MIL-101 was used to adsorb phosphate solution [18].
Magnesium (Mg) is widely distributed in nature and can be used in rare earth alloys, metal reduction, corrosion protection, and other fields. However, for Mg-MOF-74 materials, previous studies mainly focused on gas adsorption; for example, Mg-MOF-74 is synthesized and functionalized with TEPA to improve the CO2 adsorption performance under dry and wet conditions. Magnesium is widely distributed in nature and can be used in rare earth alloys, metal reduction, corrosion protection, and other fields. The adsorption capacity of the functionalized amino Mg-MOF-74 (TEPA-MOF) for CO was 26.9 wt %, while the original MOF was 23.4 wt % [19-21], but the application of this material in phosphate adsorption is rarely studied.
Cerium (Ce) is one of the most abundant rare elements on earth and has considerable application in fields such as magnetics, phosphors, alloys, and catalysis [22, 23]. The interest of the research community in Ce-MOF has increased significantly due to the unique nature of Ce. The synthesis time of Ce-MOFs is short, and the energy consumption is relatively low compared to other metal frames. Therefore, it is feasible to use Ce-MOFs as adsorbents for contaminated water. Recently, we prepared Ce-MOF by solvothermal synthesis and used it for simultaneous adsorption removal of phosphorate, fluorine, and arsenic from water (V) [24]. Interestingly, a novel adsorbent Ce (III) impregnated crosslinked chitosan complex (Ce-CCS) was prepared by the film-forming and crosslinking methods and used to remove phosphate from an aqueous solution [25]. Cerium-zirconium binary oxide nano-adsorbents were synthesized by the solvothermal method and showed high adsorption of phosphate [26]. As one of the most active rare earth metal oxides, CeO2 has a strong oxygen storage capacity. In the current study, cerium oxide nanoparticles showed high adsorption capacity for various harmful anions (such as phosphate, fluoride, and arsenic), especially Ce (III) /Ce (IV) substances, which played an important role in the adsorption of phosphate [27].
However, so far, few studies have been reported on using Ce/Mg-MOF-74 to remove phosphate from water. In this study, in continuation of our work, we synthesized Ce/Mg-MOF-74 by the solvothermal method and used it to remove aqueous phosphate. The adsorption kinetics and adsorption isotherms, effects of different Ce/Mg molar ratios, crystallization temperature, pH, contact time, and initial concentration of phosphate solution were also investigated. Compared with other MOF materials, Ce/ Mg-MOF-74 has the advantages of greater adsorption capacity and stronger recovery ability. This indicates that Ce/Mg-MOF-74 is a relatively stable adsorbent with great phosphate adsorption potential in water.
Experimental
Materials
All of the reagents used in the experiment were analytical reagent grade and were used without further purification. Cerium nitrate (Ce (NO3)3·6H2O), magnesium nitrate (Mg (NO3)2·6H2O), and ferric nitrate (Fe (NO3)3) were purchased from Tianjin Chemical Reagent Factory No.4. 2,5-dihydroxyterephthalic acid (C8H6O6) and N, N-dimethylformamide (DMF) were obtained from Guangdong Guanghua Technology Co., Ltd. Methanol (CH3OH) and ethanol(C2H5OH) were purchased from Xilong Science Co., Ltd.
Synthesis of Ce/MOF-74
Mg-MOF-74 was synthesized by a solvothermal method according to a reported process with slight modification [28]. A certain amount of magnesium nitrate hexahydrate (1.33 g) and 2,5-dihydroxyterephthalic acid (0.31 g) were weighed and dissolved in a mixture of DMF, deionized water, and absolute ethanol (DMF: ethanol: deionized water = 15: 1: 1, v/v/v). Then, after stirring the clarified solution, it was poured into a 100 ml Teflon-lined vessel and heated at 125 ℃ for 24 h. After being cooled to room temperature, it was centrifuged and washed with DMF several times, and then the precipitate was soaked in methanol for three days. During this period, fresh methanol was replaced every 12 hours. The resulting solid was centrifuged and dried at 160 ℃ under a vacuum overnight to obtain a yellow Mg-MOF-74.
For comparison, Fe-MOF-74 was also prepared by adding Fe (NO3)3 (1.27 g) instead of Mg (NO3)2·6H2O. The only difference between the prepared Ce/Mg-MOF-74 and the prepared Mg-MOF-74 was that magnesium nitrate hexahydrate (1.33 g) and cerium nitrate hexahydrate (1.63 g) were added at the same time.
Adsorption Experiments
Firstly, 0.8788 g KH2PO4·H2O was obtained accurately and dissolved in a 1L volumetric flask with distilled water to create a standard liquor with a concentration of 100 mg L-1 and diluted to the corresponding concentration during the experiment. Add the Ce/Mg-MOF-74 with a ratio of 0.4 g L-1 to the phosphate solution with a concentration of 100 mg L-1 at room temperature and stir with a stirrer rotating at 350 r min-1. After 3 h, the sample was filtered by a 0.25 μm membrane, and then the concentration of phosphorus solution was measured by a Uv-vis spectrum at a wavelength of 543 nm.
Analytical Methods
A standard curve of absorbance-phosphate concentration was plotted based on the measured absorbance of phosphate; the equation was obtained as follows: y = 2.05735x – 0.00895, R2 = 0.9999. Then the amount of adsorption could be calculated using the following equation:
Where qe is the equilibrium concentration of phosphate (mg/g), C0 and Ct are the initial and equilibrium concentrations of phosphate (mg/L), respectively. V is the volume of the solution (L), and m is the mass of adsorbent added.
Results and Discussion
Characterization
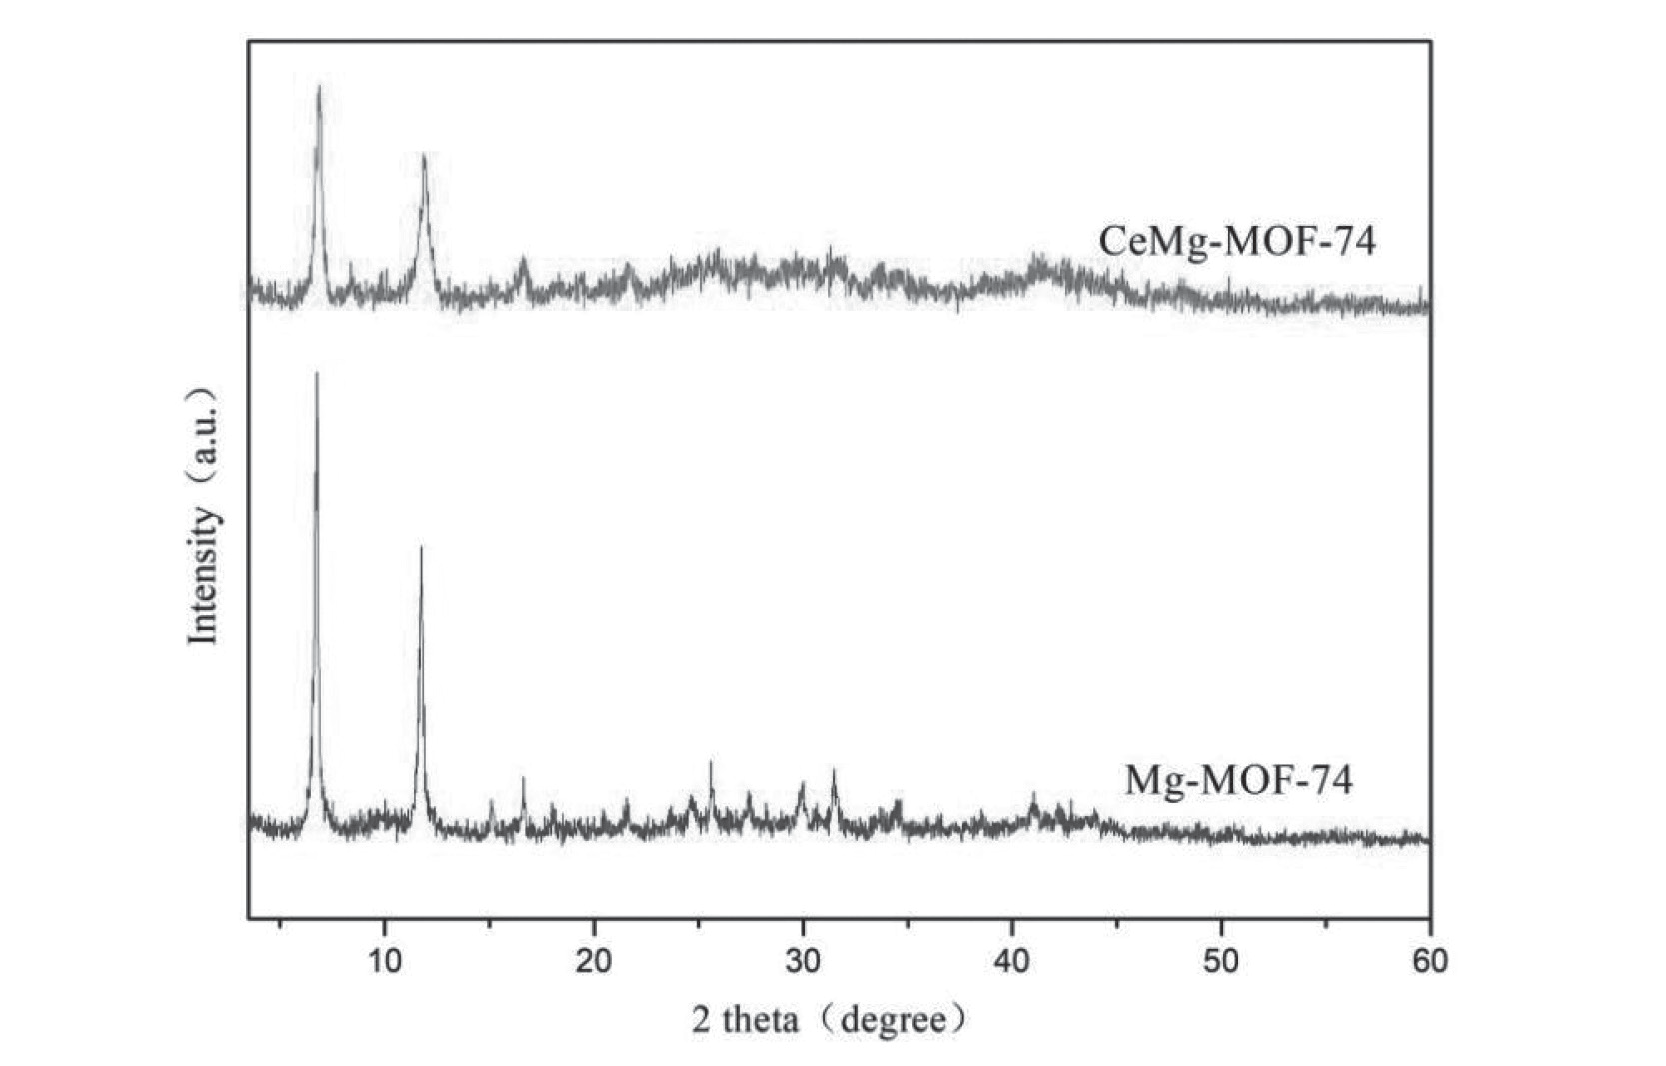
The crystal structure and composition of Mg-MOF-74 and Ce/Mg-MOF-74 were examined by XRD measurement. As shown in Fig. 1, the diffraction peaks of Mg-MOF-74 and Ce/Mg-MOF-74 at 2Θ = 6.8° and 2Θ = 11.7°, which correspond to the (210) and (300) planes in MOF-74 crystal, respectively, are in good agreement with the patterns reported in ref [29]. Thus, after doping with Ce, the crystalline structure of Mg-MOF-74 was maintained.
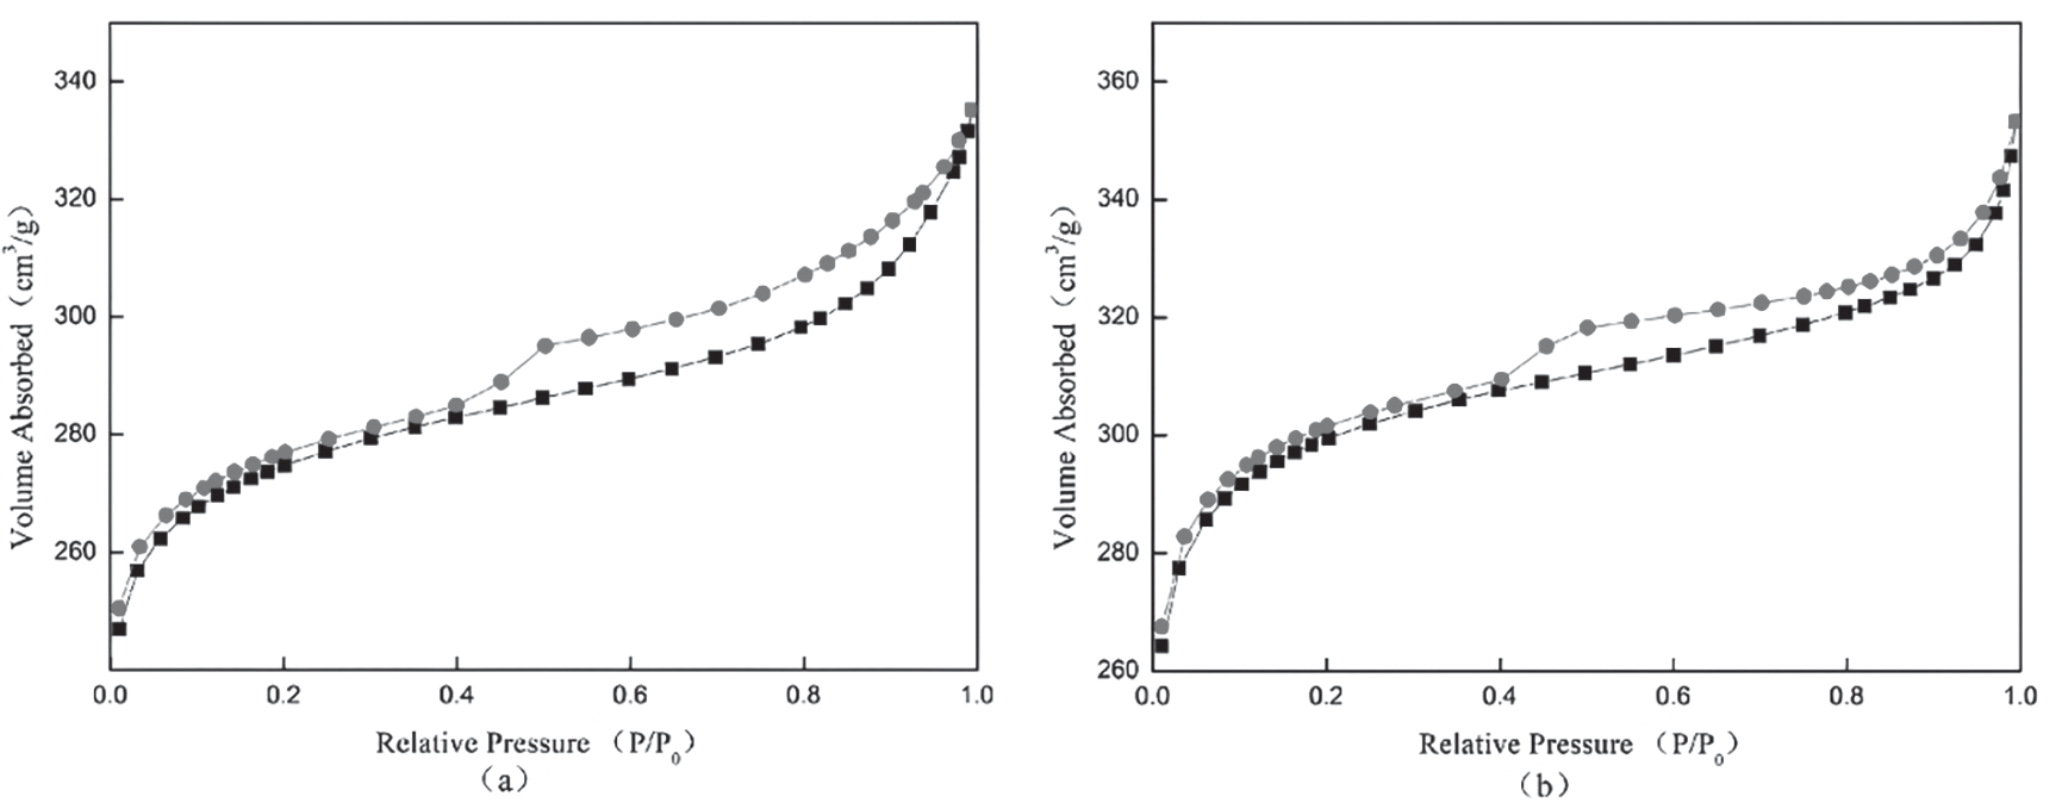
The surface area and porosity of prepared Mg-MOF-74 and Ce/Mg-MOF-74 were analyzed by N2 adsorption-desorption tests at 77K. As shown in Fig. 2(a) and 2(b), two samples exhibited a type IV isotherm according to IUPAC classification, indicating microporous structures [30]. The BET surface areas of Mg-MOF-74 and Ce/Mg-MOF-74 are 925.9 m2 g-1 and 1006.5 m2 g-1, respectively. The pore diameters are 2.27 nm and 2.10 nm, respectively. Interestingly, the specific surface area of the material increased slightly after doping with Ce. Compared with undoped Mg-MOF-74, the specific surface area of Ce/ Mg-MOF-74 is larger, which may be because the addition of Ce reduces the crystal size of nanoparticles, improves the specific surface area and pore volume during the material production process, and reduces the collapse of the material pores. This phenomenon can make the distribution of adsorption sites more abundant and uniform, which is conducive to full contact between the adsorbent and the active site on the adsorption surface, and improve the adsorption efficiency [31, 32].
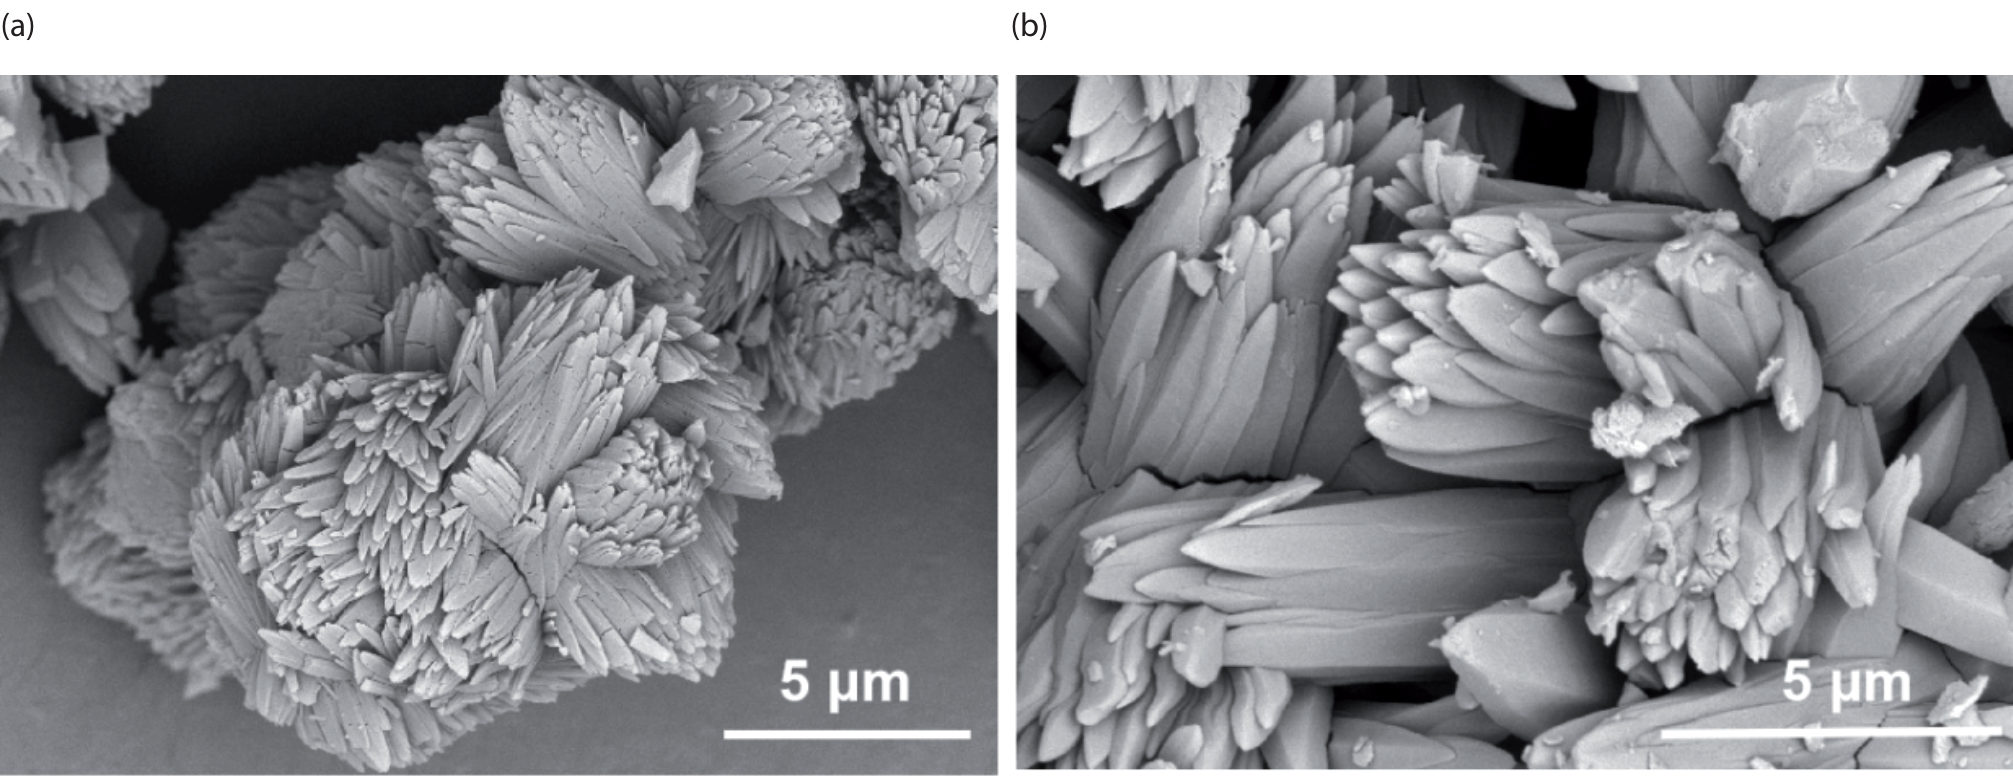
The morphology of Mg-MOF-74 and Ce/Mg-MOF-74 was also studied by SEM. Fig. 3(a) and Fig. 3(b) show the SEM images of Mg-MOF-74 and Ce/ Mg-MOF-74, respectively. The two MOFs exist as petal-like aggregates with a length of 5-15 μm crystals, which demonstrate that Ce doping does not affect the petal-like structure of Mg-MOF-74. Therefore, the shape and size of the two absorbents are almost complete, indicating that there is a slight change in morphology and no skeleton collapses [33].
The chemical composition and surface species of Ce/ Mg-MOF-74 investigated by XPS spectra are shown in Fig. 4. The survey XPS spectrum (Fig. 4(a)) presents Ce and Mg as contained in the Ce/Mg-MOF-74. The high-resolution Mg 1s spectrum (Fig. 4(b)) at about 2303.18 eV could be attributed to Mg2+ [34]. As for Ce 3d (Fig. 4(c)), it has four peaks, in which the main peak binding energy of Ce 3d5/2 is 885.2 eV and that of Ce 3d3/2 is 904.6 eV. The two peaks at 882.1 eV and 900.8 eV are Ce 3d5/2 and Ce 3d3/2 of Ce4+, and the two peaks at 885.7 and 904.6 eV are Ce 3d5/2 and Ce 3d3/2 of Ce3+, which proves that cerium ions exist in the form of Ce4+ and Ce3+ [35, 36].
The Effects of Different Parameters on Adsorption Capacity
Ce/Mg Molar Ratio
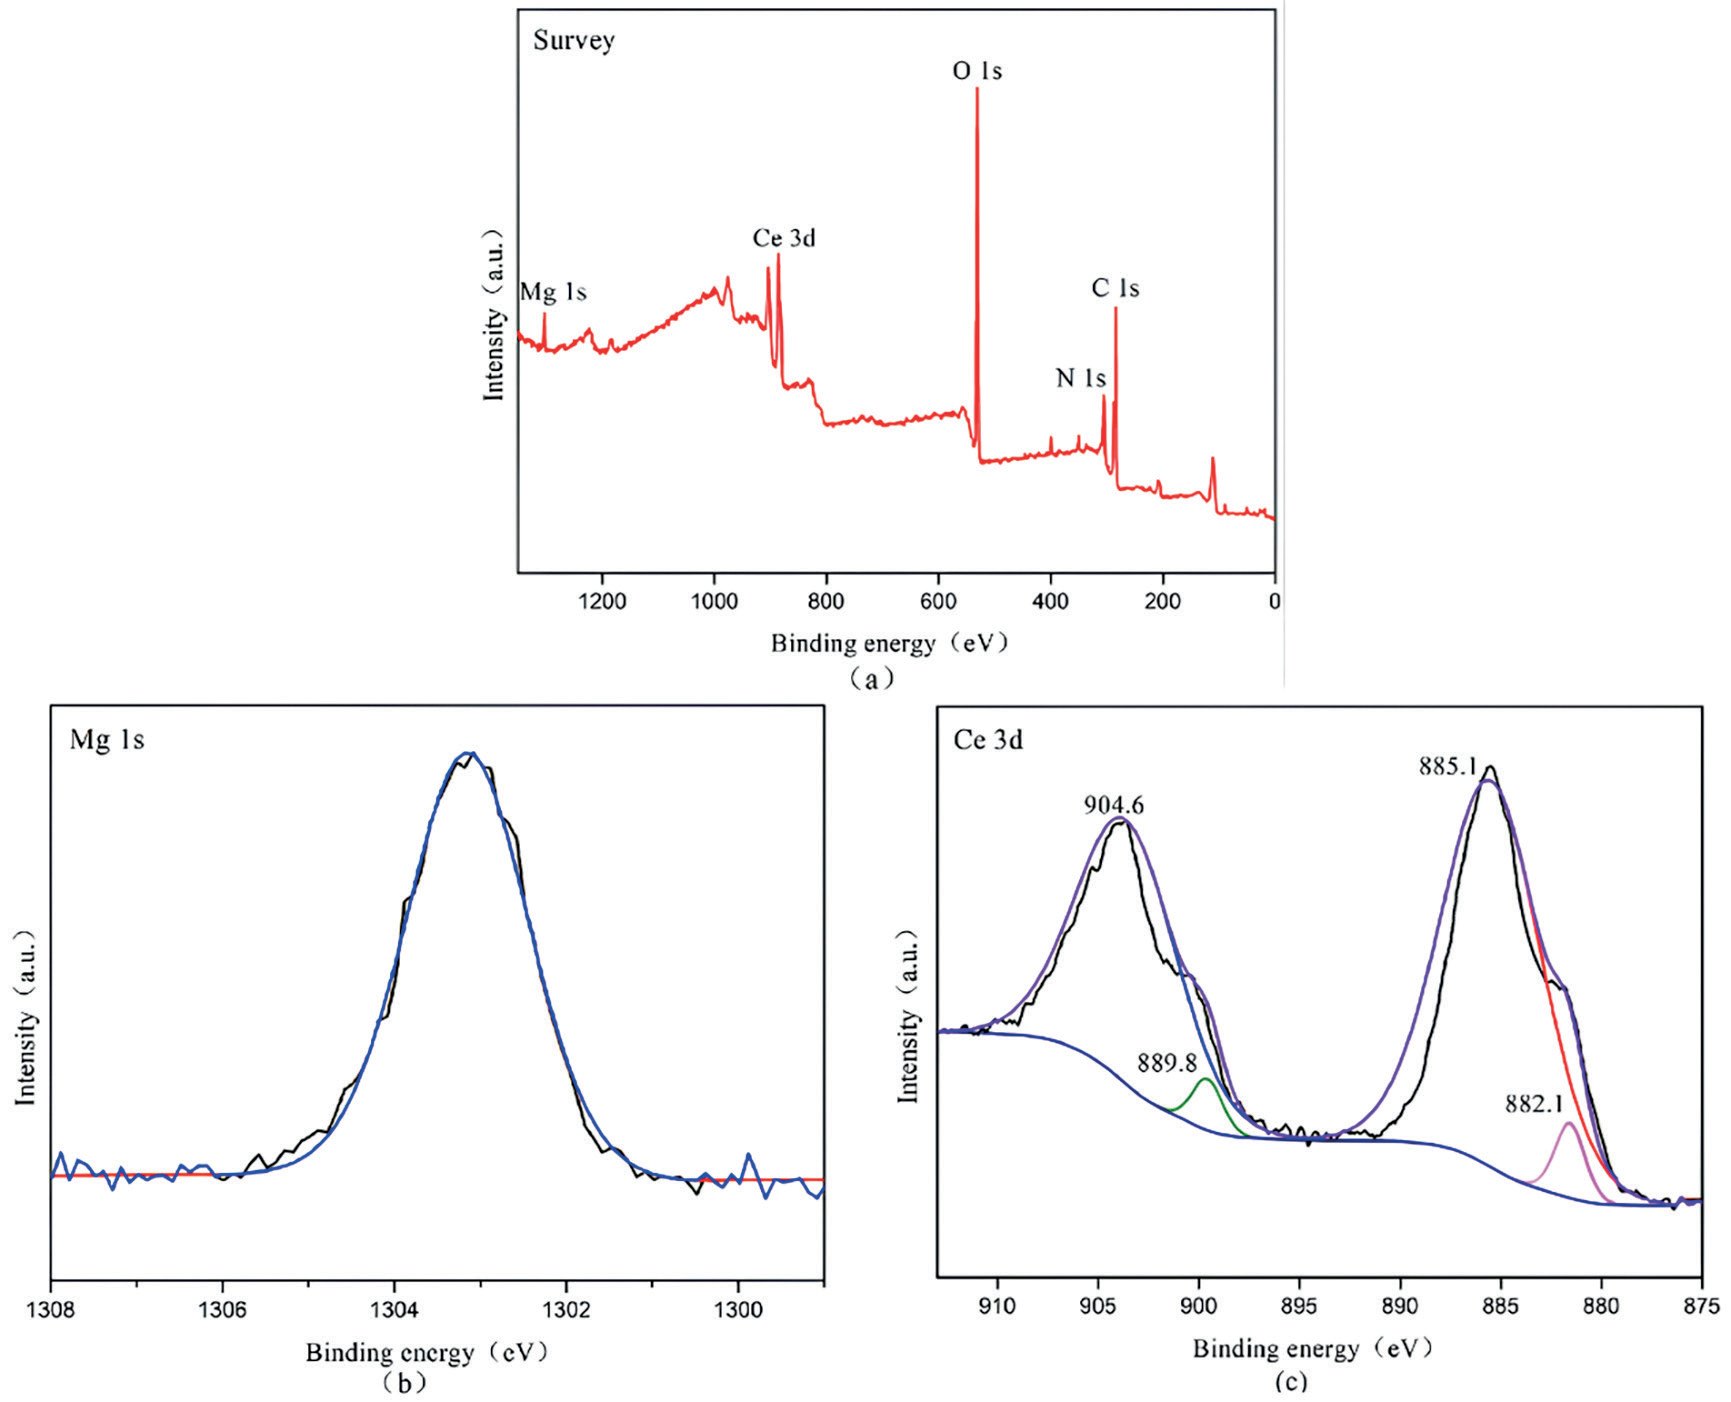
Fig. 5.
(a) molar ratio of mental, (b) crystallization temperature on adsorption capacity in the different conditions of synthesis.
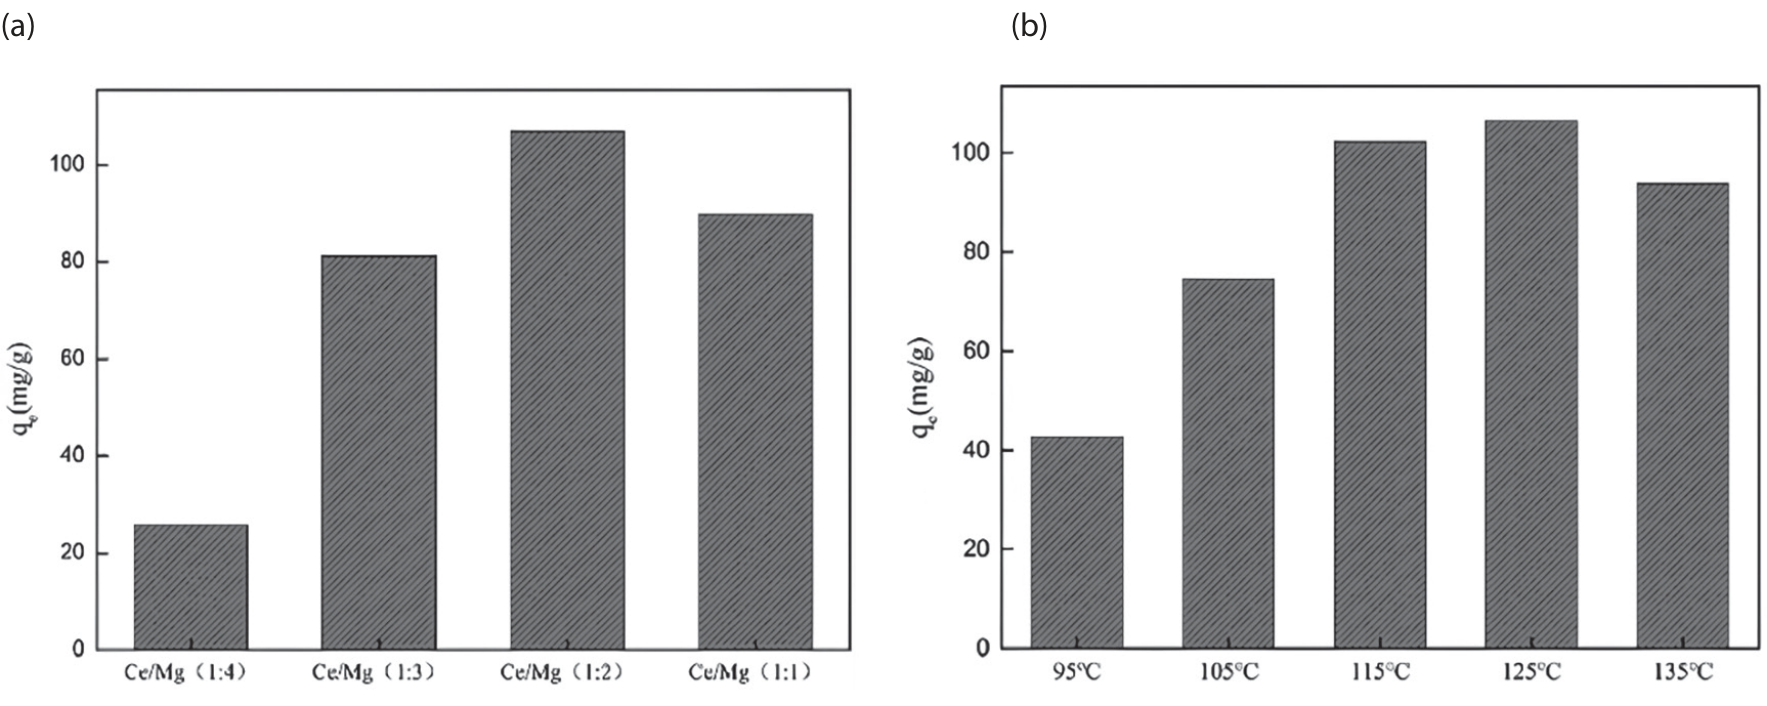
Ce/Mg-MOF-74 with different Ce/Mg molar ratios was synthesized and applied in phosphate adsorption. As shown in Fig. 5(a), the adsorption capacity for phosphate increased with the increase in the ratio of Ce/Mg from 0.25 to 0.5, but further increases resulted in a decrease. Therefore, 0.5 was selected as a suitable Ce/Mg ratio in the following study.
Crystallization Temperature
As is shown in Fig. 5(b), the adsorption capacity was found to increase obviously when the synthesized temperature was increased up to 125℃; its adsorption capacity was 50 mg/g. Then, further increments in temperature did not increase the adsorption capacity. Therefore, 125℃ was used in the synthesis.
Initial pH
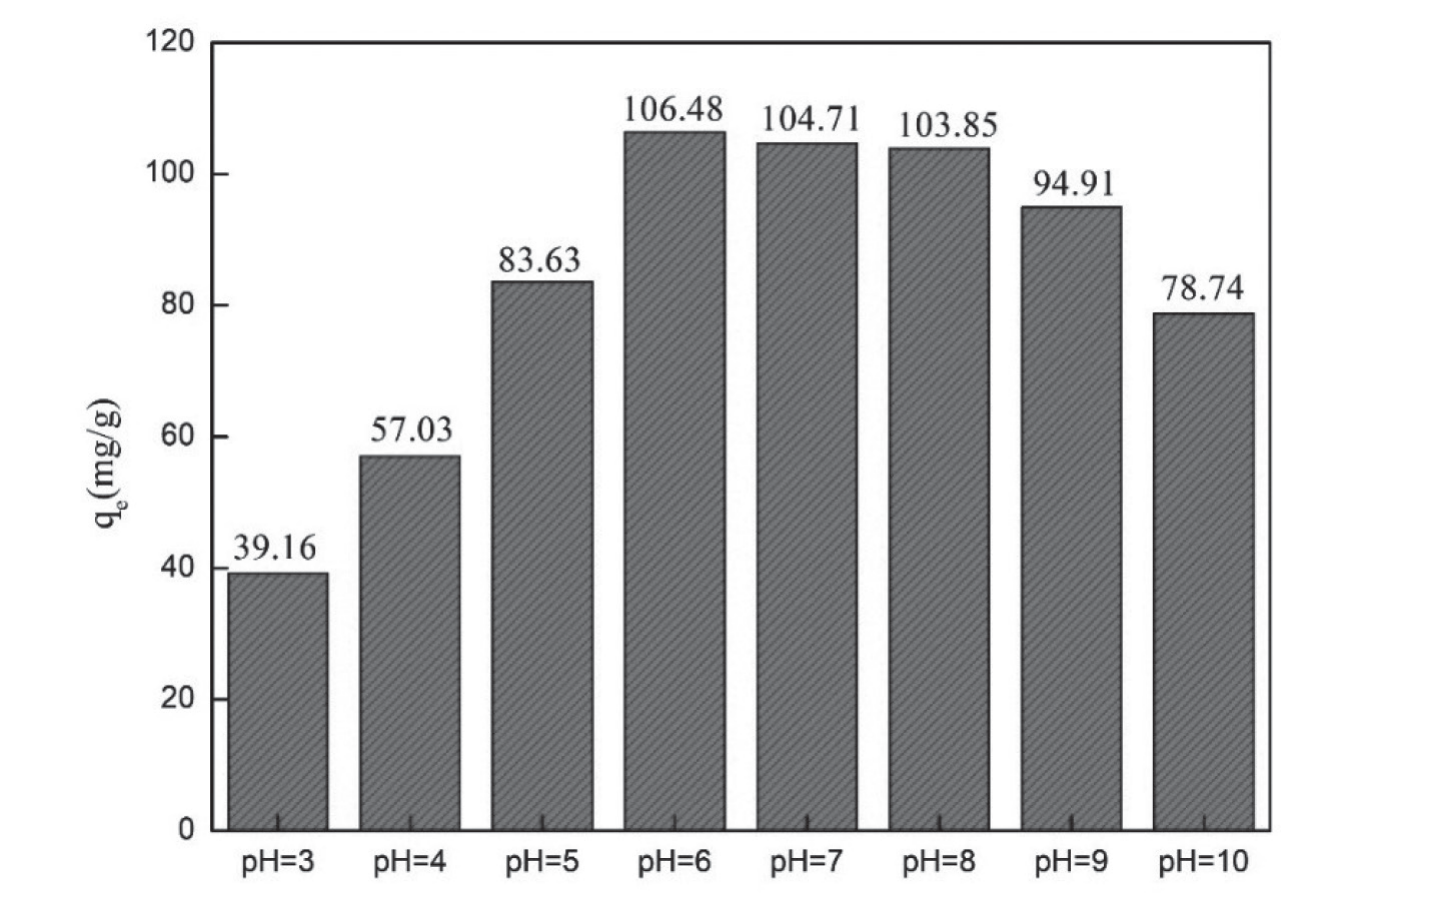
The effect of initial pH on the adsorption capacity of phosphates by Ce/Mg-MOF-74 with the same reaction conditions (the dosage of Ce/Mg-MOF-74 was 0.2 g L-1, the temperature was 298 K, and the initial concentration of the phosphate solution was 10 mg L-1) is shown in Fig. 6. Ce/Mg-MOF-74 was found to perform well with phosphate removal in a region of pH 6–8, and the optimum adsorption was achieved at 106.5 mg/g. However, as the pH value increased to above pH 9, the adsorption of phosphate gradually decreased. The effect of pH value on the adsorption of phosphate by Ce/Mg-MOF-74 may be due to the influence of pH value on the existing form of phosphate and the surface charge of the adsorbent [37]. The dissociation equilibrium of phosphate is as follows:
H3PO4↔ H2PO4-+H+↔ HPO42-+2H+↔ PO43-+3H+
When the pH reaches 3-6, the phosphate in the solution mainly exists in the form of H2PO4-, and the adsorption site affinity with Ce/Mg-MOF-74 gradually increases, and the amount of phosphate adsorption increases gradually. When the pH was 6-8, the phosphate in the solution mainly exists in the form of HPO42-, and has the strongest affinity with Ce/Mg-MOF-74, which achieved the maximum phosphate adsorption capacity. With the increase in alkalinity, OH- and PO43- compete for the adsorption sites of Ce/Mg-MOF-74, resulting in the adsorption capacity of phosphate decreasing gradually.
The Contact Time
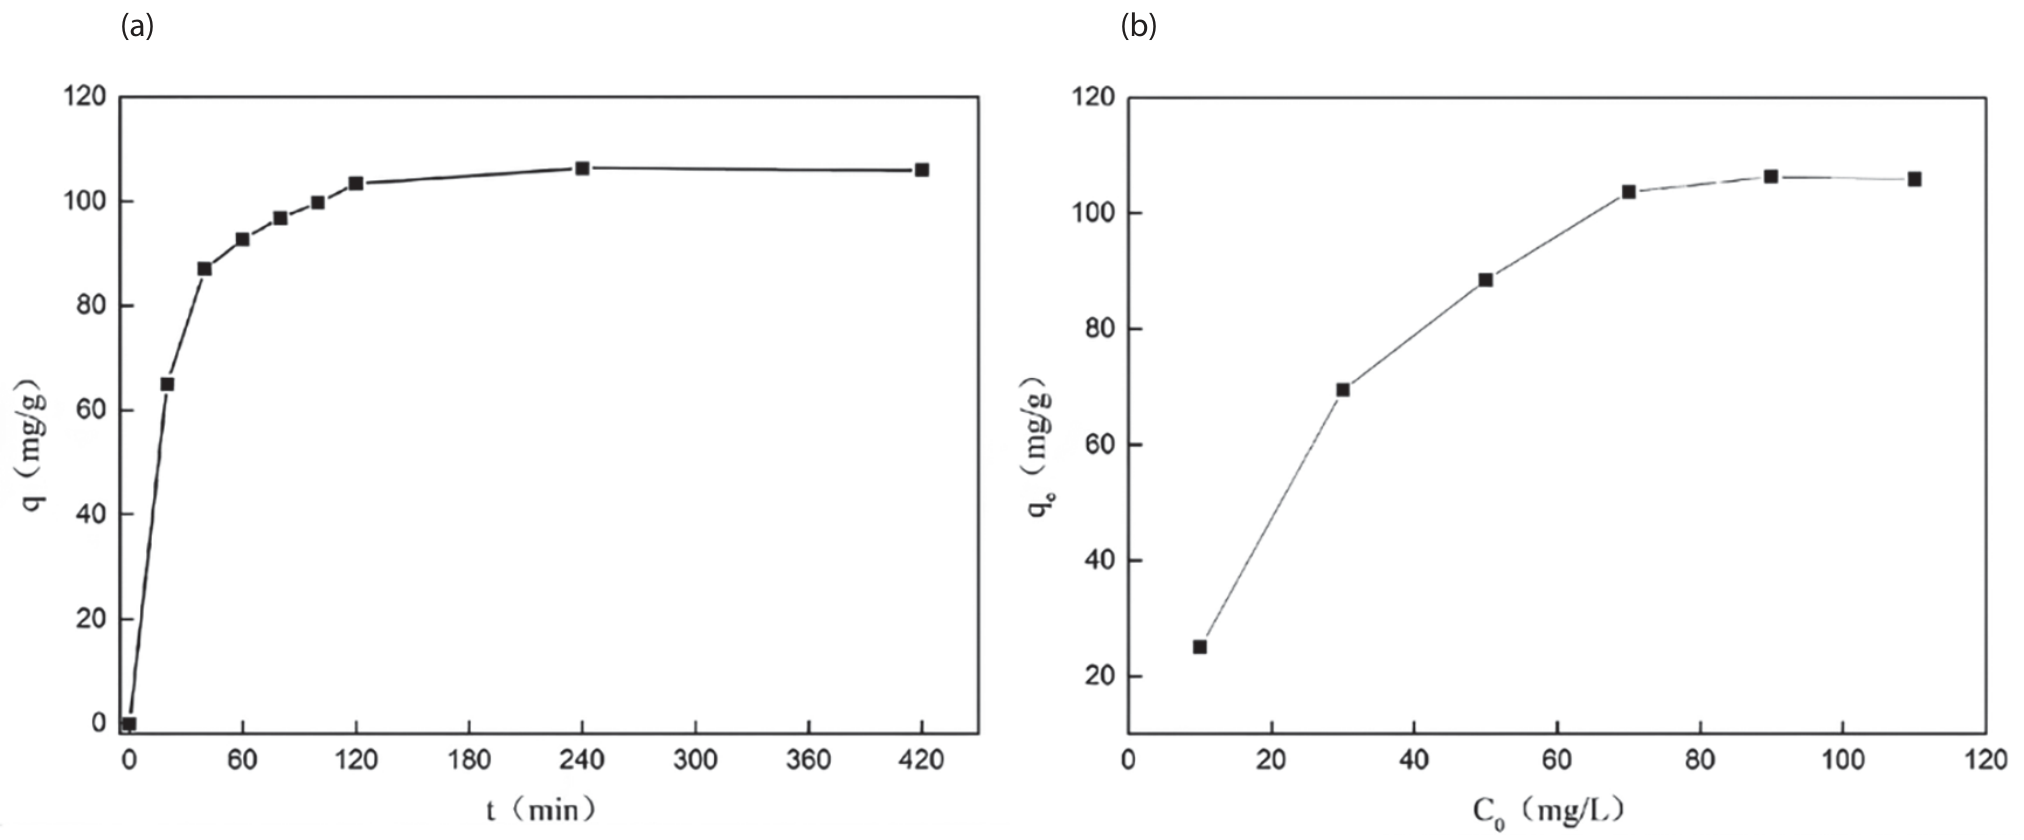
The effect of contact time on the adsorption of phosphate by Ce/Mg-MOF-74 was explored in the experiment, and as shown in Fig. 7(a), it could be concluded that the adsorption capacity increases rapidly during the 0-30 min. Within 30-120 min, it increased slowly and remained unchanged. That might be due to the fact that active sites on the surface of Ce/Mg-MOF-74 were gradually reduced, the adsorbents in the solution diffused to the interior, and the adsorption became slow [38]. Therefore, the time of adsorption equilibrium was 120 min.
Different Initial Concentration of Phosphate
In the same condition of dosage of the adsorbent and pH value (40 mg·L-1 and pH = 6), the effects of different initial phosphate concentrations on the phosphate adsorption of Ce/ Mg-MOF-74 were studied at a temperature of 25℃ and pH=5 when the adsorbent dosage was 40 mg L-1, as shown in Fig. 7 (b). As the initial phosphate concentration increases, the number of phosphate ions available for adsorption also increases and then tends to equilibrium. This is because when the initial concentration increases the amount of phosphate increases more and more, and the increase of adsorbent will provide a driving force to promote the migration of adsorbent to the adsorbent; that is, a large number of phosphates migrate to the surface of Ce/Mg-MOF-74, and the adsorption capacity increases. When the initial concentration increases to a certain value, the adsorption site of the adsorbent is fully occupied, and the adsorption capacity of Ce/Mg-MOF-74 basically reaches saturation, so the adsorption capacity is almost unchanged. The equilibrium is reached. It can be seen that when the phosphate and initial concentration is about 70 mg/L, the adsorption capacity of the adsorbent reaches equilibrium, and its value is 106.4 mg/g.
Adsorption Isotherm
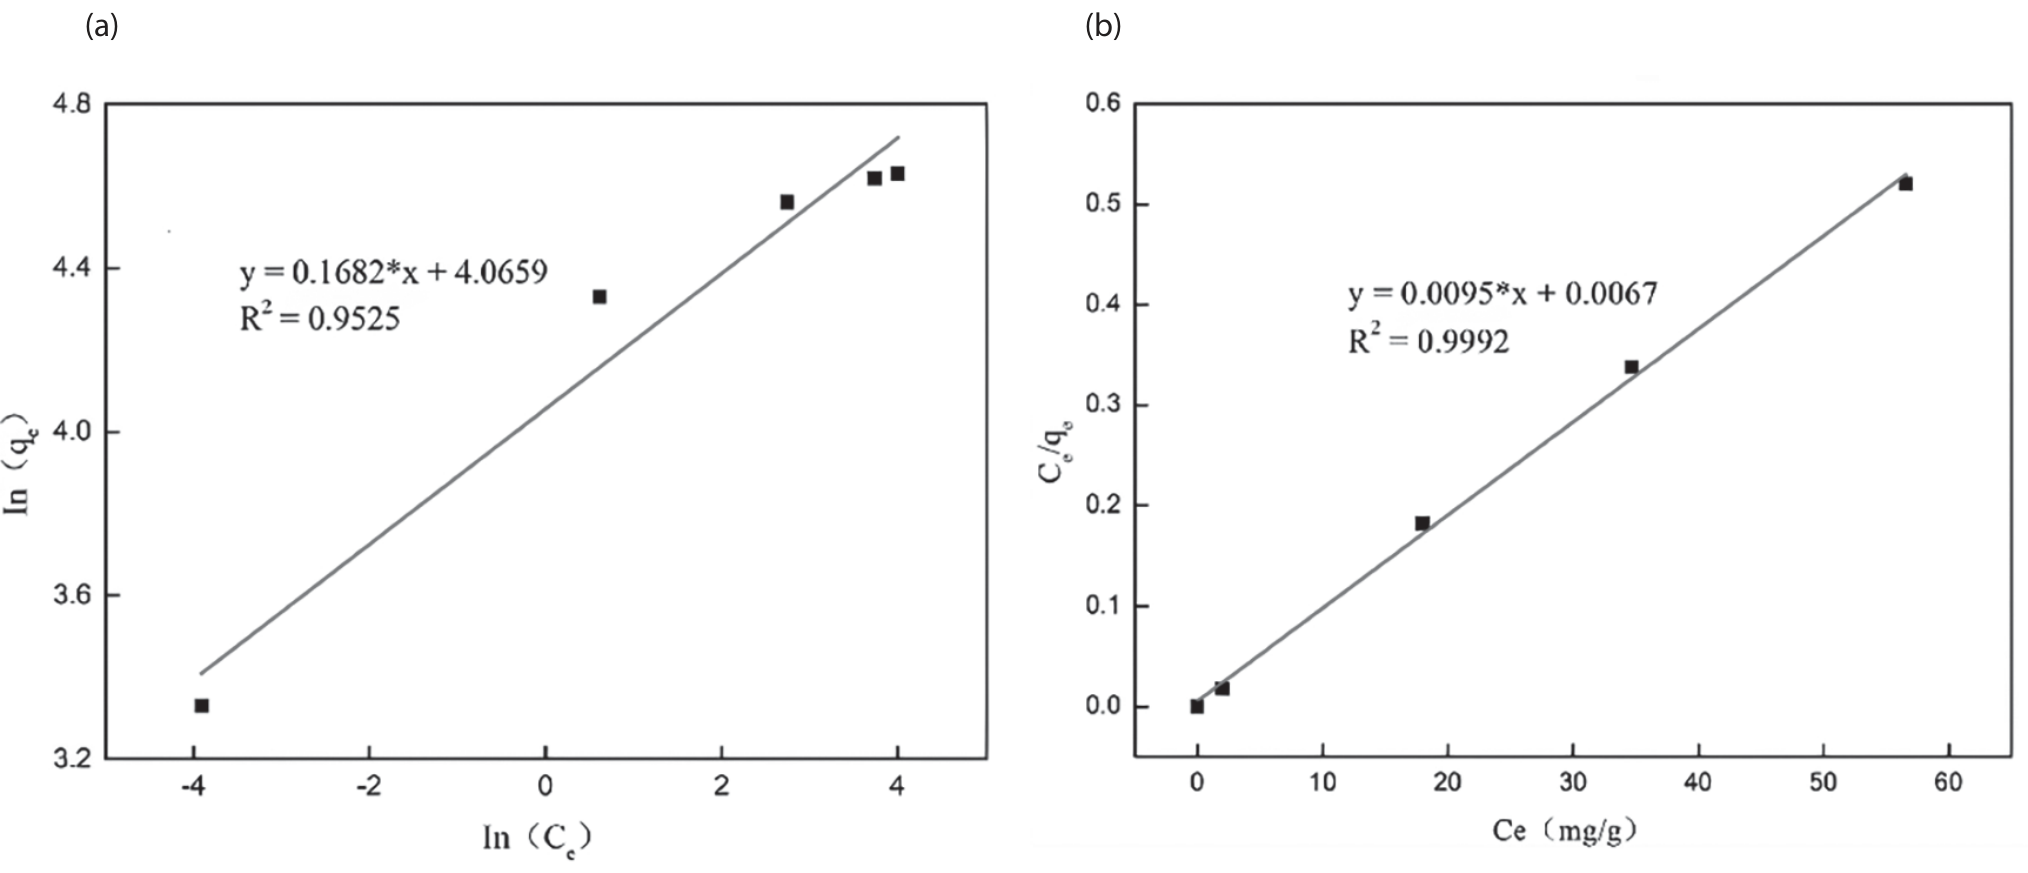
The Langmuir model and Freundlich model were selected for this experiment to understand the process of adsorption [45]. The adsorption isotherm describes the relationship between the concentrations of the molecules at the interface of two phases. Ferundlich isotherm (1) has successfully described the actual adsorption, which is represented by the following equation:
The Langmuir adsorption isotherm (2) was expressed as:
Where KL is a constant (L/mg), qe is the equilibrium adsorption capacity of phosphate at equilibrium (mg/g), qm is the maximum adsorption capacity (mg/g), and Ce is the phosphate concentration at equilibrium (mg/L).
When Ce/qe is plotted Ce, as shown in Fig. 8(a), the Langmuir isotherm adsorption equation is y = 0.0095x + 0.0067 (R2 = 0.9992). The calculated data are shown in Table 1. The correlation coefficient fitted by the Langmuir isotherm model was higher, and the adsorption data of Ce/ Mg-MOF-74 met the characteristics of the Langmuir isotherm model.
Adsorption Kinetics
To understand the adsorption process of phosphate on Ce/Mg-MOF-74, the pseudo-first-order, and the pseudo-second-order kinetic models were used [39], which are shown below as (1) and (3), respectively:
Where qe and qt are the amounts of phosphate at equilibrium and at any time t. K1 is the first-order equilibrium rate constant (min-1), and K2 is the second-order equilibrium rate constant (g (mg·min)-1). The experimental data is added to the models by the linear regression method. It was found that the correlation coefficient of the pseudo-first-order model was lower than that of the pseudo-second-order model (q2e = 105.3 mg/g, which is very close to the experimental value of 106.4 mg/g), indicating that the pseudo-second-order kinetic model would better describe the adsorption process of phosphate on Ce/Mg-MOF-74. The results are shown in Fig. 9 and Table 3, respectively. It concluded that the process was chemical adsorption. In addition, we compared the adsorption capacity of other MOFs to phosphate, and specific information is shown in Table 2.
Fig. 8.
(a) The pseudo-firs-order model and (b) the pseudo-second-order model plots for phosphate adsorption on Ce/Mg-MOF-74.
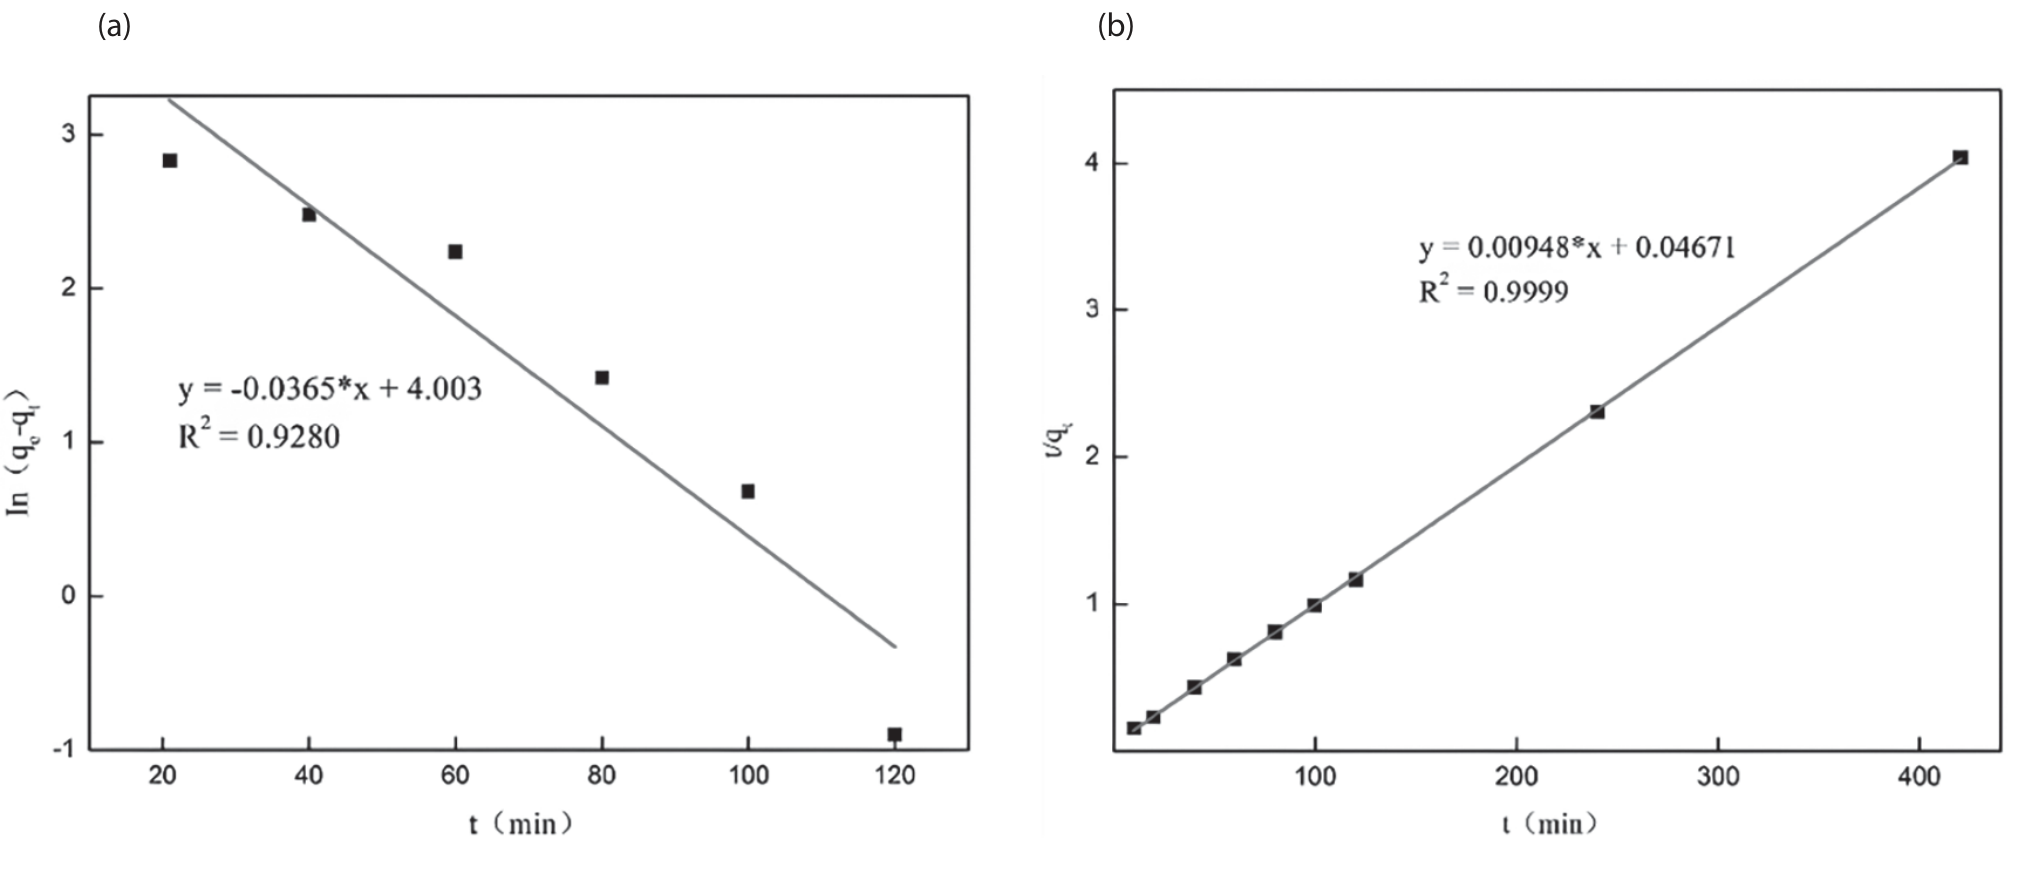
Table 2.
Adsorption capacities of various MOFs for phosphate.
Reusability
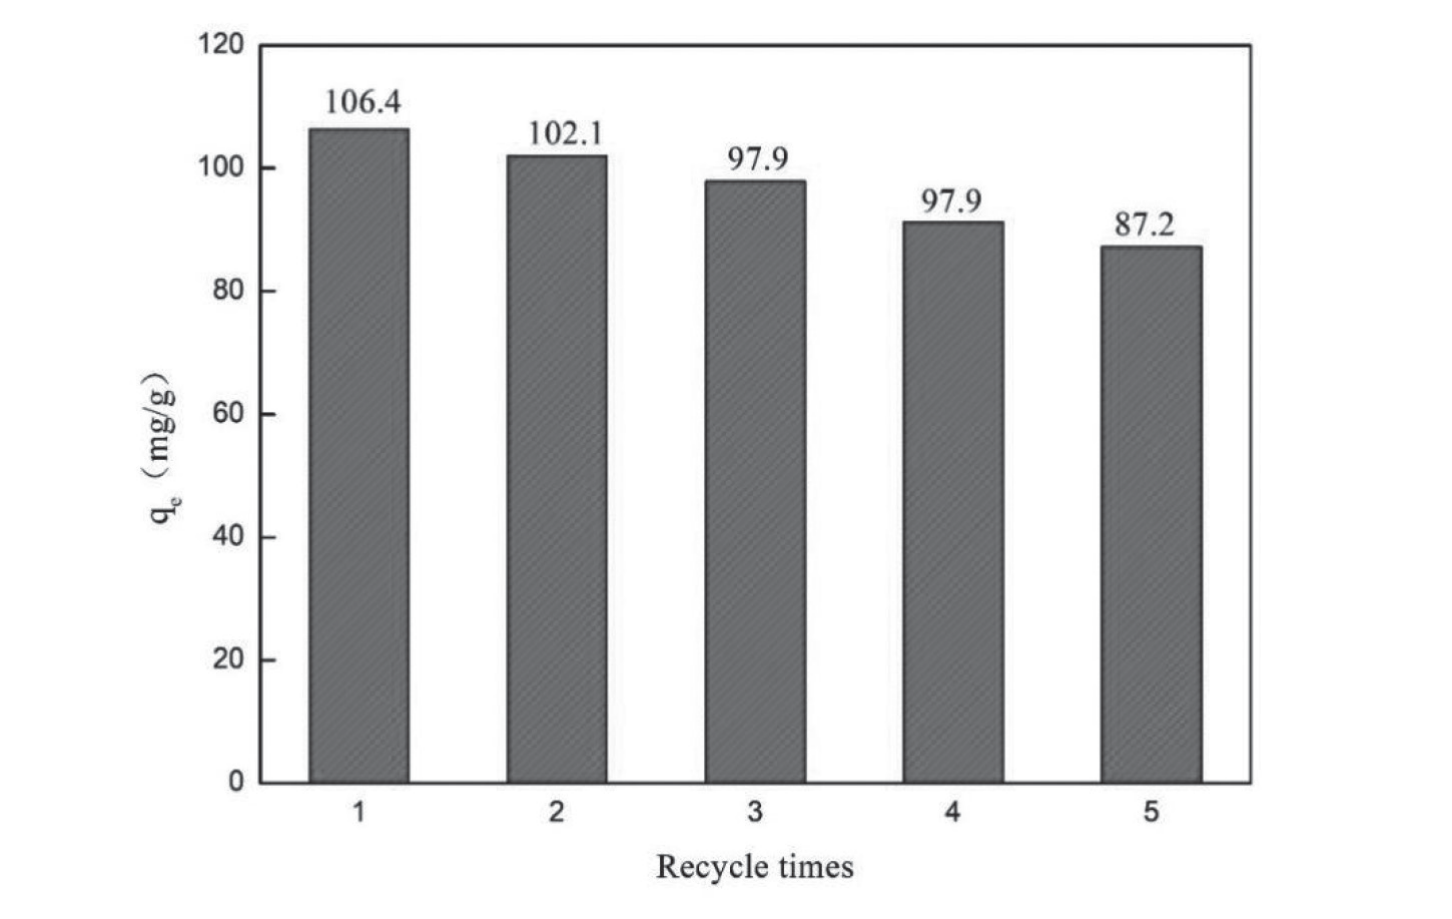
The reusability of an adsorbent is one of the important factors in a cost-effective process of water treatment. The used Ce/Mg-MOF-74 material was washed many times with ethanol and dried at 90℃ for 18 hours of regeneration. Fig. 10 showed that after even five cycles, the adsorption capacity was reduced by less than 20%, which indicated that Ce/Mg-MOF-74 is a comparatively renewable adsorbent.
Conclusions
In this study, Ce/Mg-MOF-74 with different Ce/ Mg molar ratios was synthesized. It was found that Ce/ Mg-MOF-74, with a Ce/Mg molar ratio of 1:2 at pH 6 and a crystallization temperature of 125 ℃, achieved a maximum adsorption capacity of 106.4 mg/g. In addition, after doping with Ce, the specific surface area of Ce/Mg-MOF-74 increased due to the decrease in crystal size [31, 32]. This makes the distribution of adsorption sites more abundant and uniform, which is conducive to full contact between adsorbents and the active sites on the adsorption surface and improves the adsorption efficiency. Furthermore, the process of adsorption to remove phosphate was consistent with the pseudo-second-order model, which indicated it was chemisorption. After 5 cycles, the adsorption capacity of the adsorbent was reduced by less than 20%, indicating that Ce/Mg-MOF-74 was also a comparatively stable adsorbent with good potential for phosphate adsorption in water applications, even more than Ce-MOF. In short, compared with other MOF materials, Ce/Mg-MOF-74 exhibits superior adsorption capacity and enhanced recovery performance, thus demonstrating its relative stability as an adsorbent. However, the synthesis process of Ce/Mg-MOF-74 may be relatively intricate and costly, necessitating further research and improvement.
Table 3.
Adsorption kinetics of phosphate on CeMg-MOF-74.
| Pseudo first order adsorption kinetic model | Pseudo second order adsorption kinetic model | ||||
|---|---|---|---|---|---|
| q1e (mg/g) | k1 (min-1) | R2 | q2e (mg/g) | k2 (g/mg·min) | R2 |
| 54.6 | 3.7×10⁻² | 0.928 | 105.3 | 1.5×10⁻³ | 0.9999 |