

Introduction
Ecological environmental protection and green low-carbon development are major social issues that concern all mankind. Urban development has its own dynamic law of change. At different stages of development, cities have different forms of expression. According to previous studies, many theories on green and low-carbon urban development have been confirmed. Economists such as Marshall have enriched the theory of endogenous urban growth. The “centripetal force” of urban development depends on three factors: labor market sharing, input-output linkages, and knowledge spillovers. However, many urban diseases caused by pollution, traffic congestion, crime, etc., have gradually become the “centrifugal force” of urban development. Rational Growth Theory (RGT) was developed in response to the urban sprawl that has led to urban growth maladies such as land waste, high pollution, high energy consumption, and high carbon transportation. The core contents of rational growth theory are:
(2) Enhance the transformation of existing communities and redevelopment of abandoned land; (3) Promote intensive urban development and reduce the cost of infrastructure use; (4) Improve the quality of the ecological environment to achieve sustainable urban development.
From the practical point of view of urban development in China, provincial capital cities, as the administrative centers of provincial units, have a higher political level. While obtaining more public and supporting resources, provincial capital cities also have greater power to allocate resources. The spatial expansion of provincial capital cities is conducive to transferring or relieving the non-provincial functions of cities, thereby broadening the space for the survival and development of cities. The expansion of provincial capital city boundaries can break down the institutional barriers that restrict the free flow and efficient allocation of various types of factors in provincial capital cities. After the implementation of the strategy of strong provincial capitals, the pattern of urban development has been optimized and the central city platform has been expanded. At the same time, the blind expansion and disorderly expansion of provincial capitals can lead to the inefficient use of land resources, exacerbate the transformation of land stock utilization, and thus significantly consume regional energy resources. The expansion of provincial capital city boundaries has exacerbated the fragmentation of ecological landscapes and degradation of land ecosystems to a certain extent, which in turn has reduced the resilience of ecosystems. The improvement of the ecological environment lags behind the development of provincial capital cities, thus contradicting the principle of sustainable development [1].
Based on this background, the marginal contribution of the article lies in:
(1) Exploring the impact of the provincial capital cities boundary expansion on the quality of regional green and low-carbon development.
(2) Constructing the theoretical model of the provincial capital cities boundary expansion affecting the quality of green and low-carbon development.
(3) Examining the mechanism of green and low-carbon development quality in the provincial capital cities boundary expansion.
(4) Providing reference for the regional administrative adjustment of other countries.
Policy Background and Literature Review
Policy Background
The provincial capital city is often the central city of a province (autonomous region) and is the administrative center (government residence) of the province. Provincial capital cities are the core of the whole regional economic development, with strong representation and high research value. As the growth pole of economic development of each province, the capital city enjoys the significance of global strategic position. In the process of optimizing administrative divisions and developing modern metropolitan areas, cities such as Jinan (the capital of Shandong Province, China), Nanjing (the capital of Jiangsu Province, China), and Harbin (the capital of Heilongjiang Province, China) have been repeatedly named by the State as having “insufficient roles as provincial capitals” and “insufficient roles as central cities”. Therefore, the strategy of “strong provincial capital” has become a new spatial logic chosen by many provinces. The population share of provincial capital cities in the national population grew from 7.8% in 1978 to 14.2% in 2019; the GDP share of provincial capital cities in the country increased from 11.8% in 1978 to 20.8% in 2019. It can be seen that the dominant mode of strong provincial capitals is undergoing new changes. The “strong provincial capital” development strategy has continued to become a new practice and trend.
As the first provincial municipality to be abolished, the “abolition of Chaohu City” has become a rare example of China’s urbanization process. In 2011, the Anhui provincial government decided to abolish the prefecture-level city of Chaohu with the approval of the State Council. Lujiang County, formerly under the jurisdiction of the prefecture-level city of Chaohu, was transferred to the jurisdiction of Hefei City.
Literature Review
Provincial Capital Cities Boundary Expansion and Economic Scale
At present, some of China’s provincial capitals are not large enough and their economic agglomeration capacity is still not strong enough, thus limiting the spillover capacity of the provincial capitals. While attracting various factor resources, improving the efficiency of factor allocation, and enhancing competitive advantages, the development strategy of “strong provincial capital” can also enhance the communication and cooperation between cities, thus realizing the development of spatial economic integration [2]. Capital cities are able to attract a large number of high-quality laborers, which ultimately pushes up urban housing prices [3]. To a certain extent, the expansion of provincial capital cities has brought about diffusion and siphoning effects. Under the long-term cumulative effect, the degree of factor resource agglomeration in provincial capital cities has rapidly increased to a high level and continues to be maintained, which in turn drives the rapid economic growth of non-capital cities [4]. Provincial capital cities are in an absolutely dominant position, while other non-provincial capital cities are in a dominated position to receive diffusion. The uncontrolled expansion of provincial capital cities may cause the return effect to exceed the diffusion effect. In the process of further development, capital cities tend to become saturated with construction, their capacity approaches the boundary, and their population tends to become full, which in turn inhibits the economic development of non-capital cities.
Provincial Capital Cities Boundary Expansion and Social Welfare
The size distribution of China’s capital cities is close to the “Ziff’s law” distribution pattern. With the passage of time, the distribution pattern tends to equalize. From 2000 to 2015, the expansion rate of China’s capital cities showed an evolutionary trend of rising and then falling. The rate of expansion in the western and northeastern regions has been rising, the rate of expansion in the eastern region tends to slow down, and the rate of expansion in the central region has been expanding steadily [5]. The expansion of provincial capital city boundaries can significantly increase the primacy of the capital city and thus create a core growth pole. However, in the long run, the expansion of provincial capital city boundaries inhibits economic development by distorting labor employment rates, capital deepening, and factor allocation [6]. When the higher level gives the provincial capital and sub-provincial cities more land indicators, the expansion of the provincial capital city boundaries can improve the overall GDP level, but it will also reduce the welfare level of the residents [7]. The higher the economic scale concentration of the provincial capital city, the lower the efficiency of factor resource allocation within the province, which in turn reduces the high-quality development of the province’s economy [8].
Provincial Capital Cities Boundary Expansion and Air Pollution
The spatial expansion of provincial capital cities only changes the administrative fence on the surface, and cannot become a necessary means to solve the problem of green and low-carbon development of the urban economy. Blindly pursuing the spatial expansion of provincial capital cities and making unreasonable administrative division changes cannot fundamentally solve the contradictions and problems arising in the process of urban development [9]. The long-term absence of the “leadership” status of provincial capital cities can lead to the decentralization and fragmentation of the spatial layout of manufacturers, which is not conducive to regional technological progress. With economic development, the air quality of provincial capital cities will improve to some extent. The development of industries (clean energy industry, green low-carbon industry, emerging modern service industry, etc.) in the eastern capital cities will reduce urban air quality. Based on the development of clean energy industries, such as wind power and solar power, the western capital cities can accelerate the improvement of air quality [10]. The development strategy of “strong provincial capital” may lead to the neglect of environmental protection in the capital cities, thus causing the construction of ecological civilization to lag behind the economic construction. The spatial expansion of provincial capital cities cannot offset the congestion effect caused by their excessive size, so the haze pollution in the cities will become more serious [11]. The total economic growth of provincial capital cities is positively correlated with the scale of CO2 emissions. On the one hand, the rapid economic growth of cities will easily lead to the reduction of carbon sinks in green vegetation; on the other hand, in the process of rapid urbanization, population flow and migration will also lead to the increase of carbon dioxide emissions [12]. There is no simple “inverted U-shaped” curve relationship between economic growth and environmental pollution in Chinese cities [13].
Provincial Capital Cities Boundary Expansion and Specific Case Research
From the perspective of China’s various regions, provincial capital cities in the coastal, middle reaches of the Yellow River and southwestern regions play a stronger role in radiation leading and driving. In the development process of provincial capital cities, cities such as Nanjing, Hefei, and Jinan possess a low level of population concentration. After the administrative division adjustment, the allocation capacity of administrative resources in Chaohu City has been substantially weakened, which in turn leads to the spillover effect of market integration being much smaller than the outflow effect of factor resources [14]. When the construction of the Hefei Economic Circle was in the growth stage, the ecological carrying capacity of the provincial capital city was significantly reduced. Rapid growth of strategic emerging industries and technological progress of enterprises can reduce the scale of pollution [15]. Chengdu’s administrative division adjustment led to the blockage of resource factor flows, which in turn weakened the potential for economic agglomeration [16]. After the adjustment of the administrative division, Jinan City’s industrial synergistic agglomeration can promote the “de-territorialization” and “re-territorialization” of capital, thus realizing the capital’s leap to a higher scale [17].
Therefore, the government of provincial capital cities should carry out rational spatial planning of industrial clusters in order to develop modern low-carbon service industries. Provincial capital city governments should avoid blind urban expansion and improve the efficiency of land use so as to achieve the goal of alleviating ecological carrying pressure [18].
Theoretical Model and Conduction Path
Theoretical Model
In order to obtain the corresponding capital (K), it is assumed that the government of the region being restructured is under the direct authority of a higher government, and that capital is taxed or pollution is regulated (G). In order to meet the public service needs of the residents in the region, the government of the adjusted region can provide jobs as much as possible, thus increasing economic income. However, local residents also have requirements for the quality of the ecological environment. On the one hand, it is necessary for governments to levy capital taxes. This is because local governments require large amounts of capital to operate and provide public goods services. Industrial business activities are able to use labor and capital for factor inputs. In the production process, firms also export products and emit pollution. The production function can be written: Y(K, L, G). K indicates capital factor inputs, L indicates labor factor inputs, G is the allowable emissions of pollution, and the Y indicates output of the product. It is assumed that the investment in labor and capital of industrial enterprise activities is unchanged. In other words, if the factor inputs of labor and capital are doubled, the output of the firm’s products and pollution emissions are also doubled.
It is assumed that residents in the region have homogeneous preferences, have the same general efficiency function, and depend on per capita consumption C and pollution U = (C, G). Labor is assumed to be fixed. There is no mobility between labor forces. Ecological quality is chosen by the local government. Consumption of the population is related to the wage income attracted to firms in the region, the income obtained from taxes on firms, and the profits obtained after the payment of labor and capital remuneration by local firms. Assuming that the price r in a competitive market is a and the amount of capital is K, the total amount of capital is rK. If capital is taxed at a rate of Θ, the salary of labor is ω. Then, the profit of the enterprise is:
WV and XZ are the consumer’s undifferentiated curves. The slopes of the undifferentiated curves are the marginal rates of substitution between consumption and pollution for a typical consumer. The optimal levels of pollution emissions and per capita consumption under different tax rates on capital are plotted in Fig. 1. The slope of the production possibilities curve is the marginal rate of conversion between pollution and consumption. In the case of Θ = 0, the optimal choice is the combination (C0, G0). This is the optimal amount of pollution. And in the case of Θ = 1, the optimal choice is combination (C1, G1). Assuming that there is a demand for tax revenues by the local government in the area whose administrative boundaries are being reorganized, the capital tax is positive (Θ>0). For any level of pollution emissions, positive tax revenues can lead to a reduction in residential consumption. The local government allows an increase in the amount of pollution emitted from G0 to G1. Although the undifferentiated curve is tangent to the point corresponding to the curve of the production function at G1, there is a difference between the value of marginal cost r + Θ and its price r due to the tax on capital, so no efficiency is gained locally.
Fig. 1.
In the case of different taxes for capital, the optimal level of pollution emissions and per capita consumption.
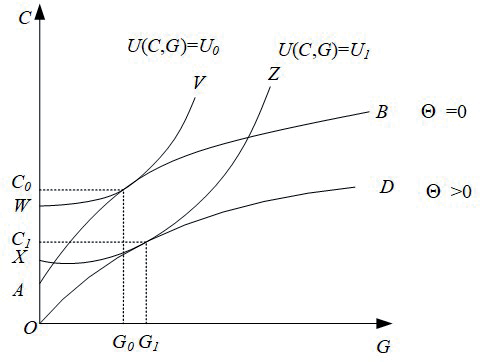
In summary, if for some reason capital tax revenues are zero, then the region being restructured is more likely to relax its environmental regulations in practice than if the optimal result is obtained. The government allows localities to increase their fiscal tax revenues and increase the autonomy of their own fiscal expenditures. The government is likely to lower the barriers to entry for polluting firms and undertake the transfer of related firms.
As environmental regulation decreases, local governments are able to increase their fiscal tax revenues, thereby increasing the autonomy of local fiscal expenditures. This is more pronounced as administrative levels decline. After the adjustment of administrative divisions, governments at lower administrative levels are more likely to lower the barriers to entry for polluting firms, and are more likely to undertake the accelerated transfer of pollution-related firms. Repetitive construction of infrastructure and blind expansion of spatial scope are likely to result in incomplete industrial agglomeration. The disorderly expansion of provincial capital cities increases the scale of pollution emissions to a certain extent, thereby reducing the ecological carrying capacity and the living space for green vegetation.
Conduction Path
Land Development Intensity
The governments of provincial capitals have been able to determine spatial control boundaries in accordance with the principles of compact layout and intensive construction. The governments of provincial capitals have been able to strengthen bottom-line control of land development, thereby strictly implementing the red line of ecological protection and urban development boundaries. On the basis of spatial inventory renewal, capital cities can form a cluster development pattern in harmony with the natural topography and ecological environment. Provincial capital city governments have continued to expand the supply of land for construction in key development zones and reduce the amount of land for construction that is inconsistent with functional positioning. Within the red line of ecological protection, the provincial capital city government strictly limits land construction activities, thereby realizing the coordinated development of production, life, and ecology. By introducing new industrial models that are resource-saving, environmentally friendly, and factor-efficient, capital cities are able to realize the harmonious unity of “people, city, environment, and industry” [19].
Transfer of the Pollution Industry
As production shifts to the secondary or tertiary sector, the land-centered factors of the government of the region being restructured will also shift. In the absence of supporting institutional reforms, administrative divisions will reinforce the status of interest subjects and the economy of administrative regions, which in turn will increase the cost of industrial upgrading. In the face of rapid urbanization and globalization, capital city governments will continue to put forward new requirements and tasks for green and low-carbon reforms. Cities of different sizes and levels in the region can create closer social links. By cooperating with neighboring regions, capital cities can break through institutional barriers that affect the quality of green and low-carbon development.
The governments of provincial capitals continue to promote the extension of productive services to high-end, the transformation of living services to refinement, and the accelerated development of manufacturing industries to high efficiency. The government is able to adapt to the development trend of green and low-carbon industrial integration, thus strengthening the role of industrial ecology in attracting business. Relying on supply chain synergy, innovation capacity sharing, and data resource docking models, the governments of capital cities are able to continuously improve the operational efficiency of industrial chains and the efficiency of economic output [20].
Fiscal Expenditure Autonomy
Finance is the basis of government activity. Provincial governments are basically macro-managers, resulting in more policy formulation; county governments are micro-managers, resulting in more policy implementation. Prefectural municipalities are neither macro nor micro. Due to the existence of the intermediate level of prefectural cities, there is an additional level of transfer payments from the central government to the lower levels. Prefecture-level city governments often use their strong position to withhold transfer funds, thus arriving at the county-level government funds having been nearly spent. Generally speaking, the more administrative layers there are, the further apart the upper and lower levels are. In this case, the degree of attrition in the quality of information is greatly increased, and the speed of transmission of information elements is also greatly reduced. In the process of administrative division adjustment, the higher level of government has the final say, while the lower level of government is in a completely passive position. The more levels of government there are, the less autonomy there is. Increased fiscal spending on environmental governance can significantly improve energy efficiency and accelerate factor mobility. However, the increased local competition that accompanies fiscal decentralization may also have a negative impact on the ecological environment [21].
Under China’s tax-sharing fiscal system, the main basis for fiscal allocation is the establishment hierarchy. In the fiscal framework system, centralized finance is in a dominant position and local finance is in a basic position. The larger the proportion of local financial expenditures, the higher the degree of fiscal decentralization. The central government authorizes the local governments at one level or another. This does not mean that the higher-level government completely underwrites all the affairs of the lower-level local governments, but that the powers of the lower-level governments are authorized by the higher-level government. In other words, lower-level governments are accountable to higher-level governments. With the reduction of administrative layers, all levels of government will face a reduction in local budget expenditures while being accountable to their superiors. Numerous studies have shown that this situation will become more pronounced as administrative levels compete [22].
Research Design
Methods
Spatio-Temporal Entropy Weight Method
The spatio-temporal entropy weight method can break through the limitations of the traditional entropy weight method that can only utilize the information of each indicator at a specific point in time, and then realize the dynamic comparative analysis between different years and different spatial information. In the spatio-temporal dimension, the method can fully reflect the differentiation of the green low-carbon indicators on the evaluation object, which in turn leads to more reasonable and accurate results of the comprehensive analysis.
Event Study Method
The event study method is a panel event study method. The coefficients of the lag and lead terms correspond to the trend of the event effect over time. The specific estimation equations are as follows:
Yit represents the explanation variables. αi and βt respectively indicate individual fixing effects and time fixing effects. J–1 lag and C antecedent terms are relative to the time of the event.
Synthetic Control Method
The estimated equations for the synthetic control method are as follows:
Variables
Explained variables: Quality of urban green and low -carbon development (GRECO).
Explanation variables: Economic development (Lnpergdpc), measured by taking the logarithm of the ratio of the real GDP of a prefecture-level city to its total population. Investment level (Oinvestc), characterized by using the ratio of the prefecture-level city’s total social investment in fixed assets to its real GDP. The level of education (Educ) is characterized by the ratio of the number of students enrolled in general higher education schools to the total population of the prefecture-level city. Market consumption (Marademc), proxied by the ratio of total retail sales of consumer goods and total population in prefecture-level cities. The scale of foreign capital (Lnwaizic) is proxied by the logarithm of total FDI in prefecture-level cities. The raw data of total FDI is converted using the exchange rate between RMB and USD. Infrastructure (Teleinsc), proxied by the number of fixed and mobile telephone subscribers in a prefecture-level city as a proportion of the total population.
Table 1.
Green and low -carbon development quality indicators system.
Samples
In order to ensure the availability and consistency of various data indicators, data from 63 prefectural-level cities in mainland China from 2003 to 2019 were finally selected for analysis. First, the two special administrative regions of Hong Kong and Macao in China and Taiwan Province of China are not covered for the time being because of the serious lack of data. Second, because of the specificity of geographical attributes, four municipalities such as Beijing, Tianjin, Shanghai, and Chongqing Municipalities are excluded. Third, prefecture-level cities such as Haikou City (the capital of Hainan Province) are deleted because an important data indicator of the city is more difficult to find and make up. Fourth, on the basis of referring to the development trend of each variable in Hefei City, prefecture-level cities that have not undergone administrative division changes during the sample period are selected.
The reasons why 2003 is taken as the starting year are as follows: the environmental data indicators before 2003 and in 2020 are seriously missing, and it is difficult to make up for the missing values. The selection of the time period reduces estimation error. The empirical analysis method requires that a range of a certain length be maintained before and after the implementation of the policy intervention. The selection of the time period can contribute to the analysis of the subsequent effects assessment.
Data Sources
See the Appendix for information on the sources of the explanatory variables. Other data were obtained from the “China Regional Economic Statistics Yearbook”, the “China Environmental Statistics Yearbook”, the “China Energy Statistics Yearbook”, the “China Urban Statistics Yearbook”, and the statistical yearbooks of various provinces (municipalities and autonomous regions).
In the event of missing data in a few years, the data were made up on the basis of the national economic and social statistical bulletins of the cities concerned. The descriptive statistical results of the variables are shown in Table 2.
Empirical Results Estimation
Empirical Results: All Samples
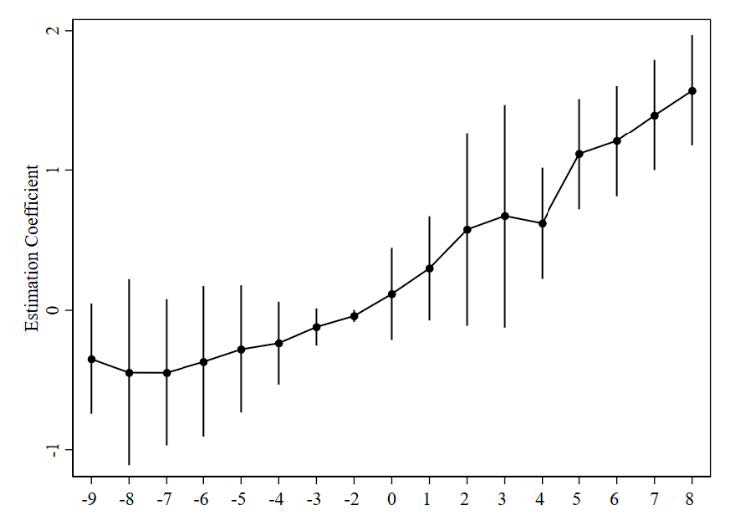
Taking all areas of provincial capital cities boundary expansion as samples, this chapter explores the overall effect of provincial capital cities boundary expansion. According to Fig. 2 analysis results, on the basis of using all samples as research objects, the implementation of the provincial capital cities boundary expansion policy can bring significant green and low-carbon effects. From the perspective of specific changes trend, in the early stage of policy implementation, the green and low-carbon effects generated by the provincial capital cities are small; in the later stage of policy implementation, the green and low-carbon effects generated by the provincial capital cities reaches the maximum.
After the implementation of the provincial capital cities boundary expansion policy, the provincial capital cities government put climate change in a more prominent position, strictly implemented the main responsibility of green low-carbon governance, and continuously enhances the synergy of ecological and environmental policies. The provincial capital cities government has continuously improved carbon emissions, and further deepened ecological environmental governance with carbon peak operations. The government insists on implementing the concept of energy conservation, promoting the adjustment of energy structure, and increasing the proportion of renewable energy utilization. After the expansion of the urban space in provincial capital cities, the government has continued to accelerate the use of clean energy, comprehensively improved resource productivity, and gradually realized the “decoupling” of economic development and energy consumption.
Table 2.
Descriptive statistics of variables.
Empirical Results: Case Sample
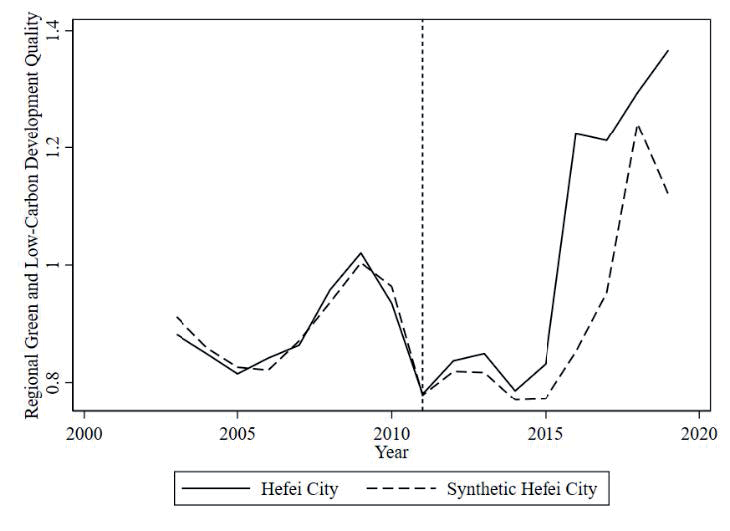
The empirical test found that the quality of green and low-carbon development in Hefei City showed a slow increase followed by an accelerated rise in its development after experiencing expansion in 2011. The gaps between the actual and synthetic fitted values of the explanatory variables of the pilot cities are all relatively small, indicating a better and higher degree of fitting. The analysis in Fig. 3 shows that on the left side of the vertical dashed line (year before the policy implementation), the prefecture-level city (solid line) has a high level of fit with the synthetic control prefecture (dashed line). The effect resulting from policy implementation depends on how much the region deviates from the synthetic object after implementation (to the right of the vertical dashed line).
In summary, before the implementation of the policy, the quality growth paths of green and low-carbon development in Hefei City almost completely overlapped with the synthetic paths. After the implementation of the policy, the actual value of Hefei exceeded the fitted value. With the continuous passage of time, the variation gap between the two shows an accelerated trend of expansion. The implementation of the provincial capital cities boundary expansion policy can significantly enhance the quality of green and low-carbon development in Hefei City, which in turn generates green and low-carbon growth effects. The empirical results are shown in Fig. 3.
Result Analysis: Case Sample
According to the analysis of Fig. 3, after the expansion of the border, the Hefei municipal government actively advocates a simple and moderate, green and low-carbon consumption pattern, which strengthens the ecological awareness of enterprises. The Hefei government actively guides the whole society to establish the investment concept of green growth and low-carbon development, thus creating a new trend of green and low-carbon life. The continuous improvement of the environmental public interest litigation and social supervision mechanism can make people feel the green and low-carbon benefits generated by the implementation of the border expansion policy [23].
Following the implementation of the boundary expansion policy in 2011, the Hefei Municipal Government has strictly implemented its main responsibility for green and low-carbon governance, and has continued to reduce carbon emissions and energy use intensity. The Hefei Municipal Government has comprehensively implemented actions to prevent and control pollution of the air, water, and soil, thereby continuously improving the ecological functions of the region. Based on the coordinated promotion of solid waste reduction at source, the Hefei Municipal Government has implemented an area-wide greening project to expand ecological open space.
However, it should also be noted that the green low-carbon effect at the initial stage of policy implementation shows a relatively small upward trend of change. There may be some bias in the Government’s understanding of green low-carbon development. Although the top-level design to address green and low-carbon development is in place, the space for high-carbon emission reduction has been narrowing. The city’s ecological protection promotion mechanism has not been able to give full play to its role, which in turn has led to the failure of the green low-carbon effect to fully emerge. In the late stage of policy implementation, the ecological environment quality of Hefei City shows a small decline in the trend of change. Risks and pitfalls in the quality of green and low-carbon development still exist in the late stage of policy implementation, leading to the arduous task of green and low-carbon development in Hefei. The capacity of ecological environment management is still unable to meet the highest requirements of the new situation, resulting in the level of green and low-carbon development in Hefei City to be further improved [24].
Robustness Test
Do the conclusions obtained from empirical estimation present inconsistent results depending on the city? In 2016, Chengdu City (the capital of Sichuan Province) implemented boundary expansion policies. The test found that the capital city expansion policy can bring green and low-carbon growth effects. For specific results, see Figure S2 in the appendix.
Are differences between empirical results caused by unobserved episodic factors? The article selects a prefecture-level city without policy intervention for testing. The prefecture-level city with the highest synthetic Hefei weight is Nanchang (weight is 0.587), followed by Baotou (weight is 0.196). By comparing the effects of policy implementation in Nanchang and Baotou, it was found that there was no significant difference in the effects of green and low-carbon development quality. See Fig. S3 and Fig. S4 in the appendix.
Are the empirical results subject to randomness depending on the year of policy implementation? Therefore, the policy was introduced either two years ahead or three years behind (2009), or three years behind (2013). The results of the test are consistent with the findings obtained in the year the policy was implemented (2011). See Figure S5 in the appendix.
After a series of robustness tests, the green and low-carbon growth effects from capital city expansion policies remain significant.
Mechanism Path Analysis
Mechanism Analysis: All Samples
Taking all the provincial capital cities where boundary expansion occurs as a research sample, this chapter discusses the mechanistic paths through which the green and low-carbon effect arises. Empirical tests continue to show that policy implementation can lead to green and low-carbon development by reducing the degree of land development, lowering the entry threshold for polluting industries, increasing the scale of spatial agglomeration, and expanding fiscal autonomy. See Table S2 in the appendix.
Mechanism Analysis: Case Sample
Land use intensity. Empirical estimation using the area of new urban construction land as the explanatory variable finds that the estimated coefficient of the policy effect shows a changing trend of a substantial increase, followed by a smooth development and then a continuous decline. After the implementation of the policy, Hefei City actively coordinates the development of land space and strictly controls land supply. In the late stage of policy implementation, based on the combination of various main function positioning, Hefei city government continuously carries out environmental refinement management. The provincial capital city government has continued to integrate existing natural green space resources to meet the multi-level recreational needs of its citizens. After the implementation of the policy, the Hefei City Government has continued to promote the organic integration of green and low-carbon forms and urban functions [25]. See Table S3 model (1) in the appendix.
Industrial transfer agglomeration. The policy estimation coefficient of pollution industry transfer shows a fluctuating downward trend. The policy estimation coefficient of industrial agglomeration scale shows a rapidly rising trend of change. After the implementation of the provincial expansion policy, the Hefei Municipal Government continued to improve the exit mechanism for backward enterprises and gradually eliminated highly polluting and low-capacity enterprises. Around the construction of modern industrial system requirements, Hefei City, focusing on the construction of the main industry prominent agglomeration layout, thus contributing to the rapid rise in the quality of green low-carbon development. See Table S3 model (2) and model (3) in the appendix.
Government fiscal expenditure autonomous. The estimated coefficients of financial autonomy show a fluctuating upward evolutionary trend. After the implementation of the policy, Hefei City comprehensively promotes the strategic action plan of ecological priority and green development, which in turn increases the investment in the field of ecological environment. Hefei city government continuously focuses on low-carbon industry investment and improves green technology, which in turn contributes to a continuous decline in the imbalance of government fiscal expenditures [26]. After the city boundaries were expanded, Hefei’s autonomy in fiscal expenditure was significantly enhanced. The provincial capital city government is actively deepening the reform of financial special funds, significantly optimizing the structure of financial expenditures, and coordinating the division of financial authority and expenditure responsibilities. The government continuously improves the performance of financial resources expenditure and explores the establishment of a diversified wetland ecological compensation mechanism. The higher-level government continuously strengthens policy support and financial inputs, thereby enhancing the actual effect of financial inputs on green and low-carbon development [27]. See Table S2 model (4) in the appendix.
Conclusions and Policy Suggestions
Conclusions
In the coming period of implementing the strategy of strong provincial capitals, the Government should avoid simple spatial expansion and focus on the continuous improvement of internal quality. By selecting the panel data of 63 prefecture-level cities in mainland China from 2003 to 2019, the article explores the net impact of the expansion of the provincial capital city boundaries on the quality of green and low-carbon development in the region.
The following results are obtained: (1) On the whole, the implementation of the provincial capital cities boundary expansion policy can promote the quality of green and low-carbon development. (2) In the early stages of policy implementation, the estimated coefficients of their policy effects show a slowly increasing trend of change. In the later stages of policy implementation, the green and low-carbon growth effect is particularly evident, which can promote the rapid growth and efficient improvement of green and low-carbon development in all samples. (3) Analysis of Hefei City as a case found that the expansion of the provincial capital can produce a positive policy effect of 0.247. From the perspective of development trends, the policy effect in 2011-2014 has been enhanced slowly, and the positive effect of green low-carbon has not been fully utilized. In the middle and late stages of policy implementation, the green and low-carbon effect showed a rising development trend. (4) After the “strong provincial capital” strategy, the reduction of land opening intensity, the increase in the threshold of industrial transfer, the expansion of the industrial agglomeration and the expansion of government fiscal expenditure are the mechanisms to produce positive effects.
Policy Suggestions
(1) Optimize the adjustment goals, and focus on regional green and low -carbon development. The government should adhere to the leadership of the national strategic layout and gradually eliminate the ecological disparity of the political pattern. Capital city governments should pay more attention to spatial equity, establish an inclusive spatial order, and enhance the efficiency of regional green and low-carbon spatial governance. (2) Strengthen the top-level design, and improve the quality of green and low-carbon. The governments of provincial capital cities should deeply analyze the problems of existing administrative divisions and actively promote the innovation of the administrative division system. The government should learn to summarize the experience and effectiveness of administrative division adjustment from a theoretical perspective, so as to enhance its understanding of the administrative division and urban development.
(3) Adjust the regional formula according to local conditions to promote regional green and low-carbon development. Based on the in-depth implementation of the “two mountains” theory, the provincial capital city governments should transform the major opportunities of the “strong provincial capital” strategy into green and low-carbon development impetus, and the major tasks into green and low-carbon development results. In the process of strengthening the provincial capital, the government should give full play to its own comparative advantages, and more importantly, focus on clarifying and avoiding the major risks that may exist.

