

Introduction
With the rising prevalence of mountainous power transmission projects, conventional tower foundations often resort to extensive cast-in-situ pile foundations. However, the intricate geological conditions in mountainous regions complicate foundation construction, posing challenges in equipment mobilization and potentially leading to resource waste and ecological impact. In contrast, micropiles, characterized by their compact size, construction flexibility, and cost-effectiveness, are gradually gaining traction in power transmission projects [1, 2]. They have found initial application in soft soil areas in China [3], with dedicated research and design efforts such as the development of micropile drilling rigs for extra-high-voltage transmission lines in mountainous regions [4]. Nevertheless, traditional micropiles primarily rely on frictional resistance for uplift resistance, displaying typical friction pile characteristics. Constrained by their small cross-sectional area, factors like rock embedding length and soil conditions significantly influence their pull-out performance, which is inherently unstable. Given the extended spans of power transmission towers, varying geological conditions, and prolonged exposure to wind loads and other uplift forces, further exploration of micropile group integration with other foundation types is imperative to address these challenges.
Pile groups, in contrast to single piles, involve intricate pile-to-pile interactions. Recent national and international research has made notable advancements in the exploration of pile group foundations, employing a combination of prototype tests, model tests, and numerical simulations. Qualitative and quantitative analyses of load-bearing capacity often incorporate elastic theory [5], the Mindlin half-space stress solution method [6], and finite element analysis [7, 8]. Studies on the load-bearing characteristics of pile group foundations, such as Zhang et al.’s investigation [9] on red-bed soft rocks, reveal the effective control of soil uplift and deformation by pile groups. Additionally, Zhou et al. [10] proposed and validated a load-bearing capacity calculation method for grouted pile group foundations in loess areas through centrifuge model tests. Su et al. [11] analyzed pile group effects, considering factors like soil compressibility, pile installation methods, pile-end constraints, and pile spacing, utilizing a model test system.
Research indicates that increasing shaft diameters in belled piles enhances pull-out resistance [12, 13]. Chang et al. [14] conducted an analysis of belled pile load-bearing characteristics and failure modes through field tests and simulations, emphasizing the significant influence of enlarged heads and soil resistance on pull-out capacity. Li Fei et al. [15] investigated belled pile pullout capacity with varying layer thickness through model tests and simulations, uncovering sand deformation and changes in contact force. Dickin et al. [16] explored large-diameter belled piles in sand, observing that an increased belled angle and shaft enlargement ratio decrease net pull-out capacity and failure displacement. This study contributes to an empirical design method for bell-shaped, belled piles.
Micropiles are widely used, and researchers have explored improvements in their construction and structure due to the evolving composite support systems. Jang et al. [17] introduced a method called Wave Micropiles (WMP) [18], which utilizes jet grouting to create enlarged shear keys, substantially boosting load-bearing capacity and economic efficiency. WMP demonstrates 1.4 to 2.3 times greater vertical load-bearing capacity than traditional micropiles. However, jet grouting is effective mainly for upper, weak soil layers, posing difficulties when dealing with harder, more cohesive soils or rock layers [19]. These findings confirm the potential for enhancing load-bearing capacity by modifying micropile structural forms, laying a practical foundation for subsequent research in this study.
Recent research has significantly advanced our understanding of uplift resistance mechanisms and engineering applications in both pile group foundations and belled piles. However, existing studies predominantly focus on the load-bearing characteristics of large-diameter pile group foundations in soft soil regions. Limited attention has been given to micropile group foundations in high-altitude mountainous areas, especially those integrating belled micropiles for transmission tower foundations. Consequently, this paper conducts prototype pull-out tests on micropile group foundations to explore their pull-out resistance performance. Numerical inversion models are established to validate the experimental results. Additionally, a novel micropile group foundation incorporating bell-shaped enlargements is proposed, and its pull-out resistance characteristics are compared and analyzed. The paper also introduces a simplified calculation algorithm for the ultimate pull-out capacity of belled micropiles.
Experimental
Overview of the Experiments
The experimental site, situated on a mountainous slope terrace near Songpan County in the Aba Tibetan and Qiang Autonomous Prefecture of Sichuan Province, China, exhibits straightforward geological strata and structure. On-site exploration and laboratory geotechnical tests (see Figure 1) reveal that the foundation soil primarily comprises Quaternary deposits, featuring gravelly clay and clayey fragments with intermittent rock fragments.
Table 1 presents the soil parameters for each layer at the site [20]. In the 0 to 3-meter depth range, the loamy gravel soil exhibits a cohesion range of 12.5 to 14.89 kPa and an internal friction angle between 25.6 and 28.45°. Shear strength parameters show a slight increase with depth in this range. However, in the 3 to 8-meter depth range, notable distinctions emerge between loamy sand and loamy gravel soils. Loamy sand has a relatively higher cohesion (average: 22.04 kPa) and a relatively lower internal friction angle (average: 16.46°). Field investigations and drilling revealed that the groundwater table at the site is relatively deep, generally located below 10 meters from the ground surface.
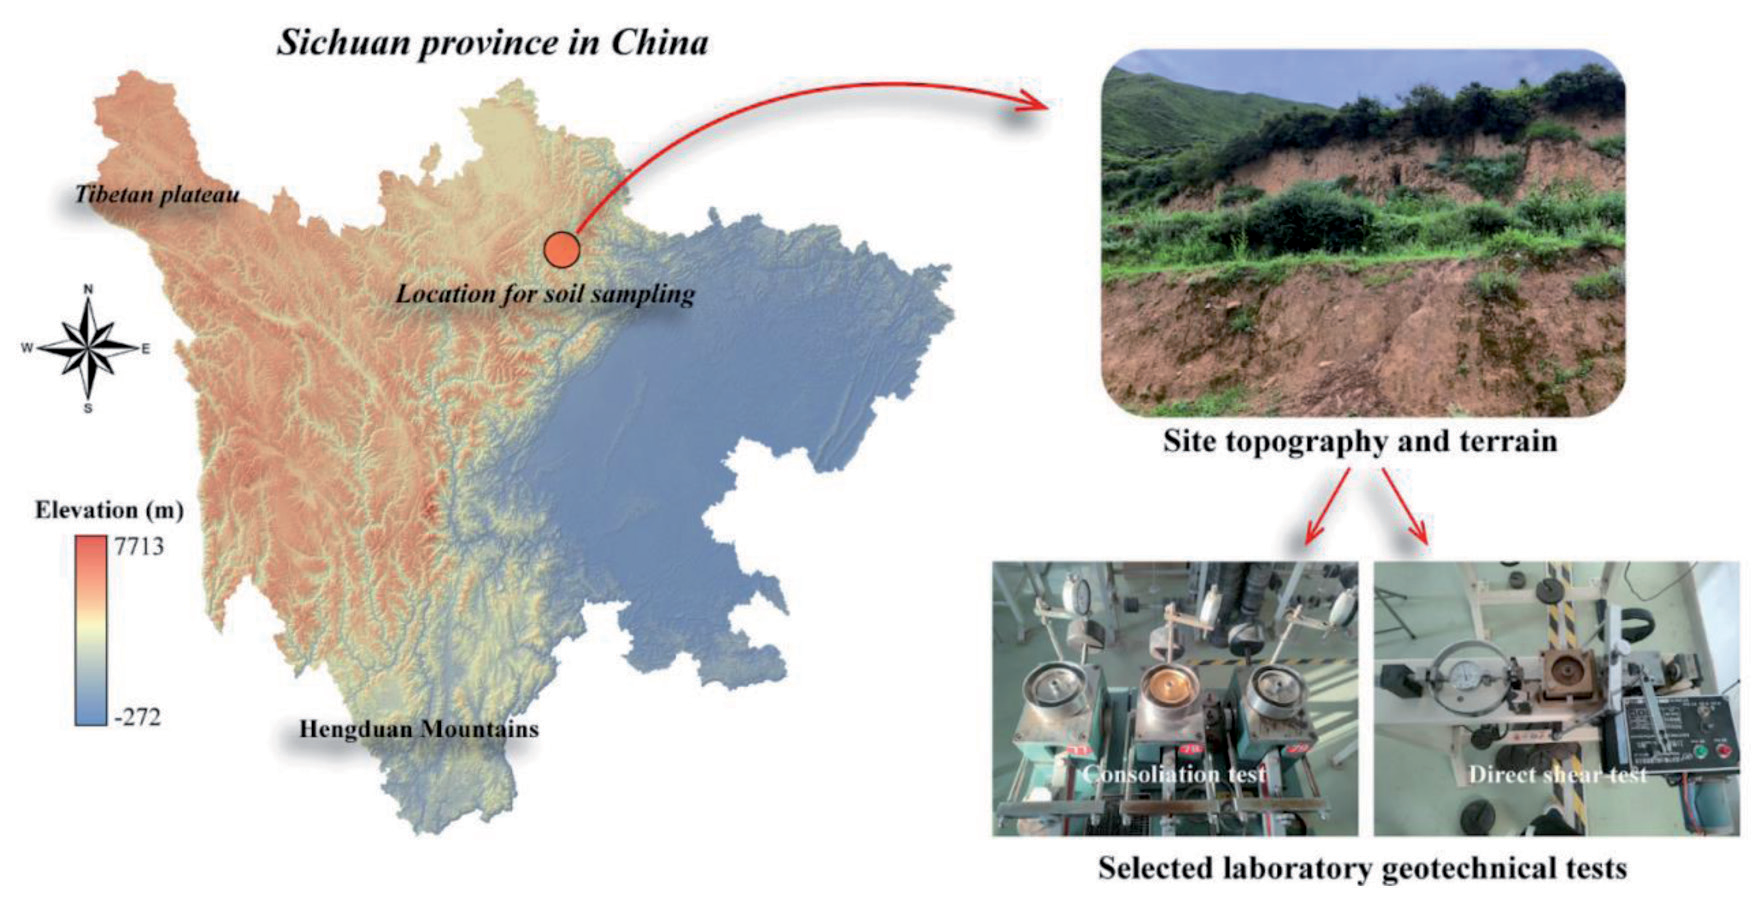
Table 1.
Physical and mechanical parameters of soil layers at the test site
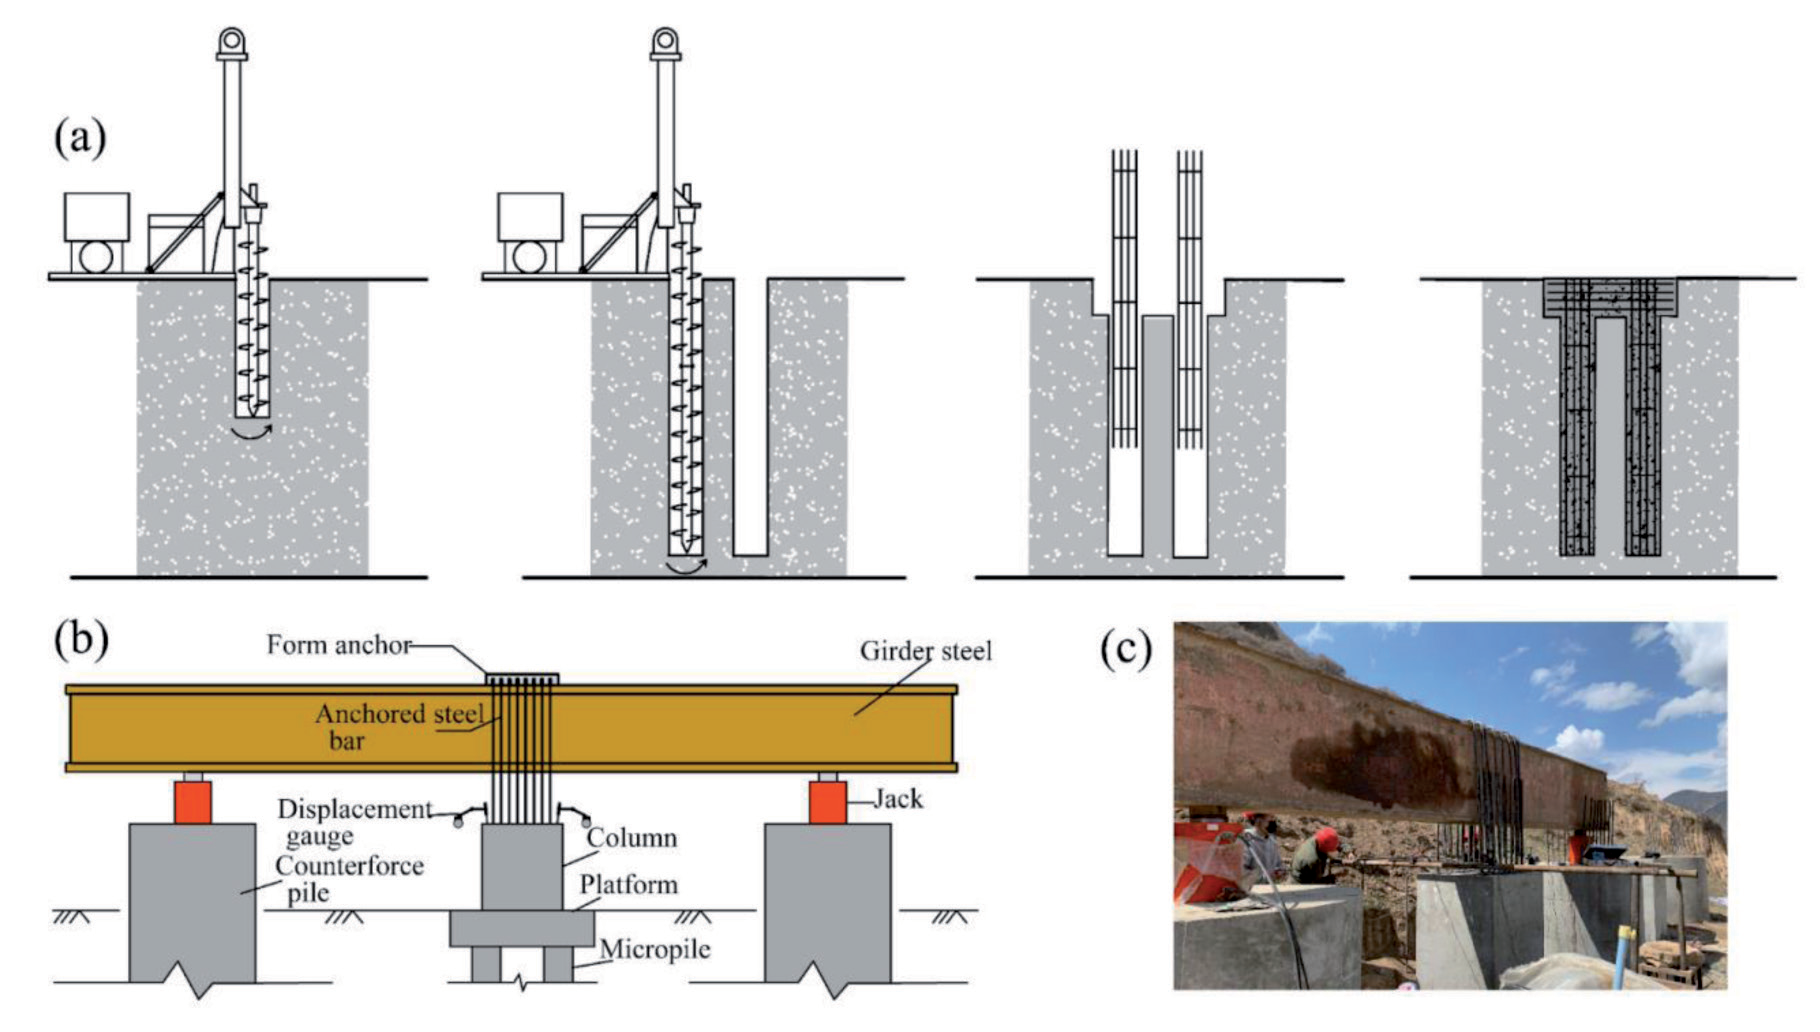
In this experiment, the test foundation comprised a uniform micropile group consisting of four individual piles. Each pile had a length of 7 meters, a diameter of 0.3 meters, and a spacing of 0.9 meters between piles. At the top of each pile was a pile cap measuring 1.8 meters by 1.8 meters by 0.6 meters (length x width x height), supporting a column measuring 1.0 meters by 1.0 meters by 1.5 meters. The foundation consisted of a total of four piles. A flexible short helical drilling machine is employed for the construction of micro-group pile foundations, with the upper cap being constructed through manual excavation. Following the completion of drilling, a steel reinforcement cage is lowered and concrete is poured (Figure 2(a)). The concrete used for the piles had a strength grade of C35, and the main reinforcement consisted of 14mm diameter hot-rolled ribbed steel bars (HRB400), while the ties were made of 8mm diameter hot-rolled smooth round steel bars (HPB300). Quality checks were conducted on micropile integrity after pouring.
The reaction piles are fabricated through manual excavation, hole drilling, and concrete pouring, with a diameter of 1.6 meters and a length of 8 meters. The testing loading system, positioned above the reaction piles, employs two hydraulic jacks to apply loads to the top of the test pile through pull rods. Four LVDT sensors (with a 50 mm range) are situated on the flat top surface of the piles. Figure 2 illustrates the layout of the testing loading system and the site arrangement.
Experimental Loading and Analysis
The test was conducted following the Slow Sustained Load method as outlined in the “Technical Specification for Testing of Building Pile Foundations” (JGJ106-2014) [21]. The load was applied in ten increments, with each level introducing a 200 kN load increment. Throughout the entire loading process, data measurements, and adherence to stability standards, strict compliance with the specifications was maintained.
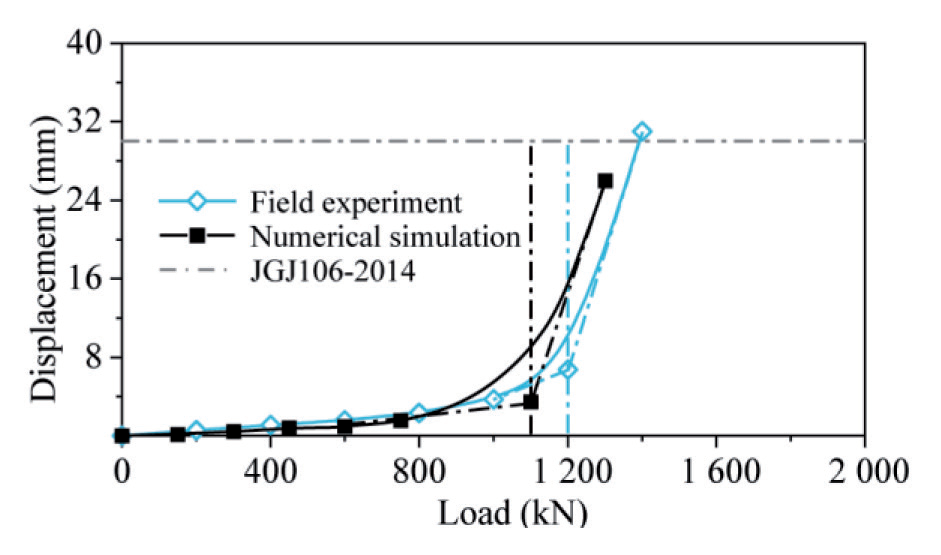
During the micropile group foundation load application, the test concluded upon foundation failure. The ultimate pullout capacity was determined based on either a significant change in the load-displacement curve or when the cumulative displacement reached 30 mm under the influence of an uplift load. Figure 6 illustrates the load-displacement curve for the micropile group under test loading and numerical inversion (utilized for subsequent comparative analysis). Results exhibited a substantial change in the load-displacement curve at the 6th load level, meeting criteria for determining the pile’s ultimate pullout capacity per pile foundation standards. Consequently, the corresponding load (1200 kN) was considered the ultimate pullout capacity for this micropile group.
Numerical Simulation
Since the test results did not meet the expected ultimate bearing capacity of 2000 kN, further consideration is required to enhance the foundation’s pull-out resistance by adopting a composite pile group configuration. Taking into account factors such as current construction methods and economic efficiency. We adopted the bell-shaped borehole configuration [22] (as illustrated in Figure 3) and paired it with a drill bit developed in-house. This configuration avoids soil disturbance under static conditions and, when integrated with the micropile system, helps to prevent stress concentration. Given the high costs and complexity associated with on-site repetitive testing, this section supplements the study of the pull-out characteristics of single bell-shaped micropiles and pile groups with numerical inversion models, cross-validated against field test results.
The construction concept of MP-B is illustrated in Figure 4. The process begins by using a short spiral drilling rig to drill to the upper uniform-section depth. The lower foundation soil then supports the expanding head bit, which bores into the expansion head. Afterward, a steel bar is inserted, and grouting is poured, emphasizing the additional pressure grouting of the expansion head part. The quality of the hole made during the expansion of the head is a vital aspect of the MP-B installation, as it determines the subsequent pouring and uplift resistance of the pile body. In most practical engineering scenarios, foundation soil layers are uneven. However, a short spiral drilling rig equipped with a specialized bit can facilitate expansion to any depth. Consequently, for this project, the position of the enlarged head can be adjusted flexibly based on the bearing layer of the soil. This ensures that the bearing capacity requirements are satisfied.
Establishment of the Numerical Model
This study utilizes the numerical analysis software FLAC3D to quantitatively assess the bearing performance of the micropile foundation. Numerical inversion calculations, based on prototype tests of micropile groups, are initially conducted to ensure the accuracy of subsequent simulations for belled micropiles. The model dimensions are set at 12m×12m×15m, considering the influence of micropile length and boundary effects. The soil constitutive model employs the Mohr-Coulomb elastic-plastic model, while the pile material follows an elastic model. To accurately represent the interaction between piles and soil, solid elements are used for both, and contact elements are established between them. The shear stiffness (ks) and normal stiffness (kn) at the contact interface are determined based on Equation (1).
Fig. 3.
Bell-Shaped Enlargement Form of Micropiles: (a) Schematic of the enlarged head principle; (b) Enlargement dimensions
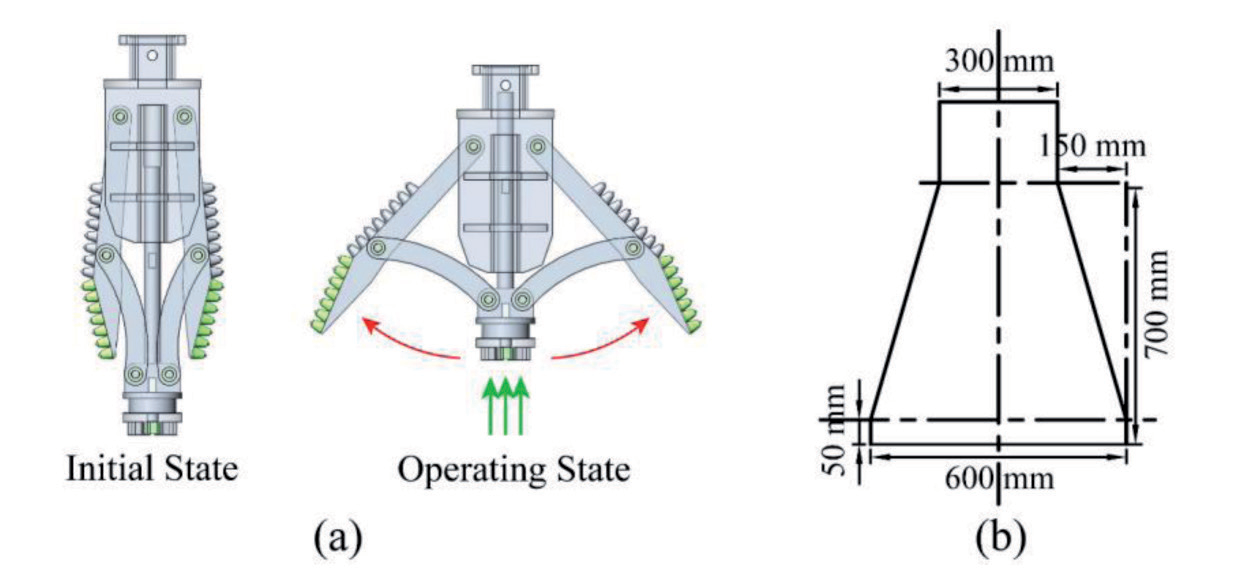
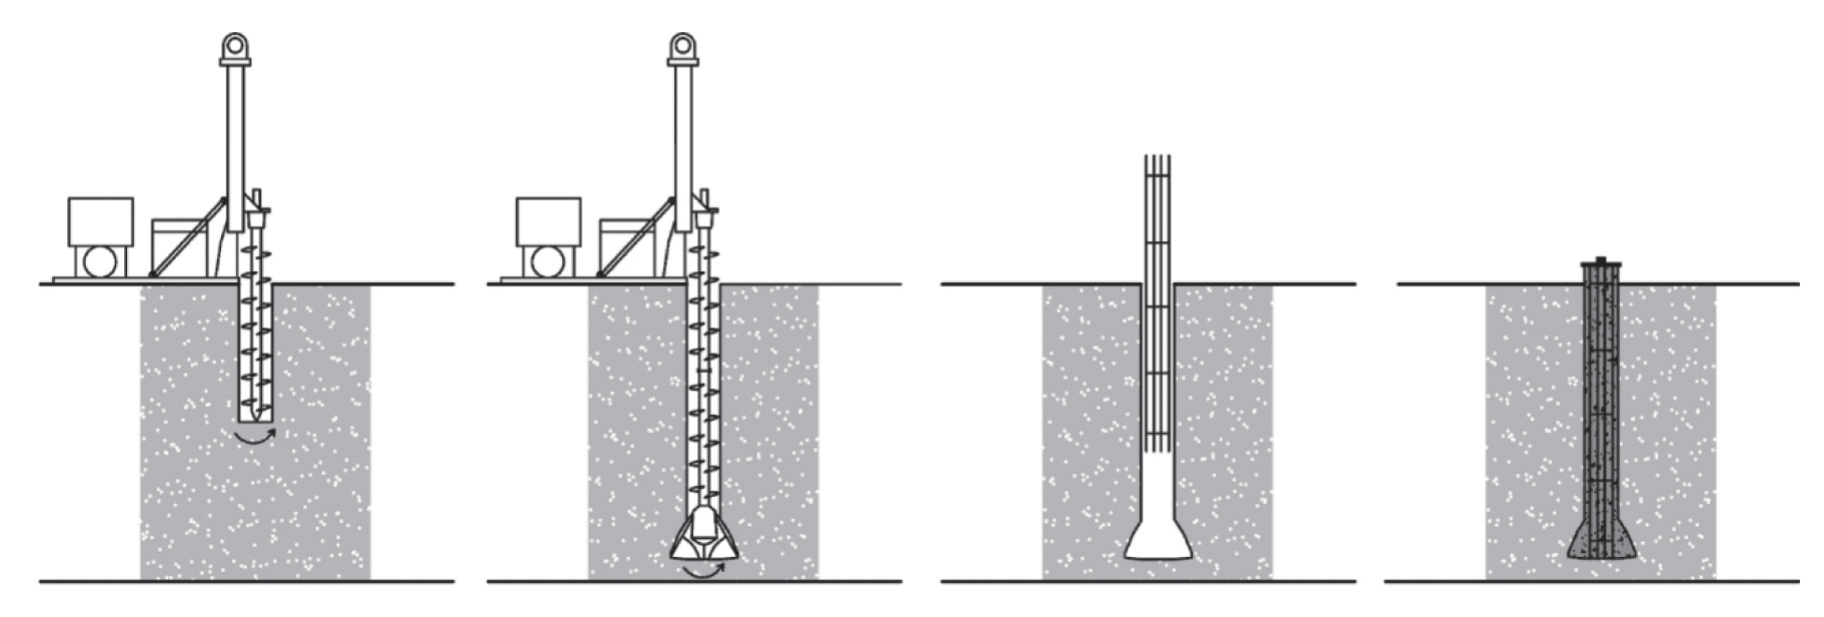
Fig. 5.
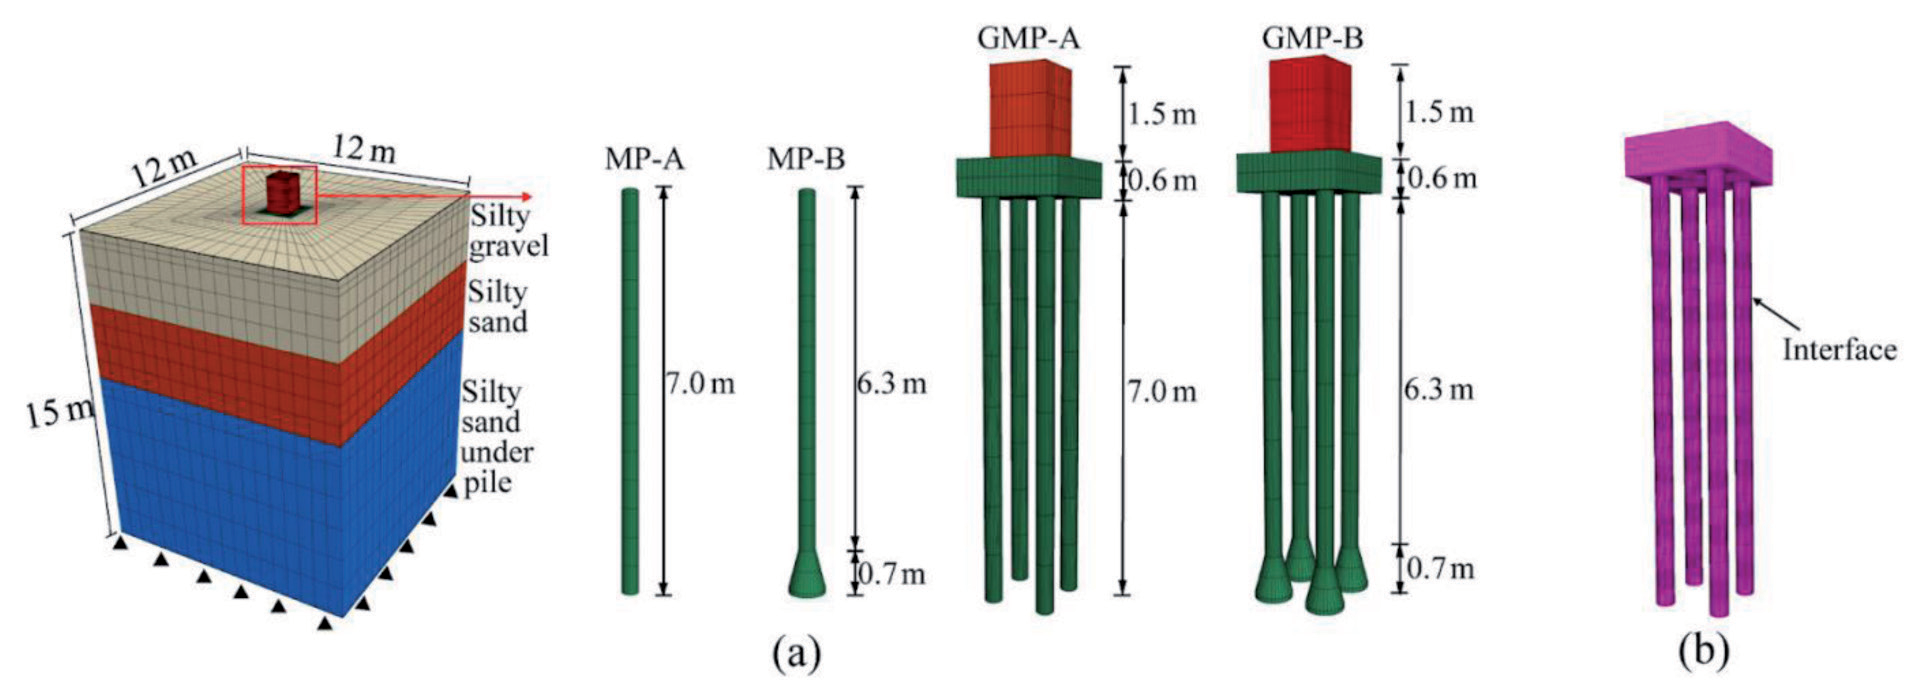
Numerical analysis model: (a) Pile-soil structure simulation; (b) Contact surface element simulation
Where K is bulk modulus, G is shear modulus, △Zmin is the minimum dimension of the normal contact region.
This study aims to compare the load-bearing characteristics of expanded base micropiles and uniform cross-section micropiles, analyzing their respective group pile effects. Extending the numerical inversion model (GMP-A), three additional pile types were introduced: uniform section micropile (MP-A), belled micropile (MP-B), and belled micropile group (GMP-B). The generalized models incorporate soil layers, pile bodies, and contact interfaces, as depicted in Figure 5. Lateral displacement at the model’s sides is constrained, and both horizontal and vertical displacements at the model’s bottom are fully restrained. No constraints are applied to the model’s top surface. The computational parameters for soil and pile elements are detailed in Table 2.
To simulate soil stress conditions similar to those in the field tests, it is necessary to establish the initial stress equilibrium before applying the loads. This process involves determining the lateral pressure coefficient (k) of the soil, which is fundamental for accurate stress-deformation calculations in geotechnical structures [23]. The lateral pressure coefficient (k) can be roughly estimated based on the soil’s Poisson’s ratio (μ), with the relationship given as k = μ / (1 - μ). Therefore, the calculated values of k for the silty gravel and silty sand used in numerical analysis are approximately 0.49 and 0.45, respectively.
Table 2.
Parameter values in numerical simulations
Analysis of Numerical Inversion Results
Comparing the inversion results with the experimental data (Figure 6), it is evident that there is a close correspondence between the two. Notably, the simulated displacement values are slightly greater than those obtained from the experiments. The reasons for this can be analyzed as follows: 1. External factors during the test process, such as disturbances from passing vehicles, human reading errors, and other environmental variables, may have led to the test results being slightly larger than the numerical simulation results. 2. In the simulation process, the stiffness of the pile-soil contact interface remained constant in the elastic phase, while in reality, it continuously changes. This variation in stiffness can affect the ultimate pullout capacity of the pile group, leading to differences between the simulated and actual results. Overall, the trend of the load-displacement curve in the inversion results closely matches the experimental data, indicating that this numerical model effectively represents the real conditions of the micropile group.
Uplift Bearing Characteristics
Load-Displacement Curve
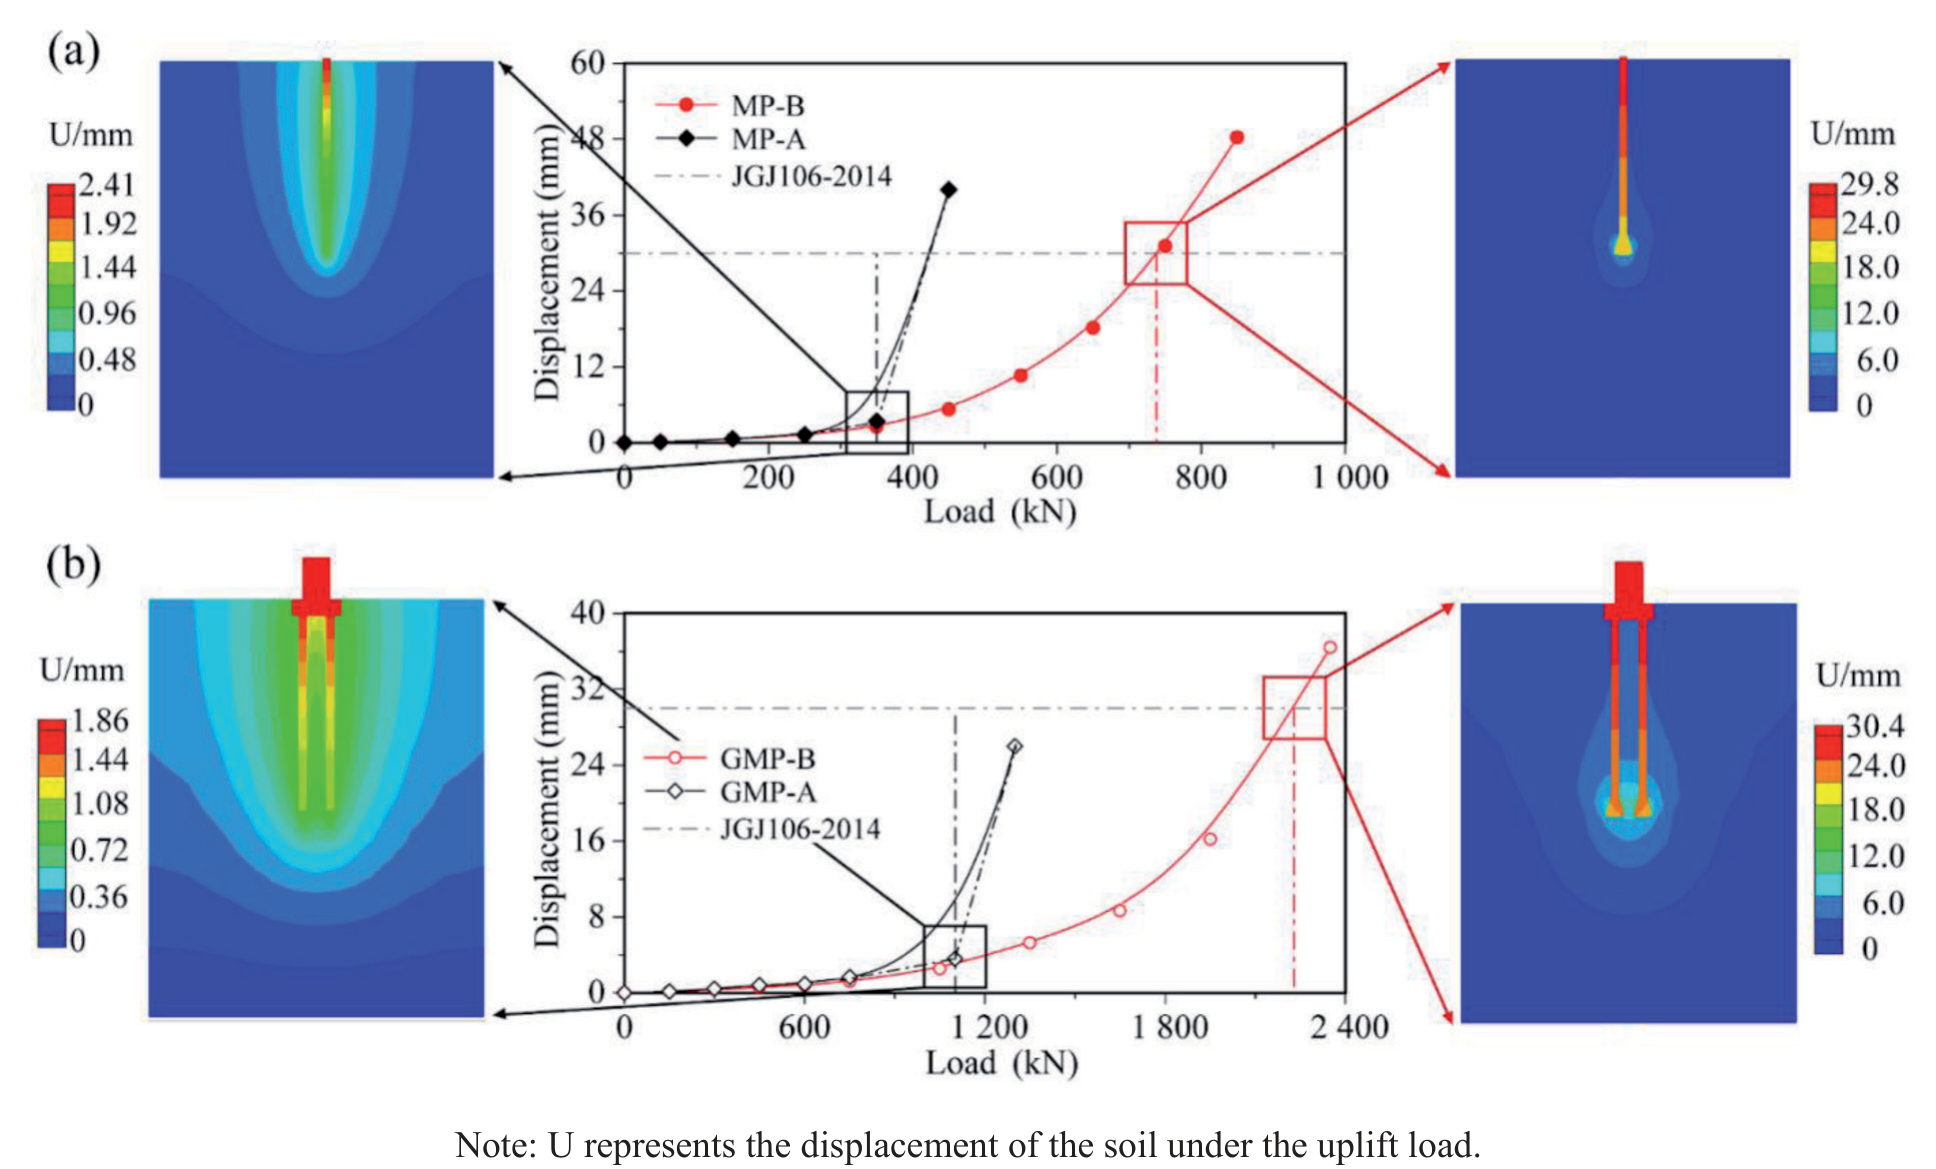
Uplift loads were applied to two individual single-pile models and the belled micropile group model, loaded to failure in accordance with standards. Figure 7 depicts the ultimate uplift bearing capacity, corresponding soil deformation patterns, and load-displacement curves.
As illustrated in Figure 6 (a), MP-A demonstrated an ultimate uplift bearing capacity of 325 kN. The abrupt point occurred at a displacement of 2.4 mm, with a relatively uniform soil displacement distribution, indicative of typical friction pile characteristics. In contrast, MP-B exhibited an ultimate uplift bearing capacity of 743 kN. At the ultimate load state, uplift displacement exceeded that of the uniform-section micropile. The ultimate bearing capacity was determined based on the standard failure displacement, with significant soil displacement observed in the enlarged section and upper part of the enlargement, suggesting a friction-belled-pile behavior with a single support point. Additionally, the enlargement section displayed an “arch bridge” phenomenon, indicating unloading in that area. Compared to MP-A under the same conditions, MP-B demonstrated a 1.2-fold increase in ultimate bearing capacity.
In comparison to a single micropile foundation, group pile foundations exert a broader influence on the surrounding soil under upward loads. As shown in Figure 6 (b), GMP-A demonstrates an ultimate bearing capacity of 1050 kN, with relatively uniform soil displacement along the pile sides. Conversely, GMP-B exhibits an ultimate bearing capacity of 2210 kN. Significantly, substantial soil displacement occurs at the enlargement head, with the inner-side soil of the enlargement head and the pile base experiencing greater displacement compared to the outer-side soil. GMP-B achieves a notable 1.0- fold increase in ultimate bearing capacity compared to GMP-A.
Axial Force and Lateral Frictional Resistance
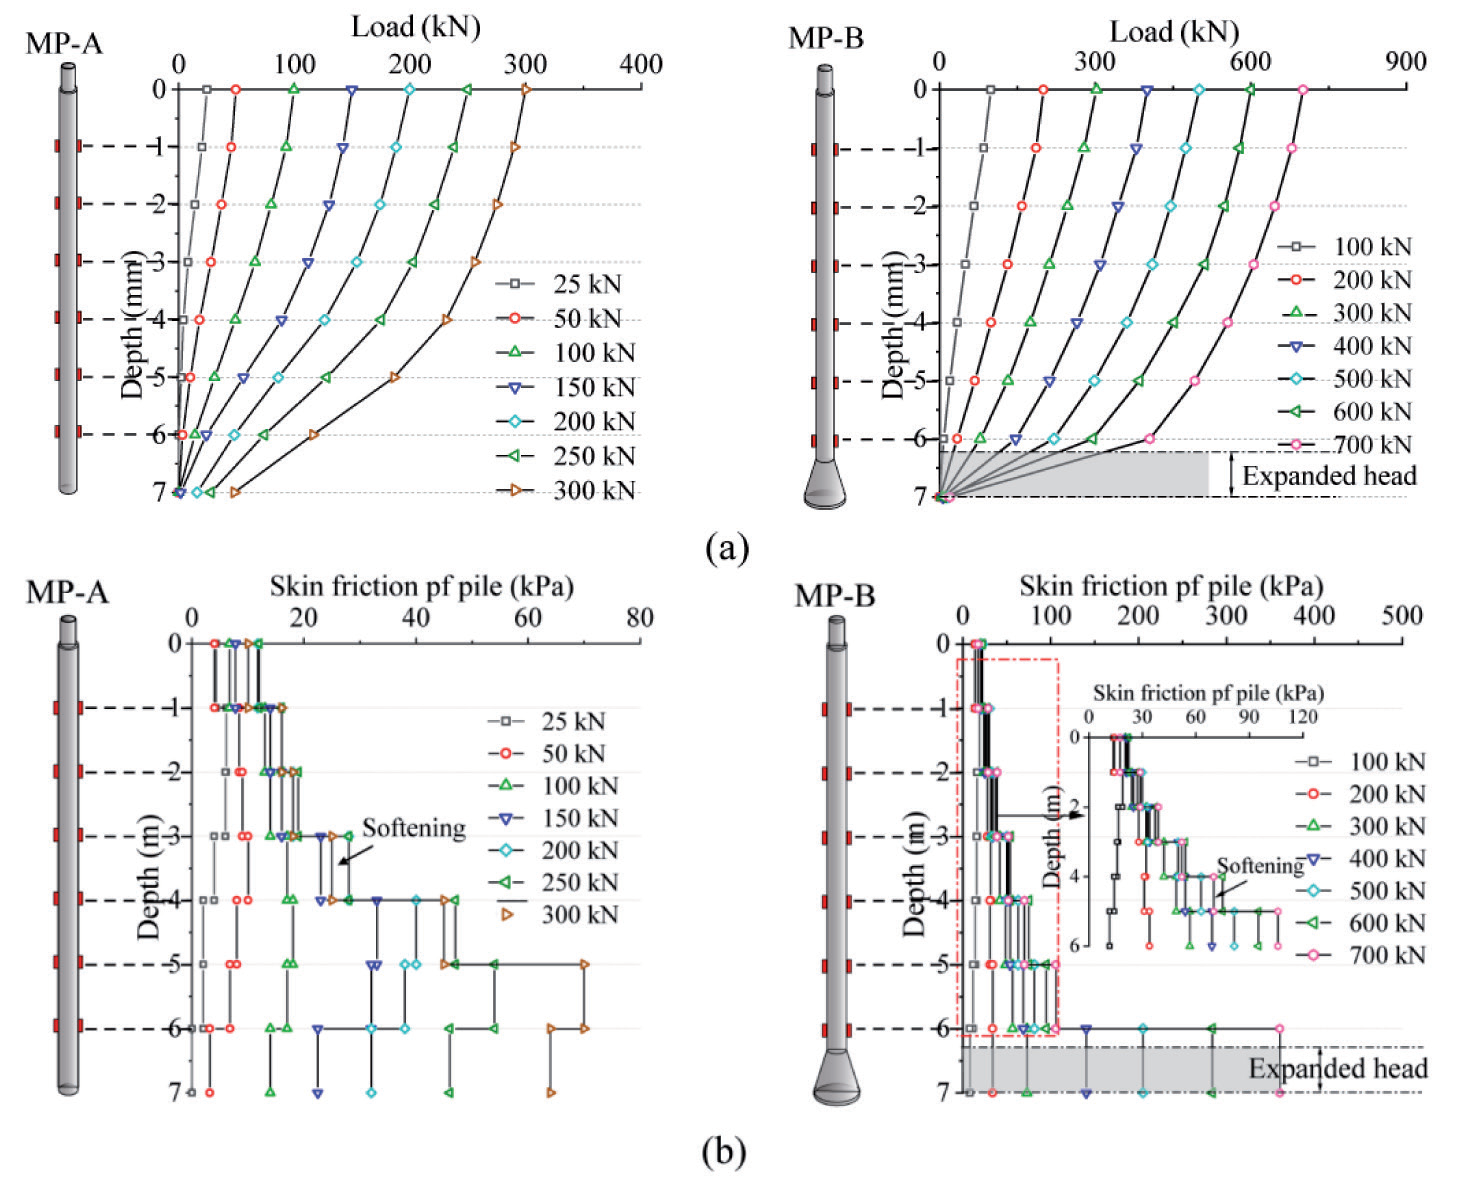
Figure 8 illustrates the distribution curves of axial force and lateral frictional resistance for two types of micropiles. As depicted in Figure 8, the axial forces in both types of micropiles gradually diminish with depth. For MP-A, the variation in axial force is relatively uniform, generally following an upward-mild and downward-steep trend. This change in axial force primarily stems from the mobilization of lateral frictional resistance in the equal-section portion. However, with an increase in load, the upper lateral resistance remains constant, primarily offsetting the top load through the gradual activation of lower lateral frictional resistance, leading to softening in the upper section.
Conversely, MP-B experiences a notable reduction in axial force at the enlarged head position, accompanied by an increase in lateral frictional resistance. Initially, lateral frictional resistance in the uniform section comes into play and rises with depth. This increase is attributed to the upward displacement causing the enlarged head to compress the upper soil, enhancing local soil shear strength through densification. Additionally, the increased vertical stress causes the principal stress in the densified soil to deviate, further amplifying lateral frictional resistance along the pile. A closer examination reveals softening in the upper equal-section lateral frictional resistance. With increasing pile head load, lateral frictional resistance at the enlarged head location (including the support force at the enlarged head) sharply rises. The lateral frictional resistance distribution curve takes on an “L” shape with depth, primarily due to the enhanced axial resistance effect at the enlarged head [24]. The pullout resistance of MP-B is significantly greater than that of MP-A. Based on the above results, it is estimated that the pullout bearing capacity of the belled-out pile is substantially enhanced compared to the equivalent cross-sectional micropile. Furthermore, its specially designed drill bit can meet the demanding pullout bearing capacity requirements of complex mountainous tower foundations, giving it a distinct advantage. However, as long as the conditions of bell-shaped micropile construction and field testing are not realized, it is not possible to comment on these advantages with certainty.
Calculation Method for Ultimate Pull-Out Capacity
In gravelly cohesive soil, Figure 8(a) depicts the distribution of the plastic zone for bell-shaped micropiles under numerical simulation. The relatively high length-to-diameter ratio prevents the failure surface in the tapered section from reaching the ground surface; instead, it follows a specific failure curve, stopping within the uniform sectional area. Shear failure occurs in the soil above this zone along the pile-soil interface. To simplify the calculation of the secondary surface and meet practical engineering needs for simplicity and accuracy, researchers often approximate the failure surface of short piles under the secondary surface failure mode as cylindrical [25]. In practical engineering applications, it is assumed that within a specific range above the pile cap (determined by the height of the failure surface), the diameter of the shear plane in the soil equals the maximum diameter of the pile cap. Above this range, the cross-sectional portion of the pile is considered the pile-soil interface. The ultimate pull-out capacity of variable-diameter micropiles is then derived using the limit equilibrium method and the M-C strength criterion, as illustrated in Figure 8(b).
Fig. 8.
Axial Force and Lateral Frictional Resistance Curves in Piles: (a) Axial Force; (b) Lateral Frictional Resistance
Based on the Mohr-Coulomb strength criterion, it can be determined that
Where △T represents the shear stress on the failure surface,
φg denotes the internal friction angle of the granular soil,
cg represents the cohesion of the granular soil.
Establishing static equilibrium equations on the failure surface based on the model shown in Figure 9.
Where △R represents the normal stress on the failure surface,
K is the lateral pressure coefficient of the granular soil,
σg represents the self-weight stress of the overlying soil on the failure surface,
γg stands for the average weighted unit weight of the overlying soil,
L is the total length of the pile,
θ is the angle between the tangent to the failure surface and the x-axis.
The formulas for K and θ are as follows:
Where μg represents the Poisson’s ratio for the granular soil.
Based on equations (1), (2), and (3), we can derive the following:
As seen from the computational model in Figure 9, the ultimate pullout capacity of tapered micropiles in gravel soil is primarily composed of four components: the pullout capacity of the upper cross-section of the pile above the failure surface, the weight of the soil within the failure surface, the tangential force on the rupture surface within the gravel soil, and the self-weight of the pile. Each of these components will be calculated separately.
Since this section of soil still experiences sliding failure along the pile-soil interface, it can be calculated using the existing code formula for pile pullout resistance:
Where λi is the pullout resistance coefficient for the i-th layer of soil,
d is the pile diameter in the uniform section,
L1 is the equivalent starting point distance to the pile tip from the failure surface,
D is the pile diameter in the enlarged section,
H is the distance from the tail and head of the enlarged section to the pile tip,
qsik is the ultimate lateral resistance standard value of the i-th layer of soil at the pile side.
Fig. 9.
Load-bearing capacity calculation model: (a)Distribution of plastic zones in numerical simulation; (b) Illustration of fracture surface and calculation model
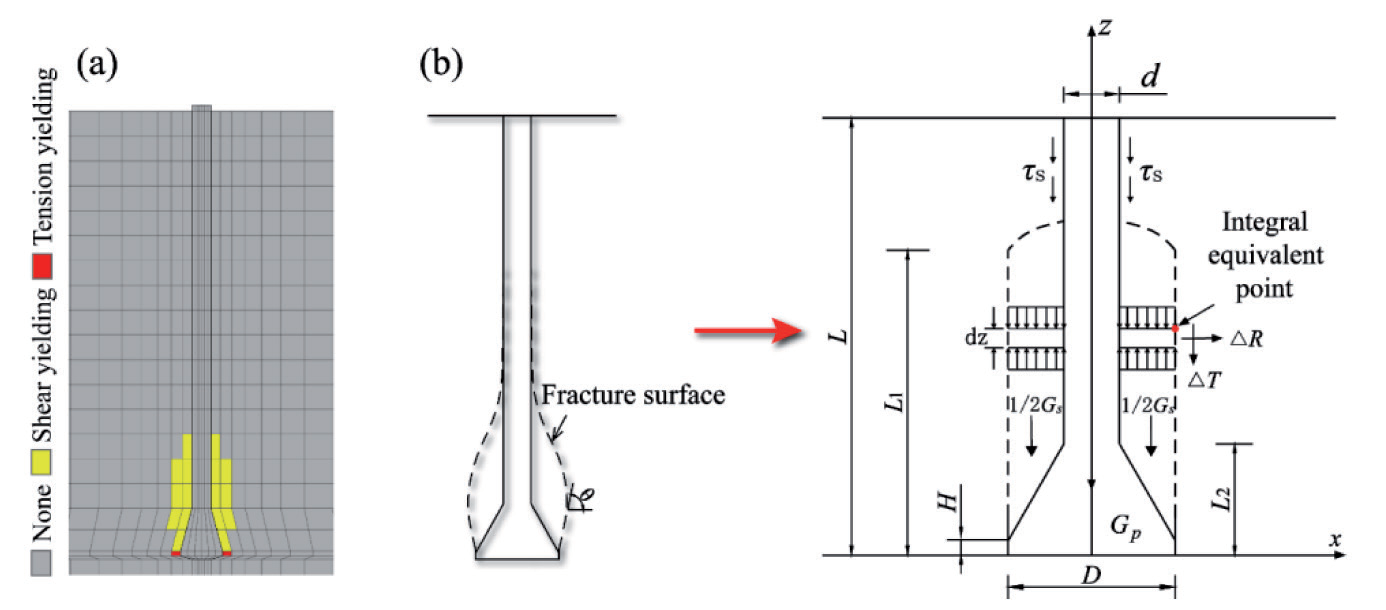
The soil within the enlarged head section can be roughly calculated within an approximate rectangular area from the height of the failure surface to the bottom of the conical surface.
Where L2 is the distance from the enlarged head section to the pile tip,
γr is the average weighted density of this soil section.
Considering the assumption of a cylindrical failure surface, derived from the ultimate balance equation for individual soil elements, the change in tangential force △Qv on the fracture surface is expressed as follows:
Simultaneously, incorporating the boundary condition θ = 90°, which implies:
Taking the partial derivative with respect to it yields:
Therefore, integrating with respect to the tangential force on the rupture surface yields:
Solving for it and expanding:
The pile self-weight comprises two parts: the self-weight of the uniform cross-section of the pile body and the self-weight of the enlarged head of the pile:
Where γp is the density of the pile body.
By simultaneously combining equations (1), (2), (3), and (4), the expression for the ultimate pull-out capacity of bell-shaped micropiles in gravelly cohesive soil is obtained as follows:
Hence, based on the relevant parameters of gravelly cohesive soil in high-altitude mountainous regions and bell-shaped micropiles, the ultimate pull-out capacity Qu can be determined using the above equation.
To validate the rationality and correctness of the proposed calculation method for the ultimate pullout capacity of bell-shaped micropiles in this study, a comparison and analysis were conducted between the integrated calculation results and numerical simulation results (based on the plastic zone results from numerical simulations, considering fracture plane heights of 2.4D, 2.5D, 2.6D, and 2.7D). As shown in Table 3, the calculated ultimate pull-out capacity results are quite close to the model test results, with relative errors ranging from 2.42% to 9.02%. Notably, when the fracture plane height is set to 2.5D and 2.6D, the error is only 2.42% to 2.56%. These findings indicate that this method is reasonable, simple, accurate, and suitable for rapid on-site calculations and analyses. It can find widespread application in practical scenarios involving gravelly, cohesive soil areas.
Conclusions
(1) Field tests and numerical simulations indicate that GMP-A’s load-displacement curve has a steep slope, resulting in an ultimate pull-out capacity of 1200 kN. Conversely, the load-displacement curve for GMP-B exhibits a smoother profile, with more significant displacements near the expansion head. Notably, the inner soil adjacent to the expansion heads and the pile base experiences larger displacements than the outer soil layers.
(2) The incremental increase in the ultimate uplift capacity of the belled micropile is attributed to two main factors: the expansion head and the additional lateral frictional resistance generated due to the expansion head’s densification effect on the uniform section portion. During the application of uplift loads, different parts of the belled micropile bear loads asynchronously. When the uplift capacity reaches its ultimate limit, it transitions from a friction pile to a friction-expansion head-bearing pile.
(3) Employing a belled base can effectively mitigate the issue of insufficient uplift capacity in uniform section micropile groups, with the expansion head significantly enhancing the performance of the micropiles. When compared to uniform section micropiles under equivalent conditions, MP-B exhibits a 1.2-fold increase in ultimate bearing capacity compared to MP-A. Furthermore, when compared to GMP-A, GMP-B demonstrates a 1.0-fold increase in ultimate bearing capacity. However, further on-site testing is required to validate this observation.
(4) This study presents a simplified calculation method for bell-shaped micro-piles based on the limit equilibrium method and the Mohr-Coulomb strength criterion. It is applicable to gravelly clay regions, and in engineering applications, the suggested fracture plane height can be considered within the range of 2.5D to 2.6D.

