

Introduction
Ecosystem services supply encompasses the provision of goods and services by ecosystems for human benefit, while demand signifies human consumption and utilization of these services [1]. Together, they constitute the dynamic flow of ecosystem services from natural ecosystems to human societies. By quantitatively visualizing and analyzing land-use related indices, such as land-use change rate and intensity, in conjunction with ecosystem services, we can provide guidance for sustainable land resource management [2, 3]. Consequently, conducting a functional analysis of ecosystem services grounded in land use changes holds significant importance. It aids in comprehending the formation and driving mechanisms of ecosystem services and offers guidance for optimizing land use allocation [4].
Currently, numerous scholars have investigated the influence of land use changes on ecosystem services. However, most of the existing research primarily concentrates on the effects of alterations in land use types. For instance, in their analysis of the impact of land use on the spatial heterogeneity of ecosystem services in Nagqu City on the Tibetan Plateau, Jing Haichao [5, 6]. focused on land use type and the Shannon diversity index as primary influencing factors. Sutherland devised an elasticity index that incorporated land use cover and ecosystem service value to examine how land use changes affect ecosystem service value on the Tibetan Plateau [7]. Meanwhile, Fan Xiaomin explored the impact of land use change (or lack thereof) as a driving factor in the study of several ecosystem services in the northeastern Tibetan Plateau, though they did not delve into the influence of land use transfer methods on ecosystem services [8]. To date, research regarding the consequences of land use on ecosystem services has given relatively less consideration to alterations in intensity and pattern [9]. Notably, the Tibetan Plateau, one of the world’s most ecologically fragile regions, faces anthropogenic disturbances from nomadic activities, urbanization, and modern tourism. In this complex landscape, land use changes are multifaceted [10]. Consequently, there is an immediate need to comprehend the intricate interplay between land use types, intensities, and ecosystem services on the Tibetan Plateau, as well as their dynamic mechanisms [11, 12]. This understanding is paramount for steering the region towards sustainable development.
Quantitatively assessing ecosystem service supply and demand enhances our comprehension of the value and significance of natural ecosystems. Typically, assessment methodologies revolve around indicator calculations [13]. Currently, the Integrated Valuation of Ecosystem Services and Trade-offs model (InVEST) stands out as the most well-established and widely employed model [14].
The Qinghai-Tibet Plateau boasts distinctive natural environmental attributes, serving as a vital area for biological species’ origin and evolution, along with biodiversity conservation in China. Abundant local vegetation types and substantial soil carbon reserves position it as a significant carbon reservoir within China [15, 16]. Nevertheless, the plateau, known as the “water tower of Asia,” faces substantial imbalances in water reserves due to global warming, particularly between 2000 and 2020, with profound ecosystem consequences [17]. In this study, we explore the spatial and temporal evolution of ecosystem services on the Qinghai-Tibet Plateau, focusing on three key services: habitat quality, carbon storage, and water conservation [18]. While many scholars have evaluated ecosystem services and examined the interplay between land use changes and the Tibetan Plateau’s ecosystem, most current studies center on specific regions and land types. Hopping demonstrated that global warming-induced degradation of alpine grasslands on the Tibetan Plateau leads to a decline in crucial ecosystem services, notably carbon storage [19, 20]. Meanwhile, Pan Yao established a positive correlation between changes in grassland area and shifts in habitat quality within the Tibetan Plateau hinterland’s Yellow River source area. In a different context, Wu harnessed an ecosystem service matrix model, utilizing the Land Use/Land Cover (LUCC) dataset, to quantitatively assess the supply and demand of 22 ecosystem services across China. On the other hand, Palacios-Agundez [21] employed an ecological footprint approach to meticulously quantify ecosystem services within the Basque Country between 2000 and 2010. Pena L [22] utilized a questionnaire to evaluate cultural services in the Basque Country, while Schild J E employed a market valuation approach to measure dryland ecosystem services [23]. However, studies addressing spatial and temporal shifts in ecosystem service supply and demand alongside land use changes across the Tibetan Plateau remain scarce. Investigating these dynamics is crucial for the systematic conservation planning of ecological barriers on the Tibetan Plateau [24].
This study holds critical importance in ecosystem service management. It advances our comprehension of the dynamic changes in ecosystem services on the Tibetan Plateau, assisting governments and decision-makers in meeting the increasing demand for these services. Furthermore, it lends support to the development of sustainable resource management policies for the continuous provision of ecosystem services. Additionally, this study offers valuable data support for land planning and management. By understanding the temporal and spatial variations in ecosystem service supply and demand, decision-makers can formulate more effective land use plans that align with ecosystem services, promoting ecological balance and preventing inappropriate land utilization. Furthermore, this research has far-reaching implications for ecological conservation. Detecting imbalances in the supply and demand of ecosystem services is vital for safeguarding fragile ecosystems, reducing vulnerability, and sustaining biodiversity and ecological sustainability in the Tibetan Plateau. In summary, this research is significant for sustainable development, land planning, ecological conservation.
This study seeks to quantitatively assess ecosystem services, including soil conservation, water production, and carbon sequestration, on the Tibetan Plateau from 1980 to 2020. To achieve this, we employ three ecological models, namely RUSLE, InVEST, and CASA, integrating both land use and socio-economic data [25]. Our objectives encompass determining the supply, demand, and supply-demand ratios of these ecosystem services. Furthermore, our study aims to pinpoint spatial and temporal variations within the supply/demand relationship and identify consistent trends in ecosystem services across the plateau. We will quantitatively present land-use metrics, encompassing land use change rates, intensity, and the provisioning of ecosystem services, to unveil the impact of land use alterations on each service’s functionality. In summary, our research endeavors to provide a comprehensive understanding of the interplay between land use changes and ecosystem service provision [26, 27]. This knowledge will serve as a valuable resource for guiding sustainable land use practices and ecosystem restoration within the pivotal ecological functional regions of the Tibetan Plateau.
Experimental
Research Area and Methodology
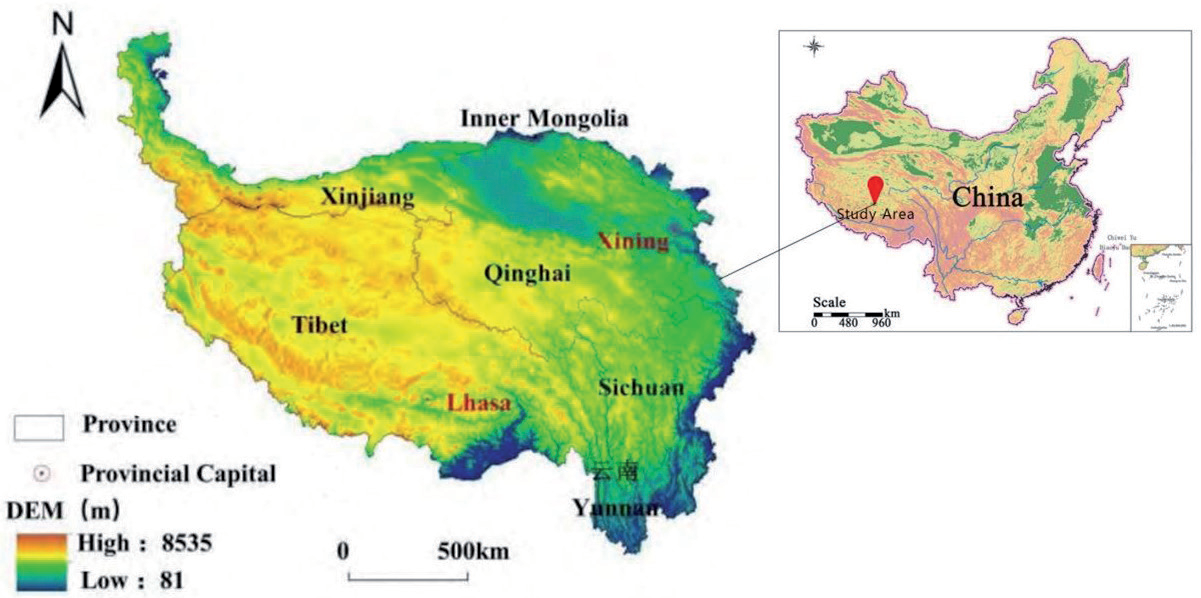
The Tibetan Plateau is situated in southwestern China, spanning Qinghai Province, the Tibet Autonomous Region, southwest Gansu Province, northern Sichuan, northwestern Yunnan, and southern Xinjiang Uygur Autonomous Region. Its coordinates range from 26°00’12′′ to 39°46’50′′N and 73°18’52′′ to 104°46’59′′E. Covering a vast expanse of 2.79×10⁶ km2, it constitutes 26.8% of the nation’s total land area. As the largest plateau in China and the highest on average globally, it boasts an average altitude exceeding 4000 m, earning it the moniker “Roof of the World.” The Tibetan Plateau experiences pronounced solar radiation, abundant sunshine, and significant diurnal temperature fluctuations. Its climate exhibits a distinct wet and dry pattern influenced by the southwest monsoon, featuring humid, rainy summers and cold, dry winters [28]. The plateau’s complex geomorphology encompasses plateaus, basins, and mountains, intricately woven to form the primary structure of the Qinghai-Tibetan Plateau. This region showcases diverse ecosystems, with alpine grasslands and meadows dominating the landscape. Its unique geographical attributes and rich ecosystems underline its role as a critical ecological security barrier for China (Fig. 1).
Data Sources
The research necessitates several data types: land use data, meteorological data, soil data, and digital elevation data. The five-period raster land use data spanning 1980 to 2020 were acquired from the Centre for Resource and Environmental Science and Data of the Chinese Academy of Sciences (http://www.resdc.cn) at 1 km resolution. Landsat remote sensing imagery is the primary data source. We conducted manual visual interpretation utilizing a two-tier classification system comprising 6 primary and 25 secondary types, relying on Landsat remote sensing images as the primary information source [29]. Data on soil depth and texture were procured from the National Earth System Science Data Centre, a national platform for scientific and technological infrastructure (http://www.geodata.cn). Precipitation and evapotranspiration data were sourced from the National Data Centre for Tibetan Plateau Science (http://data.tpdc.ac.cn). Digital elevation data were retrieved from the Geographic Data Platform of the School of Urban and Environmental Sciences at Peking University. In this study, geospatial information was obtained at a spatial resolution of 250 m from the Geographic Data Platform of the School of Urban and Environmental Sciences, Peking University (http:// geodata.pku.edu.cn). The data adhere to conventional academic structure and formatting, presented objectively without subjective evaluations unless explicitly marked [30].
Table 1.
Calculation Method of ecosystem service supply-demand.
Research Methodology
Calculation of the Ratio between Supply of and Demand for Ecosystem Services
In this study, we assess soil conservation services on the Tibetan Plateau using the Modified Universal Soil Loss Equation (RUSLE). The supply of soil conservation services is evaluated by measuring the difference between potential and actual soil erosion. Actual soil erosion represents the portion of ecosystem services that can be effectively managed and expected by humans. Consequently, this analysis characterizes soil conservation concerning the demand for soil erosion services [31]. The ecosystem’s ability to store freshwater resources through rainfall interception is referred to as the water production service. We estimate water production supply on the Tibetan Plateau using the water production component of the InVEST model. Water consumption, which denotes the quantity of ecosystem services utilized by humans, represents the demand for water production services. The objective of the carbon fixation service is to quantify an area’s capacity to sequester carbon. This service relies on the net primary productivity of ecosystems as an indicator and is based on the CASA model, which estimates carbon fixation service by considering the utilization of light energy. To determine the demand for carbon fixation service, we use regional carbon emissions as a conservative estimate (Table 1).
Table 2.
Calculation Method of ecosystem service supply-demand ratios and land-use patterns.
Calculation of the Ratio of Supply of and Demand for Ecosystem Services
In this study, we employed the Ecological Supply-Demand Ratio (ESDR) to evaluate the regional ecosystem’s supply and demand dynamics. A ratio exceeding 0 signifies a surplus state, while a ratio of 0 denotes equilibrium between supply and demand. Conversely, a ratio below 0 indicates a deficit state. The formula for computing this ratio is provided below [34].
Where S represents the supply of ecosystem services and D denotes the demand for ecosystem services. Smax represents the maximum value of the supply of ecosystem services, whilst Dmax refers to the maximum value of the demand for ecosystem services.
Calculation of Ecosystem Service Supply-Demand Ratios and Land-Use Patterns
The InVEST model allows us to integrate the supply-demand ratio of soil conservation services with land cover maps and land use patterns. This integration facilitates the assessment of habitat distribution and soil degradation across various landscape patterns. Our analysis identified drylands, urban areas, rural settlements, and other built-up lands as potential threats to soil conservation services. We constructed a table to evaluate soil conservation service quality, enabling the calculation of supply-demand ratios and land-use pattern scores for each raster unit on the Tibetan Plateau from 1980 to 2020 [35]. Water yield primarily depends on precipitation and evapotranspiration, with human-induced changes in land use indirectly affecting water yield. Calculations for the water production service supply/demand ratio and land use patterns are based on the principle of water balance, utilizing the InVEST model’s water production module. This model does not distinguish between surface water, groundwater, or baseflow but considers the remaining water after deducting actual evapotranspiration losses from precipitation for each raster. The model assumes that all remaining water converges and reaches the watershed outlet. The InVEST model’s carbon stock supply and demand ratio is utilized to link carbon fixation services with land use pattern calculations, specifically connecting them to the carbon pool density of each land type. Therefore, refining land use types can correspond to varying degrees of succession in the carbon stock supply and demand ratios within the same land type. In this study, we utilized the 24 land-use types of the Tibetan Plateau as specified in GB/T 21010-2017 as our foundational dataset. The carbon densities for each land-use type were determined through comprehensive reference to existing carbon stock research conducted within the Tibetan Plateau region (Table 2).
Results and Discussion
Spatial and Temporal Characteristics of Ecosystem Supply and Demand
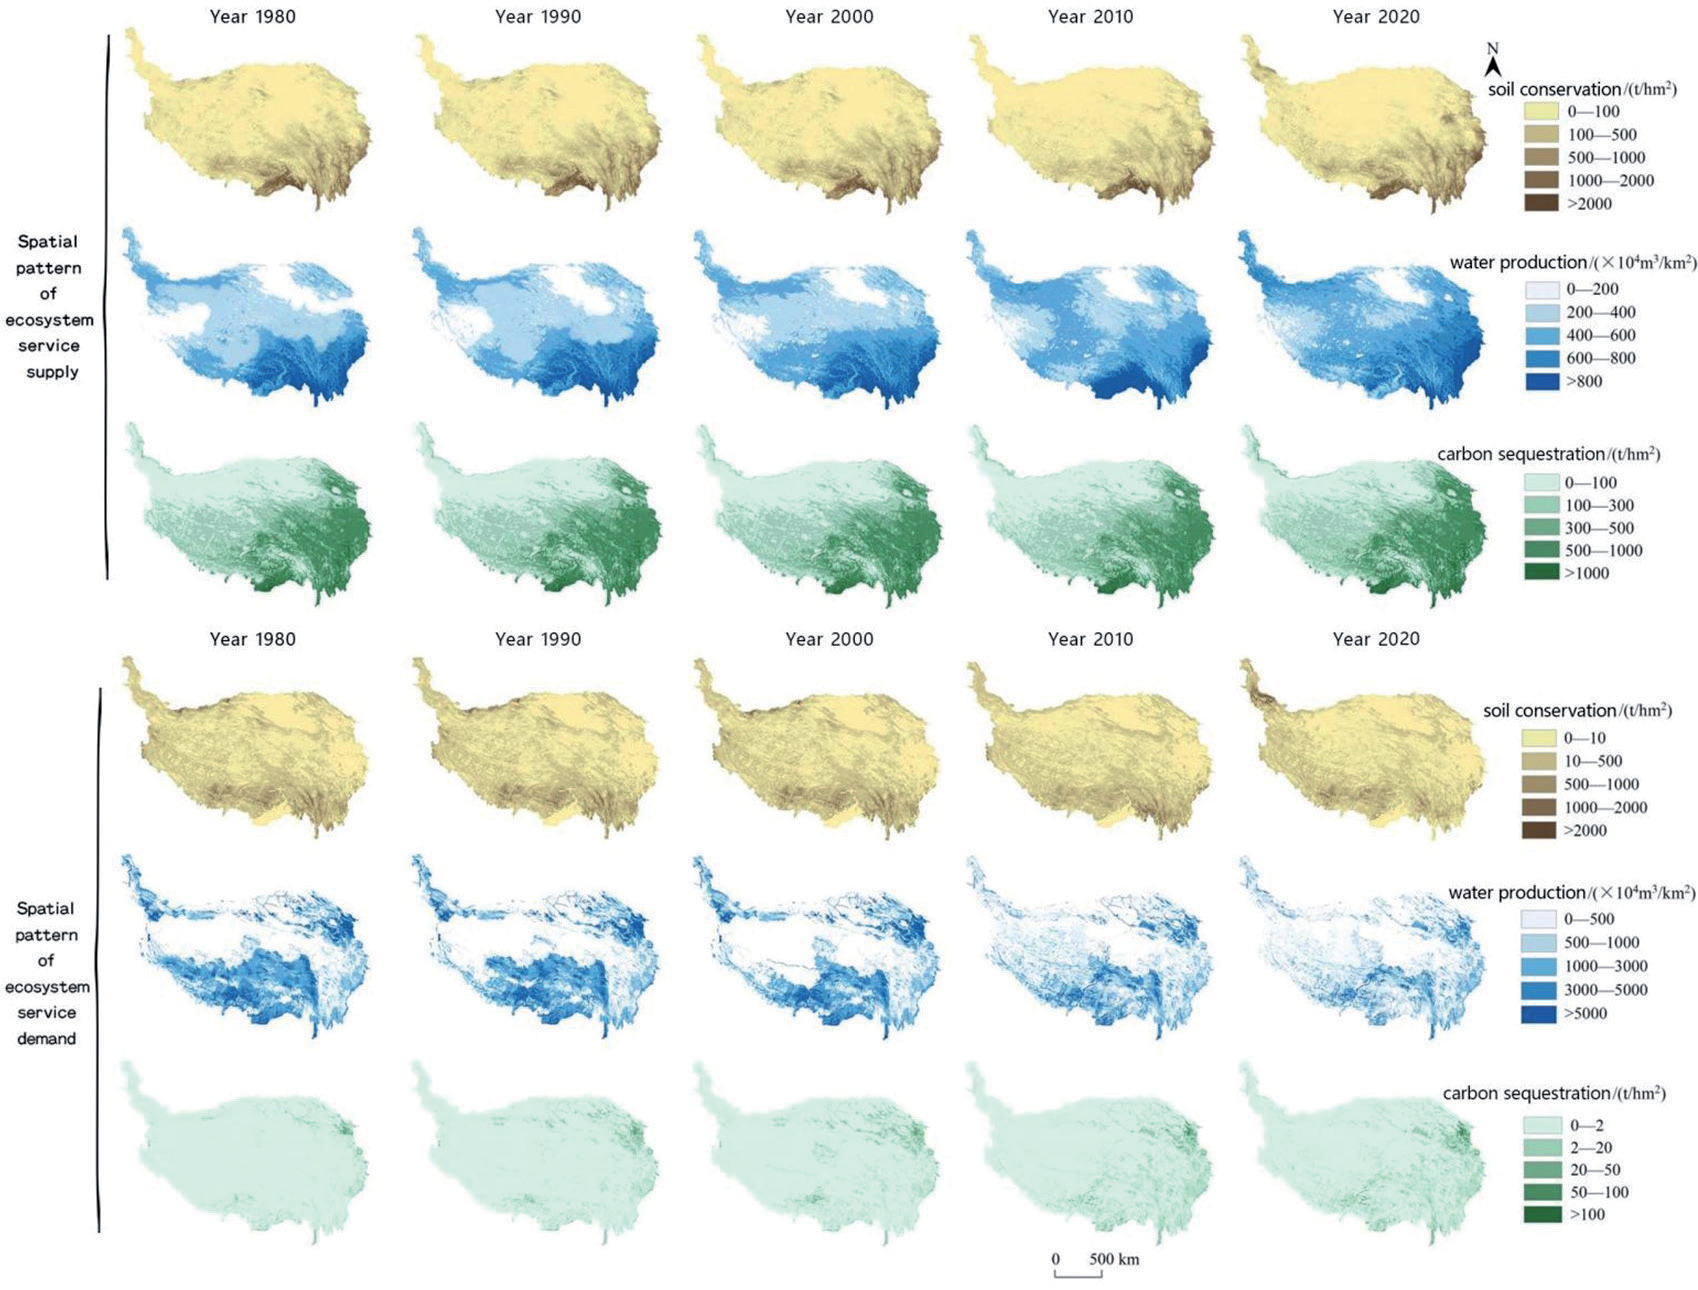
The supply of soil conservation services per unit area exhibited an irregular yet overall upward trend, rising from 193.64 t/hm2 in 1980 to 224.21 t/hm2 in 2020, marking a 15.78% increase. This upward trajectory was also observed in the supply of soil conservation services per unit area, which increased from 193.64 t/hm2 in 1980 to 224.21 t/hm2 in 2020, reflecting a 15.78% rise. Additionally, the provision of soil conservation services per unit area demonstrated an increasing trend, surging from 147.43 t/hm2 to 224.21 t/hm2, representing a notable 52.08% increase. Furthermore, during the period from 1980 to 2020, the availability of soil conservation services exhibited a geographic distribution pattern characterized by higher values in the southeast and lower values in the northwest. Between 2010 and 2020, high-value regions for the provision of soil conservation services expanded eastward and southwestward across the Tibetan Plateau, while low-value regions contracted towards the northwest. Conversely, the demand for soil conservation services per unit area experienced a declining trend, fluctuating from 139.31 t/hm2 in 1980 to 122.92 t/hm2 in 2020, marking an 11.76% decrease [37]. This demand distribution between 1980 and 2020 revealed a pattern with higher demand in the southwest and lower demand in the northeast. The low-value region extended northwestward and took on a point-like shape, predominantly encompassing areas south of the Kunlun Mountains, west of the Cocoanutian Mountains, and east of the Bayan-Ka-La Mountains [38].
The water supply per unit area has shown a fluctuating upward trend, increasing from 432.54×10⁴ m3/km2 in 1980 to 496.15×10⁴ m3/km2 in 2020, marking a 14.7% increase. This pattern of water supply per unit area on the Tibetan Plateau follows a regional distribution, characterized by higher levels in the southeast and lower levels in the northwest between 2000 and 2020. During this period, the high-value area gradually reduced towards the southeast, while the low-value area contracted in size. Furthermore, there has been an overall upward trend in water demand per unit area, rising from 2046.05 m3/km2 in 1980 to 2199.47 m3/km2 in 2020, representing a 7.49% growth. Specifically, the water demand per unit area on the Tibetan Plateau increased from 2046.05 m3/km2 to 2482.03 m3/km2 between 1980 and 2010, indicating a 21.3% escalation. However, from 2010 to 2020, there was a decline in water demand per unit area, with a reduction of 11.38% [39]. Between 1980 and 2020, the water demand distribution on the Tibetan Plateau followed a pattern of being “high in the southeast and low in the northwest.” During this period, the demand decreased in the northwestern region but increased in the southeastern area from 1980 to 2010. This increase in water demand in the southeastern region can be primarily attributed to population growth and urbanization. However, from 2010 to 2020, there was a contraction in the high water demand area, with a gradual expansion of the low water demand area towards the south.
The supply of carbon fixation services per unit area has shown an oscillating upward trend, increasing from 278.31 t/hm2 in 1980 to 312.12 t/hm2 in 2020, marking a rise of 12.15%. During the period from 1980 to 2020, carbon fixation services on the Tibetan Plateau exhibited a distribution pattern characterized by higher values in the southeast and lower values in the northwest [40]. The high-value area expanded towards the northwest, primarily in regions with dense river networks and high vegetation coverage, such as the Yarlung Tsangpo, Nujiang, and Lancang rivers. The demand for carbon fixation services per unit area has steadily increased on the Tibetan Plateau from 1980 to 2020, indicating an upward trend. In 1980, the demand was 1.42 t/km2, while it grew to 6.51 t/km2 in 2020, representing a significant surge of 358.45% for carbon fixation services per unit area. The distribution pattern for the demand of carbon fixation services across the Tibetan Plateau during this time was characterized by higher values in the east and lower values in the west. From 1980 to 2020, the demand for carbon fixation services on the Tibetan Plateau exhibited a trend of higher values in the east and lower values in the west, with the high-value region gradually expanding towards the southwest, primarily distributed in the southern Qilian Mountain region and east of the Bayan-Ka-La Mountains [41] (Fig. 2).
Characteristics of the Supply-Demand Ratio for Ecosystem Services
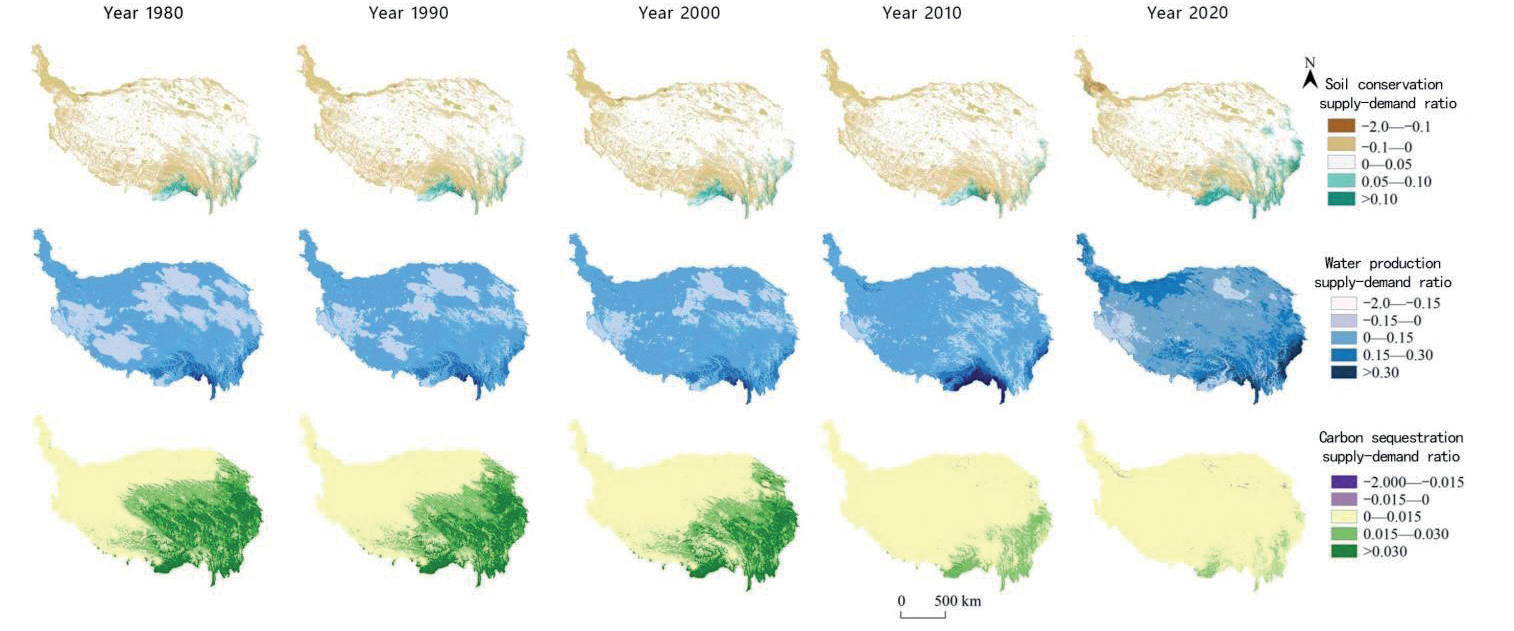
From 1980 to 2020, the supply and demand ratio for soil conservation services exhibited fluctuations, characterized by an overall upward trend with occasional local decreases. The ratio increased from 0.0025 to 0.0067, marking a significant 166% increase. Notably, between 2000 and 2018, the supply and demand ratio for soil conservation services on the Tibetan Plateau followed a pattern of “higher values in the southeast and lower values in the northwest.” During this period, the areas where the supply and demand for soil conservation services exceeded the demand expanded towards the southeast, forming a strip-like distribution in the Hengduan Mountains region [42].
From 1980 to 2020, the supply and demand ratio for water production services displayed an upward trend, with the ratio increasing from 0.0525 to 0.1156, representing a substantial 119.9% increase. Overall, the supply exceeded the demand. Between 2000 and 2018, this ratio exhibited a distribution pattern characterized by higher values in the northern and southern regions and lower values in the central region [43]. Notably, the supply increased in the northwestern part of the Qinghai-Tibetan Plateau, while the areas with supply surpassing demand expanded towards the southeast. This expansion was particularly prominent in regions with dense river networks, including the Nujiang, Lancang, and Dulongjiang Rivers, which are major water catchment areas [44].
From 1980 to 2018, the supply-demand ratio of carbon fixation services exhibited a declining trend, decreasing from 0.014 to 0.0046, marking a significant 66.41% decrease. Notably, the supply-demand ratio for carbon fixation services reached its peak in 2001 [45]. During this period, the distribution pattern of the supply-demand ratio for carbon fixation services remained consistent, with values being “higher in the southeast and lower in the northwest.” However, it’s worth noting that the high-value area in the southeast displayed a noticeable trend of contraction during this timeframe, moving in a southeastward direction (Fig. 3).
Evolution of Land Use Patterns on the Tibetan Plateau
Grassland, desert, and forest constitute the primary land types on the Tibetan Plateau, covering 92% of its total area and playing a crucial role in shaping its landscape. From 1980 to 2020, the land use composition on the plateau remained relatively stable. However, there were notable changes in specific land types. Over this period, the area of cropland, woodland, and desert decreased, with desert experiencing the most pronounced reduction (1.3%), followed by cropland (0.4%), woodland (0.1%), and forest (0.1%). Conversely, the areas of grassland, wetlands, and built-up areas expanded. Notably, built-up areas saw the most substantial growth (58.4%), followed by wetlands (4.6%) and grassland (0.3%). The spatial distribution of land use remained consistent throughout the study period. Deserts predominantly occupied the northwestern part of the Tibetan Plateau, while forests were concentrated in the southern region, and arable land was situated along the eastern border (Table 3).
During the 1980-2020 period, the majority of land remained unchanged within the six defined land classes. Among these land types, transfers involving cropland, forest, and desert were primarily driven by conversions from grassland, contributing rates of 76%, 47%, and 59%, respectively. Conversely, the transfer of grassland and wetland was primarily influenced by desert conversions, with contribution rates of 75% and 52%, respectively [46]. Additionally, 44% of land transfers to built-up areas originated from cropland. Notably, the conversion of land from desert to grassland and wetland significantly exceeded the conversion from grassland to cropland, forest, and desert (Table 4).
The land-use intensity was measured on the basis of county-level units from 1980 to 2020, and adjusted by the natural breakpoint method according to the characteristics of data distribution. The county-level land-use intensity during the study period was divided into six levels of very low, low, low, high, high and very high according to the grading criteria of <2.03, 2.04-2.48, 2.49-2.89, 2.90-3.43, 3.44-4.17 and >4.17. Between 1980 and 2020, the average land use intensity of the Tibetan Plateau showed a trend of increasing and then slightly decreasing, with the highest average land use intensity of 2.234 in 2010 and the lowest of 2.226 in 1980. During the study period, the land use intensity of the Tibetan Plateau was 1.0-2.03, 2.04-2.48, 2.49-2.89, 2.90-3.43, 3.44-4.17 and >4.17. During the study period, the pattern and number of counties with land use intensities of 1 and 6 remained unchanged on the Tibetan Plateau. However, the number of counties with intensities of 3 and 5 increased and the number of counties with intensities of 2 and 4 decreased. Land use intensity increased in some counties in the southwestern, eastern and southeastern parts of the Tibetan Plateau. Overall, the distribution pattern of land use intensity in the Tibetan Plateau has remained basically stable. It shows a spatial pattern of “high in the southeast and low in the northwest” (Fig. 4).
Table 3.
Land use transfer matrix in the Qinghai-Tibet Plateau from 1980 to 2020 (km2).
Table 4.
Land use transfer matrix in the Qinghai-Tibet Plateau from 1980 to 2020 (km2).
Combined Value of Multi-Ecosystem Service Supply-Demand Ratios in Land-Use Patterns
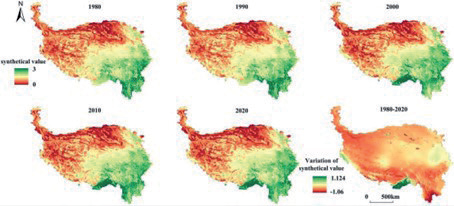
Normalized Multi-Ecosystem Services (MES) were computed to derive the aggregated MES supply-demand ratios within the land use pattern. The spatial pattern of these combined MES supply-demand ratios in the study area remained fundamentally consistent throughout the period from 1980 to 2020 [48]. It exhibited a gradual increase in combined MES supply-demand ratios from the northwest to the southeast. The most prominent change occurred between 1990 and 2000, with a noteworthy expansion of the high multiservice areas in the southeast and a corresponding enlargement of low multiservice supply-demand ratios in the west. Throughout the study period, a substantial portion of the Tibetan Plateau experienced a decline in ecosystem service supply-demand ratios, signifying a prevalent decrease in these ratios across the region. This decline in ratios followed a “C” shape, encompassing the northwestern and southeastern regions of the Tibetan Plateau. Notably, only the Ari region in Tibet’s west, the Bayin’guoleng Mongolian Autonomous Prefecture in Xinjiang’s north, the eastern fringe, and Tibet’s Shannan and Linzhi cities in the south demonstrated an increasing trend in ecosystem service supply-demand ratios [49] (Fig. 5).
Discussions
The significance of land use intensity, a critical factor in uncovering the impact of human activities on ecosystems and guiding the management of human-land interactions, has frequently been overlooked in studies examining the relationship between land use and ecosystem service supply-demand ratios. In this study, we analyze the alterations in both land use types and intensities, as well as the ratios of ecosystem service supply and demand on the Tibetan Plateau from 1980 to 2020, and their interconnections [50]. Over this period, the land use pattern on the Tibetan Plateau has undergone consistent changes, notably the transformation of deserts into grasslands and wetlands. This transformation can be attributed primarily to warmer and wetter climatic conditions in recent years. Population growth and urbanization have driven the conversion of arable land in Lhasa and the eastern fringe of the plateau into developed areas. Additionally, the area of arable land on the plateau has experienced fluctuations, initially increasing and subsequently decreasing due to factors like the return to agriculture policy and the degradation of the primary industry. These changes have shifted from an upward trend to a decline.
Fig. 4.
Spatial distribution of land use intensity and land use type in the Qinghai-Tibet Plateau from 1980 to 2020.
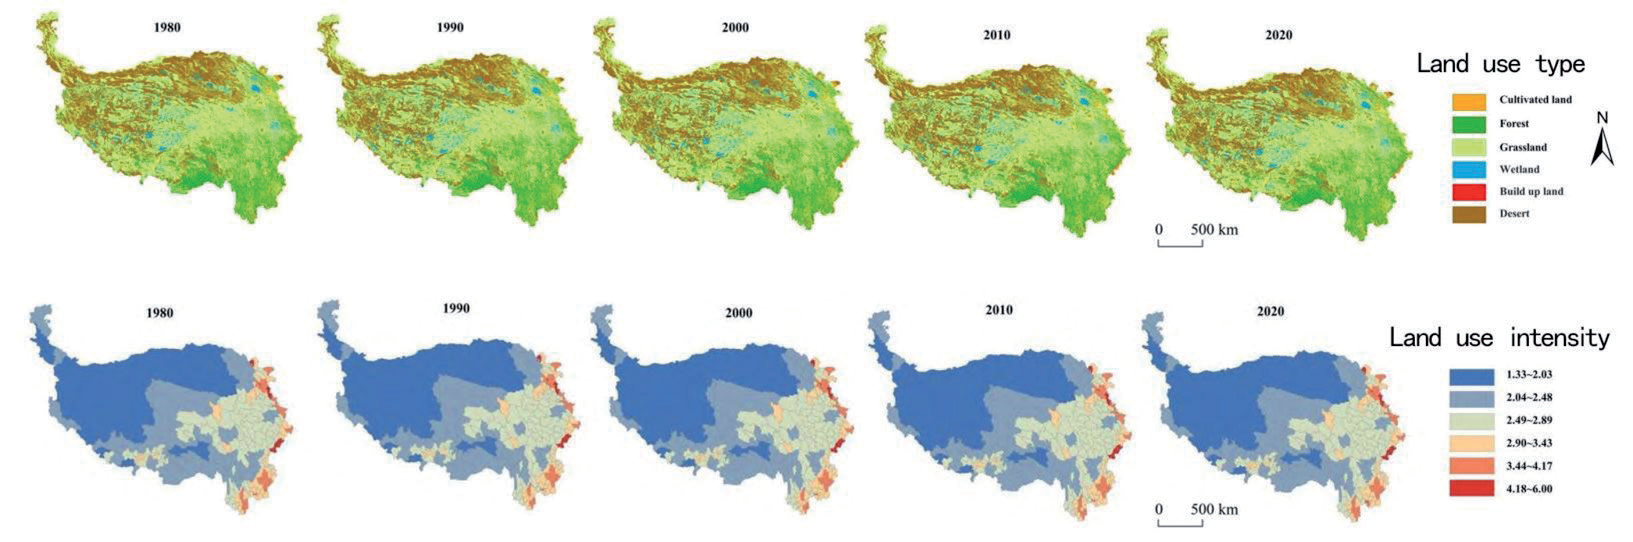
Fig. 5.
Spatial value of multi-ecosystem services supply-demand ratios in land-use patterns in the Qinghai-Tibet Plateau from 1980 to 2020.
From 1980 to 2020, Shannan and Linzhi cities in Tibet experienced a decrease in land use intensity alongside an increase in the supply-demand ratio for all three ecosystem services. Conversely, higher land use intensity, driven by human activities, was associated with a clear trend of decreasing supply-demand ratios for these services in areas like Dali, Yunnan Province; Chengdu, Sichuan Province; and Lhasa, Tibet, on the Tibetan Plateau. However, the results of this study are significantly constrained by data precision and model functionality. Firstly, different datasets on the Tibetan Plateau are utilized in varying ways, often yielding contradictory trends and changes even at the same resolution. Therefore, the establishment of a standardized exponential modelling of ecosystem service levels on the Tibetan Plateau and improved data accuracy are imperative for effective future conservation planning in this region. Furthermore, uncertainties persist regarding the simulation accuracy of the InVEST model employed in this study, despite its efficiency as a tool for investigating the spatial and temporal evolution of ecosystem service supply-demand relationships. For instance, factors influencing soil conservation service supply-demand ratios, carbon fixation service parameters, and water production service parameters were derived from studies in different regions. To enhance simulation accuracy, it is vital to adapt this data to the unique ecological conditions of the Tibetan Plateau through local revisions and by integrating field studies and experimental analyses.
Conclusions
Grasslands and deserts constitute the primary land categories on the Qinghai-Tibetan Plateau. The land use pattern on this plateau remained relatively consistent from 1980 to 2020. Notable changes include a reduction in cropland, forest land, and deserts, with the most substantial decrease observed in the desert area (1.3%). Conversely, there has been an upward trajectory in the areas of grasslands, wetlands, and construction land, with construction land experiencing the most significant expansion (58.4%). The dominant land use category has remained stable in land use transfers. Land use intensity typically follows a spatial pattern, characterized by higher intensity in the southeast and lower intensity in the northwest. This pattern has shown a growing trend in the southeast. From 1980 to 2020, the supply-demand ratios of the three services have exhibited a progressive increase from the northwest to the southeast. Specifically, the demand-supply ratio for soil conservation services across the Tibetan Plateau has demonstrated an overall upward trend. In the northwest and south-central regions, this ratio is increasing, while in the eastern part of the plateau, it is decreasing. Meanwhile, the annual average water production service on the Tibetan Plateau initially increased and then decreased. The decrease occurred in the northwestern and southeastern regions, while the southern, western, and north-central parts of the plateau experienced an increase.
Land use change significantly influences ecosystem services. The reduction of desert areas contributes, to some extent, to improving the supply-demand balance of soil conservation and carbon sequestration services on the Tibetan Plateau. Forested areas play a vital role in maintaining the supply-demand equilibrium of ecosystem services. Notably, areas with high soil conservation quality, carbon sequestration, water production, and the supply-demand ratio for these services are primarily concentrated in the southern forested regions of the Tibetan Plateau. Conversely, regions with low values are mainly found in the northwestern desert areas. The relationship between land use intensity and the supply-demand ratios of ecosystem services exhibits distinct spatial variations. Land use intensity significantly impacts the supply-demand ratios of soil conservation and carbon fixation services, but its effect on changes in water production services is limited. Prefectures where changes in land use intensity strongly influence the supply-demand ratio for soil conservation and carbon fixation services are primarily located in the central-western, southern, and central-eastern Tibetan Plateau. Meanwhile, prefectures where land use intensity has a more pronounced impact on the supply-demand ratio for water production services are mainly situated in the central, western, and southern regions of the Tibetan Plateau.
Recognizing inherent limitations is crucial. Firstly, data availability and quality present significant challenges, potentially limiting the study’s scope and precision, especially in specific regions. Secondly, the study necessitates more advanced modeling, involving complex ecological models and geographic information systems to replicate the temporal and spatial dynamics of ecosystem service supply and demand. Additionally, the study may not comprehensively address the future impacts of climate change on ecosystem services, despite the Tibetan Plateau’s heightened vulnerability. This oversight could affect the formulation of future climate adaptation strategies. Furthermore, regional disparities may impede the applicability of the study’s findings, as variations in ecosystem service supply and demand due to geographical and ecological differences might restrict the generalizability of the results. Lastly, the impact of socio-economic factors on land use and ecosystem services deserves thorough consideration. Despite their pivotal role in decision-making and practices, they have not received adequate attention in the study.
Future research initiatives should aim to address these limitations, including enhancements in data quality, advanced modeling techniques, comprehensive examinations of climate change adaptation strategies, regional disparities, and a thorough exploration of socio-economic factors. Collaborative, multidisciplinary research and increased community engagement are essential for a comprehensive understanding and resolution of ecosystem service supply and demand issues within the Tibetan Plateau. In summary, while this paper offers valuable insights, further research is imperative to advance our understanding, better conserve the unique ecological environment of the Tibetan Plateau, maintain its ecological balance, and implement sustainable development and climate adaptation strategies.

