

Introduction
More than 300 species of microorganisms live on the surface of cereals, including fungi, yeasts, and actinomycetes [1]. The microbial composition significantly varies depending on the stage of grain development, environmental factors, and postharvest storage. Soon after the emergence of ears, cereals are colonized by bacteria, which are replaced by yeasts after flowering and eventually by fungi [2]. Fungi can seriously affect grain quality, leading to discoloration, reduced germination, and mycotoxin production [3]. The contamination of cereals with fungal mycotoxins, such as aflatoxin and ochratoxin, poses a serious risk to food safety, human and animal health [4, 5]. A distinctive feature of invading fungi is the secretion of several enzymes, including xylanases, polygalacturonases, pectate lyases, and lipases. These enzymes are the key factors in nutrient acquisition, host colonization, virulence, and ecological interaction [6, 7]. The availability of complete fungal genome sequences has greatly contributed to a better understanding of plant-fungi interactions, fungal pathogenicity, and plant defense mechanisms [8].
Besides, phytopathogenic fungi can be identified by DNA diagnostics. For example, Phacidiopycnis washingtonensis and Sphaeropsis pyriputrescens (causing apple spotted rot and Sphaeropsis rot) can be detected by PCR [9]. McNeil et al. [10] used other PCR methods for diagnosing systemic infections Sporisorium scitamineum in sugarcane. In addition, Oğuz and Karakaya [11] investigated the spread of fungal infections in barley and corn varieties with different resistance. Keriö et al. [12] reported DNA extraction from pure cultures of pathogens and several endophytic fungi followed by the identification by qualitative PCR. These authors used amplified Heterobasidion annosum DNA.
Different results were obtained in the field of phytopathogenic fungi diagnostics. Traditional methods of fungal disease diagnostics rely on visible signs of phytofungal infections, including fungal sprouts (in particular, conidia, sclerotia, or mycelium visible on the outer plant surface) or fungal disease symptoms caused by fungal pathogens [13]. These approaches are the cornerstone of fungal disease diagnostics. Among the widely used traditional methods, isolation and cultivation, re-cultivation, microscopic methods, and biochemical tests are of utmost importance [9]. Nevertheless, these methods have some drawbacks of being tedious and requiring knowledge and experience in fungal plant pathology and taxonomy [14, 15]. Immunology-based diagnostic methods rest on the principle of antigen-antibody binding. Scientists have noted a few problems in this context, such as low sensitivity, assay affinity, and potential contaminant interference [16]. In addition, the detection of fungal plant pathogens has not been sufficiently effective due to the high inconsistency and phenotypic serological plasticity of fungi [9]. Thus, the introduction and development of new effective diagnostic methods for the control of fungal plant diseases is of relevance. For these reasons, plant and fungal diagnostics use molecular approaches that facilitate the recognition and quantification of pathogens. Molecular tests can overcome the shortcomings of traditional and serological methods used for diagnosing fungi in various crops, including cereals. There are several criteria for determining barley and wheat resistance to fungi, which can be expressed as follows: 1) the inability of fungus to penetrate the shield, 2) no fungal hyphae in the growth point, although they can be present in the shield, and 3) the fungus hyphae (that do not cause ear infection) can be present at the growth point [17]. For other pathosystems, plant resistance has proven useful. It can be detected by quantifying the pathogen in the host cells, such as PCR [18, 19].
Given the sporadic nature of the studies devoted to the effects of phytopathogenic fungi on industrial cereal crops (in particular, common barley) and fungi distribution in the tissues of this crop, the purpose of this paper is to describe the infection of barley leaves and stems with phytopathogenic fungi of the genus Fusarium. In the present study, the researchers used the following two approaches: an observation of the fungus spread in plants using microscopy and a quantification of fungus growth using real-time PCR. The above approaches complement each other and can be potentially useful in the development of ecological barley protection methods that increase barley resistance. To achieve the set purpose, the authors defined a few objectives. Firstly, they are to study the isolates of pathogenic fungi under a microscope with their visualization using fluorescent staining. Secondly, phytopathogenic fungi Fusarium sp. should be assessed using real-time PCR. The last objective implies incorporating ecological approaches aimed at barley protection from phytopathogenic fungi.
Methods and Materials
Plant Material and the Assessment of Barley Infection
Barley samples were selected within one year, following climatic and agrotechnical factors that could affect the condition of plants and fungi populations. Leaves and stems of common barley (Hordeum vulgare L.) naturally infected with phytopathogenic fungi of the genus Fusarium (F. cerealis and F. proliferatum) were collected from various lines grown on an agricultural research farm. As a control, the researchers used plants obtained from barley seeds devoid of fungus infection signs, i.e., healthy. The experiment involved 40 plants in the infected group and 20 plants in the healthy group (control). Isolation and purification of fungal isolates were performed according to Garg and Gupta [20]. Below is a description of these authors’ methodology:
Isolation and cultivation of fungal isolates:
The preparation of inoculant: Fungal inoculant was prepared by producing a spore suspension in sterile distilled water, which was then distributed in a shaker incubator at 28±2ºC.
The Study in vivo and in vitro
Fungal isolates were inoculated on the leaves of bean plants. For in vitro studies, the leaves were separated and processed to ensure the entry of fungi. The samples were collected during different time intervals after inoculation.
The measurement of chitinase activity:
Chitinase activity was measured as a release of NAG with colloidal chitin as a substrate.
Chitinase purification:
Chitinase purification consisted of three stages: heating to 50ºC, ammonium sulfate precipitation, and elution through the Sephadex G-25 column. The purified fractions were tested for purity and chitinase activity.
The study of temperature, time, and substrate effects:
The alteration of the parameters and the subsequent analysis of enzyme activity allowed for studying the effect of temperature, time, and concentration of colloidal chitin on chitinase activity.
The study of the crude enzyme effect:
The study of chitinase activity at different concentrations of crude enzyme aimed to determine the maximum concentration.
The protein content test and analysis by the SDS-PAGE method:
The protein content was measured in crude and partially purified fractions. The analysis of the purity and molecular weight of chitinase involved the SDS-PAGE method.
For visualization, the researchers collected plant material from barley leaves and stems. The latter were stained with trypan blue [21] and examined using light microscopy. We used the method of staining samples using a trypan blue and subsequent visualization based on light microscopy. This method included several stages. First, to improve the contrast between healthy and damaged (later stained) tissue, we removed chlorophyll from the tissue of the separated leaves by soaking them in a transparent solution. The solution consisted of ethanol and acetic acid in a ratio of 3:1 (volume/volume). After that, the leaves were soaked in a solution of trypan blue. This solution penetrates through damaged cell membranes but is not absorbed by living cells. Further, we assessed and visualized the damage at the leaf level.
To confirm that staining occurred only in the damaged areas, the samples were examined with an inverted fluorescence microscope. For a more accurate visualization of the damage, the samples underwent double staining using trypan blue and aniline blue dyes. Aniline blue colors the callose, including the callose formed around the damaged areas. After that, the leaves were extracted from the samples and examined using a light microscope.
Node Fusarium hyphae were studied on whole specimens stained by the method proposed by Carreño et al. [22]. The method is as follows: To carry out the staining of hyphae mushrooms, we took 1 ml of a solution with conidia (107 conidia/mL) and centrifuged it at 10,000 × g for 10 minutes. The resulting sediment (pellets) was isolated by removing the supernatant. Conidia were resuspended in 200 ml of solution and incubated for 24 hours at 37ºC or 65ºC in a temperature-controlled bath. After that, the conidia were washed twice with distilled water to remove unbound fluorescent dyes. The conidia were then transferred to a new test tube and washed twice with distilled water again. Finally, the conidia were resuspended in 200 µl of distilled water. To visualize the results, we placed 1 µl of colored conidium suspension on a slide in a microscope and observed it with a confocal microscope. Water or DMSO served as a control on slices obtained by hand and then stained with Uvitex 2B fluorochrome [23]. This method implied the rapid staining of infected wheat leaves to visualize fungal structures. The fixing and cleaning were one stage and used a solution of ethanol and acetic acid. This option significantly reduced the time (to 1 hour). Before the staining stage, the samples were soaked in Tris–HCl solution (pH 8.5). Visualization used Uvitex 2B (0.3%) dye heated at a high temperature. This method allowed for observing various fungal structures using wide-field microscopy.
The DNA Extraction and Real-Time PCR
The cultivation of Fusarium cerealis and Fusarium proliferatum involved a standard nutrient medium based on peptone and malt additives. This medium provides the necessary nutrients for the growth and development of fungi. The cultivation process takes place at a temperature of 28º C.
The composition of the nutrient medium for the cultivation of these Fusarium varieties can be as follows:
Peptone – 5 g (a source of organic nitrogenous compounds, a nutrient component for fungi).
Malt – 10 g (a source of carbohydrates that can foster the growth of fungi).
Agar-agar – 15 g (used for the preparation of agar plates; provides the helification of the medium).
Distilled water – 1000 ml.
Phosphate buffer pH 7.4 – to maintain the optimal pH of the medium.
The process of cultivating fungi in this medium begins with the placement of fungal spores or hyphae on the surface of the medium. The fungi grow at a temperature of 28ºC for 8 hours. As a result, the hyphae are actively developing. Subsequently, the hyphae are collected from the plates of the medium and homogenized using a microtube and a pH 7.4 phosphate buffer. This process reveals a uniform hyphae mass, which can be useful for further research.
Fusarium cerealis and Fusarium proliferatum crops were kept at 28ºC on standard peptone agar medium with the addition of malt for 8 hours. The grown fungi hyphae were carefully collected from the plates. They were further homogenized with an Eppendorf microtube homogenizer and phosphate buffer pH 7.4.
Next, the material was disintegrated using USDN- 2T equipment. The resulting homogenate was centrifuged at 1500 × g for 15 minutes in the Biofuge Stratos centrifuge by Heraeus. DNA was isolated from F. cerealis, F. proliferatum, and both infected and healthy barley tissue using the Monarch® Nucleic Acid Purification Kit (New England Biolabs Inc., USA). In this case, the authors accurately followed the provided instructions. To validate the used primers, the authors employed Vector NTI 10 software. Real-Time PCR was conducted utilizing the Luna® Core Kit (New England Biolabs Inc., USA). Regarding fungal studies, Real-Time PCR can diagnose and quantify the presence of fungi in plant tissue samples.
Table 1.
Real-Time PCR.
The Real-Time PCR (real-time polymerase chain reaction) method is a powerful tool for the detection, quantification, and analysis of specific DNA or RNA in biological samples. In particular, it detects the genetic material of fungi. It determines the amount of the studied genetic material in a sample with high accuracy and sensitivity. Below is a detailed description of the stages of the Real-Time PCR Assay method for analyzing fungi:
1. DNA isolation: The first stage is DNA isolation from samples of plant tissues (for example, affected or healthy leaves and stems). This stage includes molecular methods, for example, the use of DNA extraction with specialized kits and reagents. Isolated DNA is the target material for further PCR.
2. The selection of primers: For the analysis of specific fungal species or genes, it is necessary to select specific primers - short nucleotide sequences that will amplify only the target genetic site. These primers are developed based on known sequences of fungi genes.
3. Reaction mixture preparation: A test tube contains a reaction mixture, including DNA samples, primers for amplification of the target genetic site, a thermally stable enzyme DNA polymerase, nucleotides, and reagents for detection.
4. Real-Time PCR: The reaction mixture is placed in a Real-Time PCR device, also known as a thermal cycler. This device performs many heating and cooling cycles, which include DNA denaturation (separation of two DNA strands), amplification of the target gene, and signal detection.
5. Signal detection: During each cycle of the thermal cycler, if the target genetic material is present, primers bind to it and DNA polymerase begins synthesis of the DNA chain. This process creates new copies of the target DNA. At this stage, specific fluorescent molecules can detect an increasing amount of DNA. These molecules emit a signal in the presence of amplified DNA. The actual time of detection is recorded at each cycle.
6. Quantitative analysis: Ultimately, the number of cycles required to reach a certain threshold signal level (threshold cycle, Ct) determines the baseline amount of target DNA in the initial sample. The lower the Ct value, the larger the baseline amount of target DNA in the sample.
This study used a set of primers and a set of real-time reactions to analyze the DNA of pathogenic fungi. Table 1 describes specific primers and PCR conditions in detail.
Statistical Analysis
The one-way ANOVA method helped process the obtained research results for reliability. To this end, the study applied Microsoft Excel and Statistica 10 [24]. The experiment followed a randomized block design and was repeated six times. Differences in the obtained results were significant at P≤0.05 according to the Student’s t-test.
Results
Microscopic Analysis of the Pathogenic Fungi Isolates
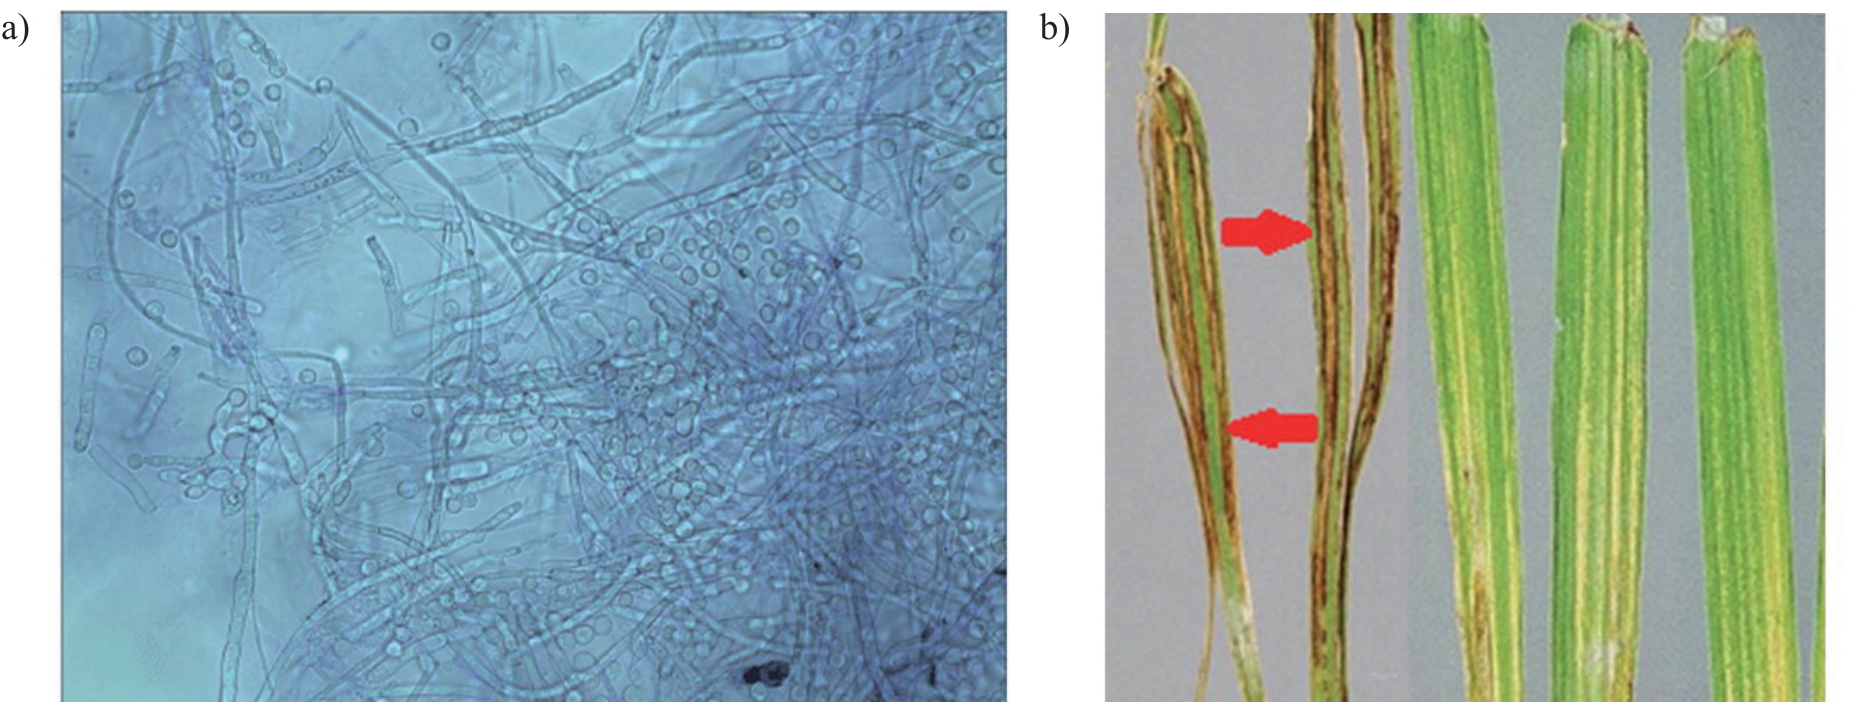
In barley samples stained with trypan blue, there were hyphae of Fusarium sp. predominantly observed in stems. Some plants also had infected leaves (Fig. 1).
The main part of the fungal mycelium was in the intercellular space. At the same time, the study also found intracellular growth. Typically, the use of trypan blue produced positive images with sufficient visibility and contrast to identify fungal mycelium (Fig. 1a). However, the plant cells that comprised tissues demonstrated varying maceration. Therefore, a study of fungal hyphae location in relation to each other within plant tissues was often not feasible. Fluorescent staining with fluorochrome produced the maximum possible results. With a combination of filters, the fungal mycelium takes on a bright blue hue. Thus color is very different from the host cells, which appear slightly greenish yellow (Fig. 1b).
The analysis of barley infection with pathogenic fungi conducted during the growth stage revealed the hyphae of Fusarium sp. at the top of shoots on average one week (6 to 8 days) after the beginning of active growth. Quantitative and qualitative hyphae indicators (the number of fungal hyphae and their density) increased rapidly, forming a dense network within the developing ear and stem tissue below it. In addition, there were hyphae in leaf tissues (Fig. 1b). Occasionally, stem colonization was partially delayed. The study found a complete colonization of stems and leaves about a month after sowing. The hyphae of Fusarium sp. were regularly and abundantly found in the infected plant nodes, where they concentrated predominantly near vascular tissues.
The Analysis of Phytopathogenic Fungi Using Real-Time PCR
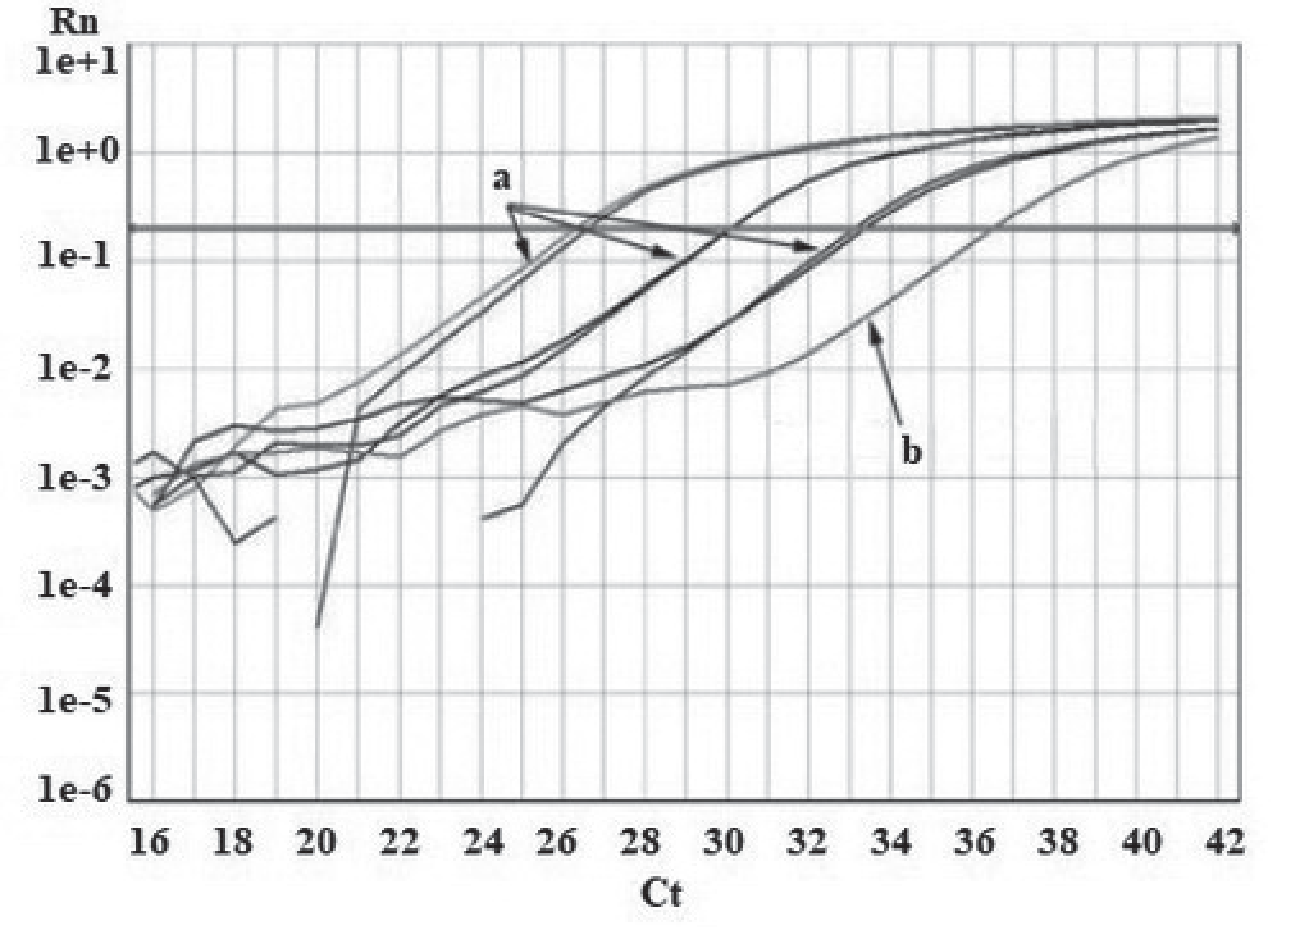
To obtain real-time PCR results, DNA was extracted from axenic cultures isolated from fungi Fusarium cerealis and Fusarium proliferatum and used at various concentrations. Fig. 2 shows the standard view of the amplification curve for a standard series of F. cerealis (3,000, 300, 30, and 0 DNA nanograms per milliliter). The highest concentration showed a cycle threshold (Ct) value of 26, while the non-matrix control Ct was almost 40 for both fungus and plant primers.
Dissociation curves display SMP (specific melting point) value, which was 87ºC in the obtained product. When the final preparation of the amplification curves occurred for standard runs with 7,000, 700, 70 and 0 ng/mL F. cerealis and F. proliferatum DNA, the authors obtained matching curves at Ct 17 for the maximum concentration indicators and 36 and 40 for non-matrix controls.
Moreover, amplification curves were obtained for healthy and infected barley stems and leaves. DNA extracts from infected barley stems and leaves showed Ct ranging from 26 to 30. These values corresponded to the concentrations of 300-3,000 ng/mL of F. cerealis and F. proliferatum DNA, respectively. At Ct 36, the DNA content of healthy barley leaves and stems was similar to that in non-matrix controls. The dissociation curves for F. cerealis DNA extracted from infected barley stems and leaves peaked at 87ºC, thus being identical to the peak obtained with pure F. cerealis DNA.
Fig. 3.
The sensitivity of F. cerealis quantification by real-time PCR in barley plant tissue. Extract taken from 1 specimen of the host plant with a low content of F. cerealis DNA (dashed line) and one plant specimen with high concentrations of F. cerealis DNA (solid line) were diluted with the pooled DNA extracted from plants with no traces of fungus. The average concentration of the pooled extract was 11 ng F. cerealis DNA/µg H. vulgare DNA.
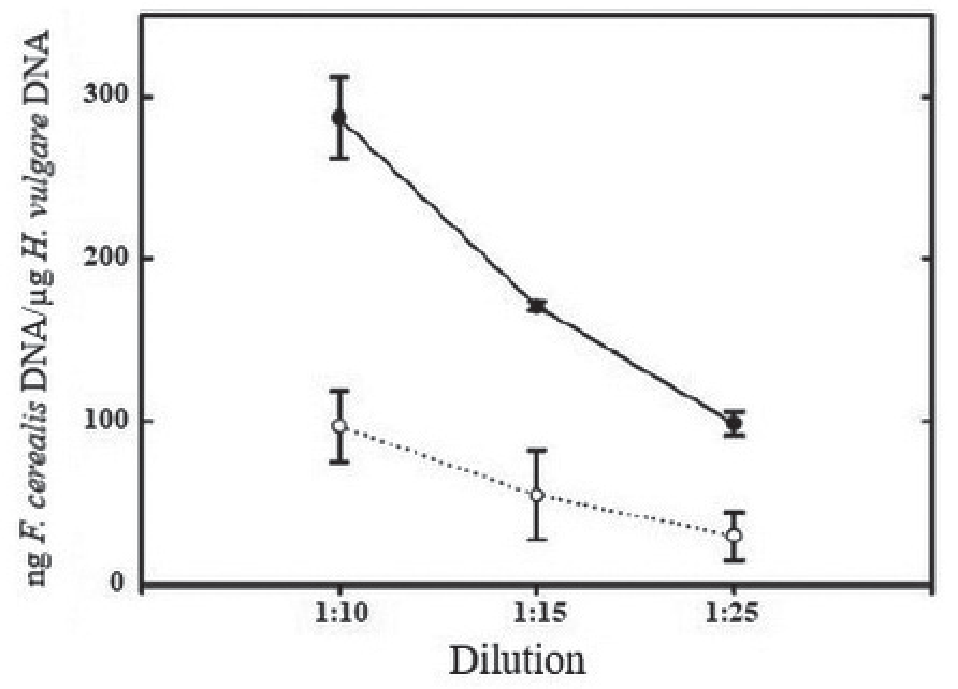
To find any relationship between the concentration of DNA in barley plant cells and the PCR results, DNA was extracted from plant cells presenting high and low DNA content. The DNA was further diluted with healthy plant extracts. Real-Time PCR determined and quantified DNA concentration level (Fig. 3).
When diluted at a ratio of 1:25, plant extracts with a high content of F. cerealis DNA still contained amounts of DNA significantly exceeding those measured in the extracted from plants not infected by the fungus. The study revealed the differences from the healthy plant extract when the plant extract with a low DNA content was diluted 1:10 but not 1:25. Regarding F. proliferatum, the DNA content of this phytopathogenic fungus was too low in barley leaves to be identified. Although the content of F. proliferatum in barley stems was higher, it was statistically insignificant as compared to F. cerealis. Thus, F. cerealis is the most harmful phytopathogenic fungus for barley culture in this experiment. Barley stems receive more extensive fungal damage in this case.
Ecological Approaches for the Protection of Barley Culture from Phytopathogenic Fungi
Continuous sowing of plants sensitive to pathogenic fungi, which are their hosts, can lead to the constant presence of colonies of these microorganisms in the soil. The crop rotation applied to the studied barley crop can prevent this situation. In this case, the crops have a lower infestation caused by soil pathogens, including fungal infections. Tillage has an indirect effect on the spread of pathogens. This study also used tillage to reduce the number of pathogen colonies in the soil column. In their algorithms, standard tillage mechanisms usually include primary and secondary cultivation to prepare the seedbed for sowing. This feature can cause processes of disturbance in the soil structure. In this regard, the authors used a single treatment of the soil cover. Thus, the soil was not disturbed and retained its structure. In addition, this soil treatment makes it possible to bury pathogens deeper, thereby significantly reducing the probability of plant infection.
Discussion
The study’s objectives included the validation of histological methods that could reliably and fairly quickly detect the mycelium of F. cerealis and F. proliferatum in barley leaves and stems. Most of the conducted histological observations concerned the F. cerealis pathosystem of barley. However, the observations of barley leaves and stems infected with F. cerealis and F. proliferatum did not show clear differences between these pathogenic fungi. As for the samples stained with trypan blue, they were not entirely satisfactory, since treatment with caustic soda heated to high temperatures in all cases led to a partial or full tissue maceration. Therefore, it was reasonable to use fluorescence microscopy with the use of fluorochrome, which is an optical brightener used as a fluorescent fungi stain [25]. In the present work, the best results were always associated with manually-made cuts. As a result of the slices, the authors obtained high-contrast photos, which made it possible to clearly distinguish fungal hyphae and host plant cells. The cleaning of pre-staining sections used lactic acid hydrate. This procedure proved to be an essential step for obtaining a high-quality image. For barley, previous studies reported that during seed maturation, phytopathogenic fungi did not only attack the scutellum. However, it also invaded the hypocotyl and apical meristem regions [11]. In this study, the stem initially devoid of fungal hyphae was infected in 3-5 days after the beginning of the active growth phase. The colonization of apical meristem occurred simultaneously with the colonization of leaf primordia. Pepe et al. [26] described the growth of fungal mycelium at the shoot tip. According to the results of these authors, the nodal tissues of the stem represent morphological barriers that the fungus must overcome on its way to the apical meristem. Other authors [27, 28] reported that in infected barley grains, germ leaves may be colonized before germination. Unlike some smut fungi, barley fungal infection usually has no epidemiological significance. In general, the observations made by researchers are in line with the studies of Le Fevre et al. [27], Lei et al. [29], and Punja et al. [30].
The following study tasks included testing a Real-Time PCR-based method that would be potentially suitable for characterizing the resistance of a particular barley variety. Since the study addressed the plants with varying severity of fungal infection, the researchers decided to initially develop a method for quantifying F. cerealis and F. proliferatum DNA isolated from infected barley stems and leaves. The reliability of real-time PCR was proven by plotting standard curves for various concentrations of F. cerealis and F. proliferatum DNA, derived from the cultures in vitro. For each of the two primers, the researchers used the amplified sequences that are conventional for several Fusarium species, including F. cerealis and F. proliferatum. Considering the practical aspect, it is insignificant due to the specialization of the host plants. In addition, no further infestation with other Fusarium species is possible under greenhouse conditions. The limit of detection of fungal DNA was about 50 pg/mL, and this value was within the range measured for other fungi by PCR [31-33]. The authors determined that the Real-Time PCR-based quantitative accounting of phytopathogenic Fusarium fungi in barley tissues can detect infected or healthy plants at the beginning of development. When used to evaluate seed treatments, it can save a significant amount of time and effort as compared to conventional field or greenhouse efficacy tests based on the counts of infested ears [34]. Fusarium mycelium staining with fluorochrome allows visualization of the pathogen spread in the cells and tissues of the host plant and may be combined with such quantification methods as Real-Time PCR.
To prevent the infection of barley crops with various pathogens, including phytopathogenic fungi, it is necessary to apply an integrated approach incorporating the fundamental principles of environmental protection. It was the third objective of this study, which, however, remained accomplished. An integrated approach with proven scientifically proven efficiency is crop rotation [35]. Complete crop removal only in isolated cases can lead to infection of the first barley crop if there is a 1-hour break in cereal production [36]. In fact, unchangeable cereal cultivation can lead to a phenomenon known as yield reduction [37]. Pathogens that develop outside the root zone tend to survive crop rotation. Nevertheless, if barley sowing is continuous, the fungus will not only persist but also move from the first crop to the second [38].
Another integrated grain crop protection approach is soil plowing. Reduced tillage of the soil cover or no tillage can increase the mass of the microbiota. It can also stimulate their activity in the topsoil as compared to conventional tillage or plowing [39]. This soil concentration of plant residues can promote overwintering and survival of multiple pathogens. It raises concerns that the practice of reducing crops may lead to increased morbidity and lower yields. Some studies confirmed this suggestion, but there are also reports of lower levels of plant infection with soil pathogens after a significant reduction in tillage [40]. Studies have previously proven that minimal tillage reduces barley spotting as compared to plowing [37]. The timing of inoculation is also important to avoid a large number of pathogens in an environment contributing to possible plant infections. An appropriate timing may reduce the severity of some diseases. For example, for fall barley crops, late planting may reduce the chance of infection of the new shoots by R. commune inoculum preserved from the previous barley crops produced in the given area [41].
Fungal plant diseases, such as fusarium, are a serious threat to agriculture, limiting the yield and quality of crops. A key aspect of effective management and control of fungal diseases is accurate diagnosis and assessment of their spread. Our study identified the potential of microscopy and polymerase chain reaction (PCR) as methods that can significantly improve the efficiency and accuracy of fusarium control.
The results of this study confirmed the capability of microscopic analysis to visualize the characteristic structures of pathogens and their interaction with plant tissues. Microscopy provides an opportunity for early detection of infection, identification of the pathogenesis stages, and the assessment of destructive effects at the cellular level. These data may be important for the development of specific control strategies and the selection of suitable fungicides.
Additionally, our study demonstrated that PCR can be a powerful tool for accurate diagnosis and quantification of fungal pathogens. The use of specific primers makes it possible to detect specific types of fungi with high sensitivity and specificity. This feature is especially important for controlling the epidemiological situation and monitoring the spread of pathogens in different regions.
The presented findings confirm the advantages of an integrated approach combining microscopy and PCR for the diagnosis and control of fungal diseases. This approach can accurately determine the presence and type of pathogen. At the same time, it can more effectively assess the degree of infection and its potential consequences.
In addition to our research, hypothetical studies by other scientists also confirm the importance of microscopy and PCR for the control of fusarium. For example, the study by Carreño et al. [22] demonstrates how microscopy identifies the features of histopathological changes caused by different types of fusarium. This approach can help more accurately determine the pathogenesis and develop targeted control strategies. The study of Martinelli et al. [42] focuses on the importance of PCR for detecting pathogens at early stages and monitoring their spread. The results of this paper emphasize the high sensitivity and specificity of PCR, which is crucial in the control of fungal infections.
Numerous factors, such as weather conditions, nutrient deficiencies, and so forth, can affect the health of plants and lead to symptoms similar to fungal infections. Our study aimed to determine the presence of fungal DNA in plants and their number. Nevertheless, there is an urgent need for additional research to reveal the factors that contribute to the development of the disease. This paper presents the PCR method in the context of the diagnosis of fungal plant diseases. PCR is not an absolute novelty in the field of diagnostics. However, our study attempted to highlight the potential application of PCR in addition to existing methods. At the same time, it is necessary to employ an integrated approach to effectively combat fungal diseases of plants. An integrated approach includes diagnostics, quantitative assessment, as well as other aspects. These findings may be the first step in understanding the potential application of PCR in this area. There is a need for a more accurate analysis of the cultivation impact on the obtained results. Future research will consider the inclusion of more detailed data on the origin of samples and growing conditions into the methodology.
Conclusions
This paper describes the results of assessing the infection of barley leaves and stems with phytopathogenic fungi of the Fusarium genus. The study included the analysis of barley infection with pathogenic fungi during the growth stage. The analysis showed the hyphae of Fusarium sp. at the top of shoots on average one week after the beginning of the active growth phase. Quantitative and qualitative indicators of hyphae increased rapidly, forming a dense network within the developing ear and stem tissue below it. About a month after sowing, the stems and leaves were completely colonized. In infected plants, the high-density hyphae of Fusarium sp. were regularly observed at the nodes, predominantly near vascular tissues. The main part of fungal mycelium was in the intercellular space. In some cases, it grew inside the plant cells. Generally, the use of trypan blue yielded good Fusarium visualization results in terms of fungal mycelium visibility and contrast.
To implement a Real-Time PCR-based method that would be potentially suitable for barley resistance analysis, the study performed DNA extraction from axenic-type cultures of Fusarium cerealis and Fusarium proliferatum. To this end, various PCR concentrations were used. The highest concentration from the standard F. cerealis species (3,000, 300, 30, and 0 ng DNA/ mL) showed a Ct value of 26, while the non-matrix control Ct was almost 40 for both fungus and plant primers. The researchers also obtained amplification curves for healthy and infected barley stems and leaves. DNA extracts from the infected barley stems and leaves showed Ct ranging from 26 to 30. These values corresponded to the concentrations of 300-3,000 ng/mL of F. cerealis and F. proliferatum DNA, respectively. At Ct 36, the DNA content of healthy barley leaves and stems was the same as in non-matrix controls. The dissociation curves for F. cerealis DNA from infected barley stems and leaves peaked at 87ºC, thus being identical to the peak obtained with pure F. cerealis DNA. Although the content of F. proliferatum in barley stems was higher, it was statistically insignificant as compared to F. cerealis. It follows the above that F. cerealis is the most harmful phytopathogenic fungus for barley culture in this experiment, and barley stems receive more extensive fungal damage. To prevent the infection of barley crops with various infectious agents, including phytopathogenic fungi, it is essential to implement an integrated approach incorporating ecological principles of protection. Within these strategies, the authors successfully applied crop rotation and tillage.

