

Introduction
The literature on energy efficiency always initiates from reducing energy consumption to optimizing energy use in order to achieve energy efficiency. Hu and Wang [1] propose total-factor energy efficiency (TFEE) as an estimator of energy efficiency, but their idea ignores that many countries follow the path of increasing energy consumption to seek economic growth. A country with scarce energy endowments always imports energy to supplement its energy needs for economic growth. Increasing energy use to seek economic growth occurs often in the real world.
An energy intensity indicator is able to simultaneously point out the changes of energy consumption and output. Decreasing energy intensity is a good event, which means that the increasing size of output is larger than the increasing use amount of energy, and it also shows the marginal product of energy is larger than unity. This result illustrates that increasing energy use is not necessarily a bad event. Chang [2] proposes the idea of total-factor energy intensity (TFEI), which has had a good correlation with TFEE.
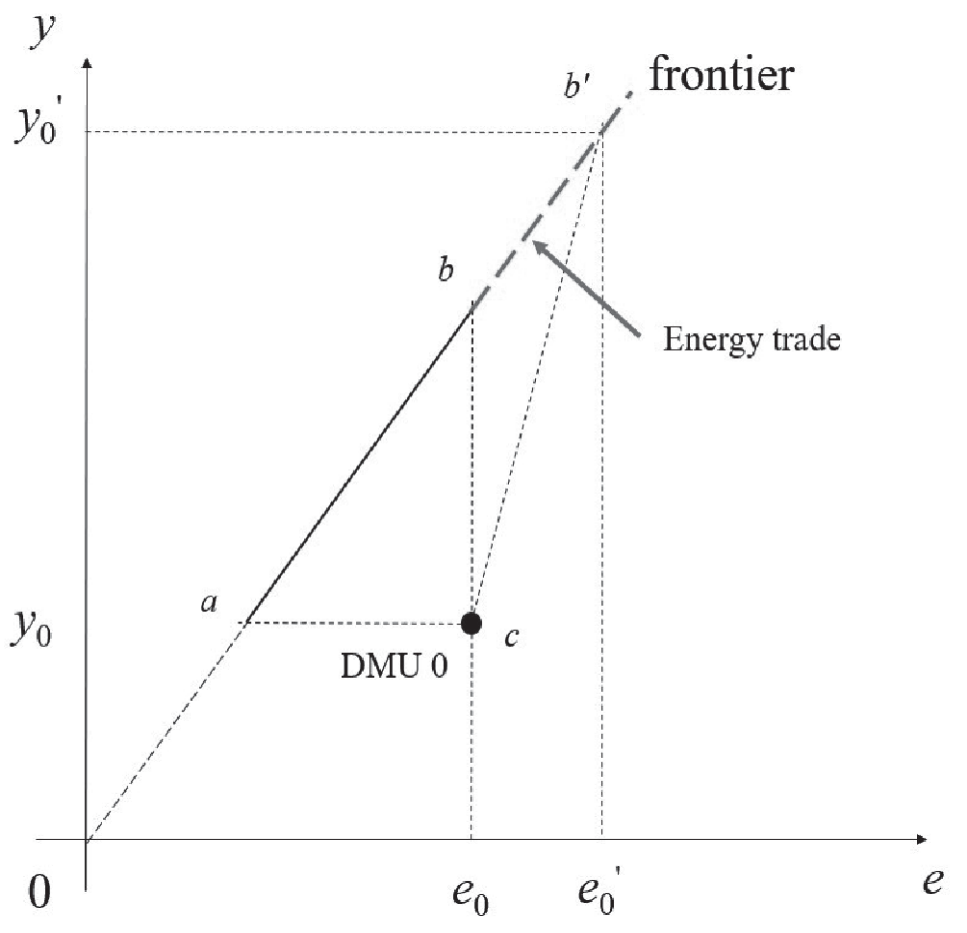
To obtain estimations of TFEE and TFEI one applies the data envelopment analysis (DEA) technique, which traces itself back to three DEA initial works by [3-5]. The idea in this study is different from TFEE and TFEI in that we extend the magnitude of the frontier in the DEA model in order to discuss the scenario of energy use increasing. Fig. 1 illustrates the innovative idea in this paper that decision making units (DMUs) a and b form the frontier curve by the best effective DMUs. Since DMU 0 does not locate and is far from the frontier, it is an ineffective DMU. In other words, DMU 0 has room to improve to catch up to DMUs a and b. Conventionally, the improvement room for DMU 0 is the area of Δabc in which it can promote efficiency by increasing output (y) and/or decreasing energy use (e).
We note that increasing output and energy use can also improve energy intensity as seen in the Δcbb’ area of Fig. 1 for DMU 0. The meaning of the Δcbb’ area is that the size of increasing output is larger than the size of increasing energy use. The literature scarcely discusses energy efficiency in an area where the size of increasing output is larger than the size of increasing energy use. Hence, this viewpoint is new and unique in the study.
China is a good example of using a lot of imported energy to create surprisingly strong economy growth. British Petroleum (BP) energy outlook [6] indicates that the Asia-Pacific area is the biggest energy demand market, where China is listed at the top, and the next two countries are India and Japan. These countries get crude oil and natural gas by importing them from Russia. Taghizadeh-Hesary et al. [7] study energy trade between Russia and the Asia-Pacific area. Hence, we believe a complete frontier curve should include the segment bb’ in which we can discuss the issue of energy trading. In addition, we find a way to increase energy use and simultaneously decrease energy intensity during energy trading.
Increasing energy use through energy imports is a risky event since many factors influence energy supply. One example of energy risk can be confirmed by the news that China and Australia had an energy trade dispute over coal in 2021. Hence, energy resilience (ER) estimation is necessary when a country considers to increase energy use via energy imports. Energy resilience means potential vulnerability of excess energy use against a board range of hazards from extra energy demand. Energy resilience estimation can confirm the risk level of excess energy needed given the performance of energy use.
The rest of the paper runs as follows. Section 2 provides a literature review about energy resilience as a basis for this paper’s study. Section 3 establishes an energy resilience indicator for practical application. Section 4 gives an empirical study by taking 27 European Union (EU) countries as an example and then presents the results. Section 5 is the discussion section. The final section offers policy recommendations and a conclusion.
Literature Review
Energy intensity, defined as the ratio of energy use to output level, indicates that there is a probability to reduce energy intensity when the level of increasing energy use is smaller than level of increasing output. It implies that one can seek a higher output level by increasing energy use. However, increasing energy use by energy imports may raise energy dependency. One European Commission study uncovers that the percentage of energy imports into the EU is 53%, and the bloc’s energy imports particularly depend on crude oil and natural gas [8]. It is widely known that a country with a high percentage of energy import dependency could face high energy security risk. Hence, energy security risk needs to be captured by an estimation of energy resilience in which high energy resilience is expected to bring low energy security risk, and vice versa.
Resilience is the ability to recover after suffering an adversity or uncertain event through persistent performance. Hotelling [9] originally provides the notion of resilience in ecological systems analysis, which can be traced back to 1973. The resilience theory can be applied in many different fields such as psychology, social science, and energy system analysis. The resilience theory has universally been applied in different fields, but there is no commonly accepted definition on resilience estimation [10]. Lovins and Lovins [11] provide the notion of resilience in energy in their book “Brittle Power: Energy Strategy for National Security”. The strand of energy resilience literature can be divided into: (i) energy resilience in a system, which includes the electricity market in South Korea [12] and electricity generation planning in the United Kingdom (UK) [13]; (ii) energy resilience in urban regions of the UK [14] and that of the United States [15]; and (iii) energy resilience at the country level [16,17]. Our paper focuses on energy resilience at the country level.
Energy resilience plays a critical role in energy security. Pode [18] indicates the nexus between energy security and energy dependency and concludes that decreasing energy dependency can prompt national energy security concerns. High energy dependency makes the energy supply side play a vital role. The EU is facing peak energy prices and fears over natural gas supply shortages during the Russia-Ukraine war. As such, Mišík [19] suggests that the EU should improve its energy security.
Energy supply is relative to not only energy security, but also energy dependency. Chalvatzis and Ioannidis [20] study the EU’s energy supply security by benchmarking diversity and energy dependency. Bekhrad et al. [21] take Andalusia, one autonomous community in Spain with high energy import dependency, as an example to investigate its energy supply security. Carfora et al. [22] claim that the benefit of replacing energy import by domestic energy production is one way to reduce energy dependency. These papers show energy dependency seems to have an inverse relationship with energy resilience and energy security, and that energy resilience and energy security move in the same direction.
There is a viewpoint that energy efficiency improvement can effectively strengthen energy resilience. This conclusion comes from Carvallo et al. [23] who find that energy efficiency helps realize the objectives of grid resilience. In addition, some studies present the contribution of energy efficiency on other relative resiliencies. Aldieri et al. [24] claim that energy efficiency improvement via knowledge spillover from investment in sustainable technology can strengthen economic resilience. Aldieri et al. [25] detect that energy efficiency improvement from renewable energy innovation can contribute to resilience in developing and transition economies. Drago and Gatto [26] claim that energy efficiency plays a critical role in the resilience of a country via its energy policy making. Energy efficiency emphasizes lower energy consumption, which decreases energy dependency and hence strengthens energy resilience. However, our paper stands on the viewpoint for allowing energy trading to increase energy consumption as long as energy intensity is maintained or falls.
Energy resilience is the foundation of energy security and has a significant impact on national economic development. Some studies show the importance of energy resilience assessment, such as Kruyt et al. [27] who point out that the aim of assessment and evaluation of energy resilience is to provide resilience actions for better economic performances and ecological sustainability. Jansen and Seebregts [28] note that diversity in energy supplies and sustainable resources are solutions toward energy resilience. Winzer [29] and Ang et al. [30] establish an indicator of energy security to examine energy resilience for analyzing possible sources of risk management. Lin and Bie [31] apply the approach of energy resilience to the policy of energy resilience at the national level. Drago and Gatto [32] claim that energy resilience treatment is a compelling policy quest since energy resilience needs to measure many complex issues. Gatto and Busato [33] point out that the major policy issues for energy resilience include energy vulnerability, security, poverty, and justice.
The DEA model is generally applied to compute an efficiency score. However, we find that some studies with the DEA approach have applied it to compute the energy efficiency score, such as Chang [34], or to measure the technology gap ratio (TGR) score, such as Chang [35] and Chiu [36]. Their ideas prompt us to directly compute the energy resilience score by using an objective function in the DEA model.
Based on the literature, there are some research gaps including: (i) papers seldom provide the idea that increasing energy use by energy import can also improve energy efficiency, but energy resilience should be monitored at the same time; and (ii) DEA papers do not often employ an objective function setting to compute the energy resilience score. Hence, this study focuses on two research problems in order to fill these two gaps: (i) allow to increase energy use via energy import and improve energy efficiency at the same time; and (ii) monitor energy resilience due to energy risk caused by energy import by using the DEA approach.
The research aim of this paper is to compute the energy resilience score, which allows for increased energy use. Since energy use is a vital part of economic activity and increasing energy use may change a country’s energy dependency, the estimations of output efficiency and energy dependency are also important. The literature typically uses the DEA model to study energy efficiency and always emphasizes reducing energy use for energy efficiency promotion. Our paper allows to increase energy consumption when we estimate energy resilience, but increasing energy consumption should be conditional on energy intensity being maintained or improved. We expect that strong energy resilience depends on low energy dependency and/or high output efficiency. The potential contribution of this paper is to establish an energy resilience indicator that not only helps policymakers understand the scores of energy resilience, energy dependency, and output efficiency, but also for them to consider how to adjust energy dependency and to prompt output efficiency and the marginal product of energy.
Methodology
In Fig. 1, let e0 and y0 correspondingly present the energy use and output of DMU 0, and the energy intensity of DMU 0 can be estimated by e0/y0. Based on the energy trading DEA model, as DMU 0 moves on the frontier curve, it needs to increase output Δy0 by using extra energy Δe0. We employ y0* (= y0 + Δy0) and e0* (= e0 + Δe0) to show DMU 0’s effective output and optimal energy use as it achieves the optimal situation, where Δy0 and Δe0 are defined as slack variables on output and energy use for DMU 0. We further define e0/y0 as actual energy intensity and e0*/y0* as target energy intensity.
Equation (1) decomposes e0*/y0*. We find the relationship between e0*/y0* and e0/y0 as:
We next arrange Eq. (1) as:
where Δe0/e0 is the energy dependency growth rate, and y0/y0* is output efficiency. The energy dependency growth rate is the ratio of energy slack (Δe0) to initial energy use (e0). Energy dependency increases as the energy slack is filled up by energy imports. For example, if initial energy use is 100 and energy slack is 8, then the energy dependency growth rate is 8%.
Output efficiency is the ratio of factual output (y0) to target output (y0*). In other words, if the target output is 100 and factual output is 80 less than the target output, then the output efficiency score is 0.8. When (e0*/y0*) /(e0/y0) = 1, it means that actual energy intensity and target energy intensity are the same and also implies that the latter has been achieved; on the contrary, when (e0*/y0*)/(e0/y0)<1, it means that actual energy intensity has room to improve to target energy intensity. In Eq. (2), we know that the conditions to achieve target energy intensity are effective production (i.e., y0/y0* → 1) and low energy dependency growth (i.e., Δe0/Δe0 →0).
Based on the definition of energy resilience as the ability to avoid, prepare for, minimize, adapt to, and recover from a sudden volatility in energy demand, this study presents the formula to compute the energy resilience score for DMU 0 as follows:
The score of energy resilience is between zero and unity. A score being unity means DMU 0 exhibits the best energy resilience since it does not have any change in energy dependency when it faces a sudden event; on the contrary, DMU 0’s energy resilience score may be smaller than unity. Since the energy resilience index in Eq. (3) only considers the energy demand side without considering the output side, we define it as the absolute energy resilience index.
We next develop a relative energy resilience (RER) index in Eq. (4), which involves two layers of energy demand and output target as follows:
The absolute energy resilience index in Eq. (3) is only for volatility in energy use; however, the relative energy resilience index in Eq. (4) is not only for volatility in energy use, but also for the targeted output level. In an extreme case, DMU 0 needs to use a huge amount of energy for a very low output level, which implies that DMU 0 faces weak energy resilience; on the contrary, when DMU 0 has achieved optimal output and has had not any energy dependency change, it means DMU 0 owns the best energy resilience. The score for the relative energy resilience index is also between zero and unity.
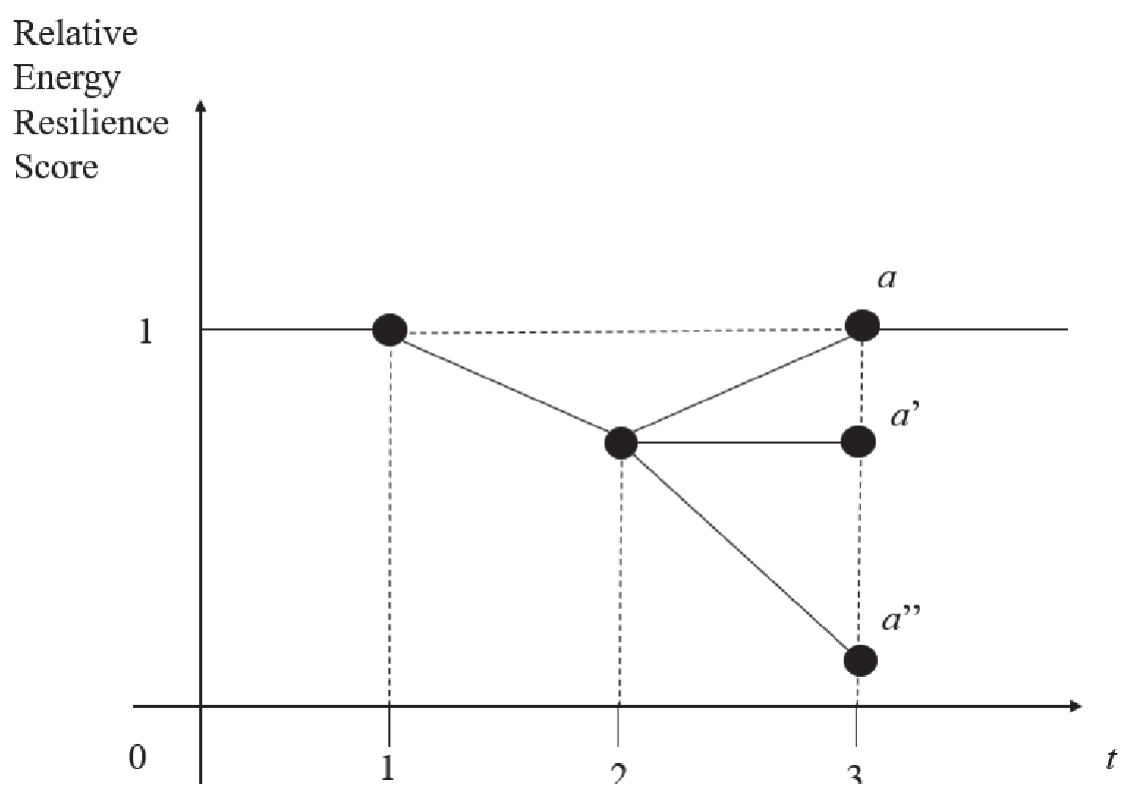
This study presents the geometric implication of the relative energy resilience index in Fig. 2 in which the DMU’s energy resilience score in time period 1 is unity. This implies that the DMU does not have any slack in energy use and output level. In time period 2, the DMU receives the slack caused by volatility in energy use and/or volatility in output level, which pushes its energy resilience score to be smaller than unity. Going into time period 3, the DMU’s energy resilience score may recover to unity the same as in time period 1 at point a, or the same as that in time period 2 marked by point a’, or the score deteriorates more than that in time period 2 at point a’’ , which is called energy vulnerability.
To compute the score of relative energy resilience, this study establishes the energy trading DEA (ET-DEA) model in which a DMU aiming for economic growth uses more energy and obtains extra energy via energy trading. In other words, the ET-DEA model allows a DMU to increase energy use in order to raise gross domestic product (GDP). This study applies the slacks-based measure (SBM) approach by Tone [37] to establish the ET-DEA model for computing the relative energy resilience score. Chang [34] presents the objective function in the DEA model to compute the energy efficiency score, Chang [2] sets up the energy intensity score, and Chang [35] and Chiu et al. [36] build the technology gap ratio. In this paper, we apply the objective function in the ET-DEA model to compute the score for relative energy resilience. The ET-DEA model runs as follows:
The above model describes that DMU 0 uses non-energy input factor (x0) and energy input factor (e0) to create desirable output (y0) such as GDP and to generate undesirable output (u0) such as carbon dioxide (CO2), which is the main factor causing global warming and climate change. We employ the DEA approach to compute the optimal output (y0*) and the optimal energy use (e0*) for DMU 0 by which we can obtain target energy intensity (e0*/y0*), the slacks of output (Δy0 = y0* – y0), and energy use (Δe0 = e0* – e0). Our model runs under the assumption of constant returns to scale (CRS), meaning all DMUs have the same standard on energy intensity estimation. When all DMUs adjust to the frontier curve in Fig. 1, they have the same energy intensity since each point on the frontier curve has the same slope. Based on this perspective, we think the CRS assumption in the DEA model is a reasonable setting to access energy intensity and to further estimate energy resilience.
In model (5) the objective function is the total-factor energy resilience (TFER) for DMU 0 estimated by the energy resilience score (θ0), where θ0∈[0, 1]. A high (low) energy resilience score means DMU 0 has small (large) excess energy demand to achieve the output target. A high (low) energy resilience score also means small (large) slacks in energy use (Δe0) and output (Δy0). Hence, high energy resilience also means low energy dependency growth (Δe0/e0) and high output efficiency (y0/y0*), and vice versa.
In budget constraints, the vectors X, E, Y, and U stand for non-energy input, energy input, desirable output, and undesirable output, respectively. Due to a focus on investigating energy resilience, we do not discuss the adjustment in non-energy inputs, and so we ignore it. Since the amount of CO2 emissions is always limited by the government, we also do not discuss the adjustment of undesirable output. The symbol l stands for a weight vector that connects all DMUs’ input and output factors. The final budget constraint (i.e., (e0*/y0*)/(e0/y0)≤1) guarantees that all slack variables of energy demand and output obtained in model (5) can achieve the aim of energy intensity and prompt actual energy intensity.
The ET-DEA model is an innovative model. This study lists the theoretical contributions of it as follows.
(i) The literature typically targets decreasing energy use given an increase in output, while the ET-DEA model allows for increased energy use for higher output. (ii) The ET-DEA model allows for increasing energy use by means of energy trading. This idea’s set-up into the DEA model seldom appears in the literature. Hence, the innovative model in this paper is named the ET-DEA model. (iii) Because of the potential risk caused by energy trading, the idea of enegy dependency used to estimate energy risk is taken into consideration for the computation of energy resilience score by using the ET-DEA model. (iv) The energy resilience score directly shows up in the objective function of the ET-DEA model. Hence, it is convenient to obtain the energy resilience information by ET-DEA model operation. The ET-DEA model considers all input and output factors in the production process. Hence, energy resilience in the ET-DEA model is a notion of total-factor energy resilience. (v) The ET-DEA model also contributes to a finding that high energy resilience should be conditional on high output efficiency and a low energy dependency growth rate.
Empirical Study
Since the EU is the third biggest economic region in the world, it is beneficial to take 27 EU member countries as observations to evaluate energy resilience. The data sources are the World Bank database and the website of Our World in Data. We take GDP as a desirable output and CO2 emissions as an undesirable output. The energy input factor is energy use, and non-energy input factors include capital stock and labor force. To prevent inflation from disturbing the analysis, we transfer all nominal factors into real ones by taking 2010 as the base year. The data period is from 2010 to 2019. For a clear exhibition of our observations, Table 1 lists and separates the names and codes of the 27 EU countries into the Baltic Sea region (BSR) and non-Baltic Sea region (NBSR).
Descriptive Statistics
Table 2 presents the descriptive statistics of all variables in which we classify all observations from the 27 EU countries into 8 BSR countries and 19 NBSR countries. A comparison between BSR and NBSR shows that the former exhibits more CO2 emissions than that of the latter, and the coefficient of variance of CO2 emissions in BSR is also larger than that in NBSR. This implies that BSR countries have high CO2 emissions and also have a large variance in CO2 emissions. In addition, the situation of primary energy consumption is the same as that of CO2 emissions, whereby BSR uses more primary energy than NBSR, and there is also a large difference on primary energy consumption among them. To summarize, we find a phenomenon in the EU that more primary energy use not only creates more GDP, but also leads to greater CO2 emissions. Even though BSR and NBSR have similar energy intensity in Table 2, we are interested in their energy resilience and their dissimilarity.
Table 1.
Names and codes of BSR and NBSR countries in the EU.
Table 2.
Data descriptive statistics.
Estimation of Energy Resilience
Table 3 exhibits the computation results of the energy resilience score by polling the EU 27 states together. According to regional analysis on BSR and NBSR, two nations with the best energy resilience in the former are Denmark and Sweden, while those with the strongest energy resilience in the latter are Bulgaria, Ireland, Luxembourg, and Malta. The percentages of countries in BSR and in NBSR owning the best energy resilience are around 25% and 21%. For all data periods, the average energy resilience scores in BSR and NBSR are respectively 0.891 and 0.860. According to the ranking of the EU 27 states’ energy resilience scores, 3 countries in BSR and 6 countries in NBSR are covered in the top 10 countries, and the percentages are around 38% and 32%, respectively. From this, BSR seems to be better than NBSR at energy resilience performance.
This paper also presents the correlation coefficients for the EU 27 states in order to confirm the fitness of the energy resilience score’s pattern between the DMU and the region in which it locates. For Denmark, its correlation coefficient is -0.680, which implies that its energy resilience score’s pattern has a middle-high and negative correlation to that in BSR. Based on the ranking of all countries’ energy resilience, Denmark and Sweden in BSR and Bulgaria, Ireland, Luxembourg, and Malta in NBSR own the top ranking, but we see a relative-high and negative correlation to BSR’s and NBSR’s energy resilience score pattern. This result comes from the fact that the energy resilience scores in Denmark, Sweden, Bulgaria, Ireland, Luxembourg, and Malta always remain in unity and are not changed by whole regional energy resilience pattern. In addition, we find that those countries with the bottom two rankings (i.e., Romania in NBSR and Latvia in BSR) have a positive correlation coefficient to energy resilience score patterns in NBSR and BSR. This means that the pattern changes of energy resilience score in Romania and Latvia are similar to the pattern changes in NBSR and BSR, but the energy resilience scores of Romania and Latvia are lower than those of NBSR and BSR. We conclude that a country with a relative-high and negative correlation coefficient to the regional energy resilience scores exhibits strong energy resilience.
Table 3.
Energy resilience score in the EU 27 states.
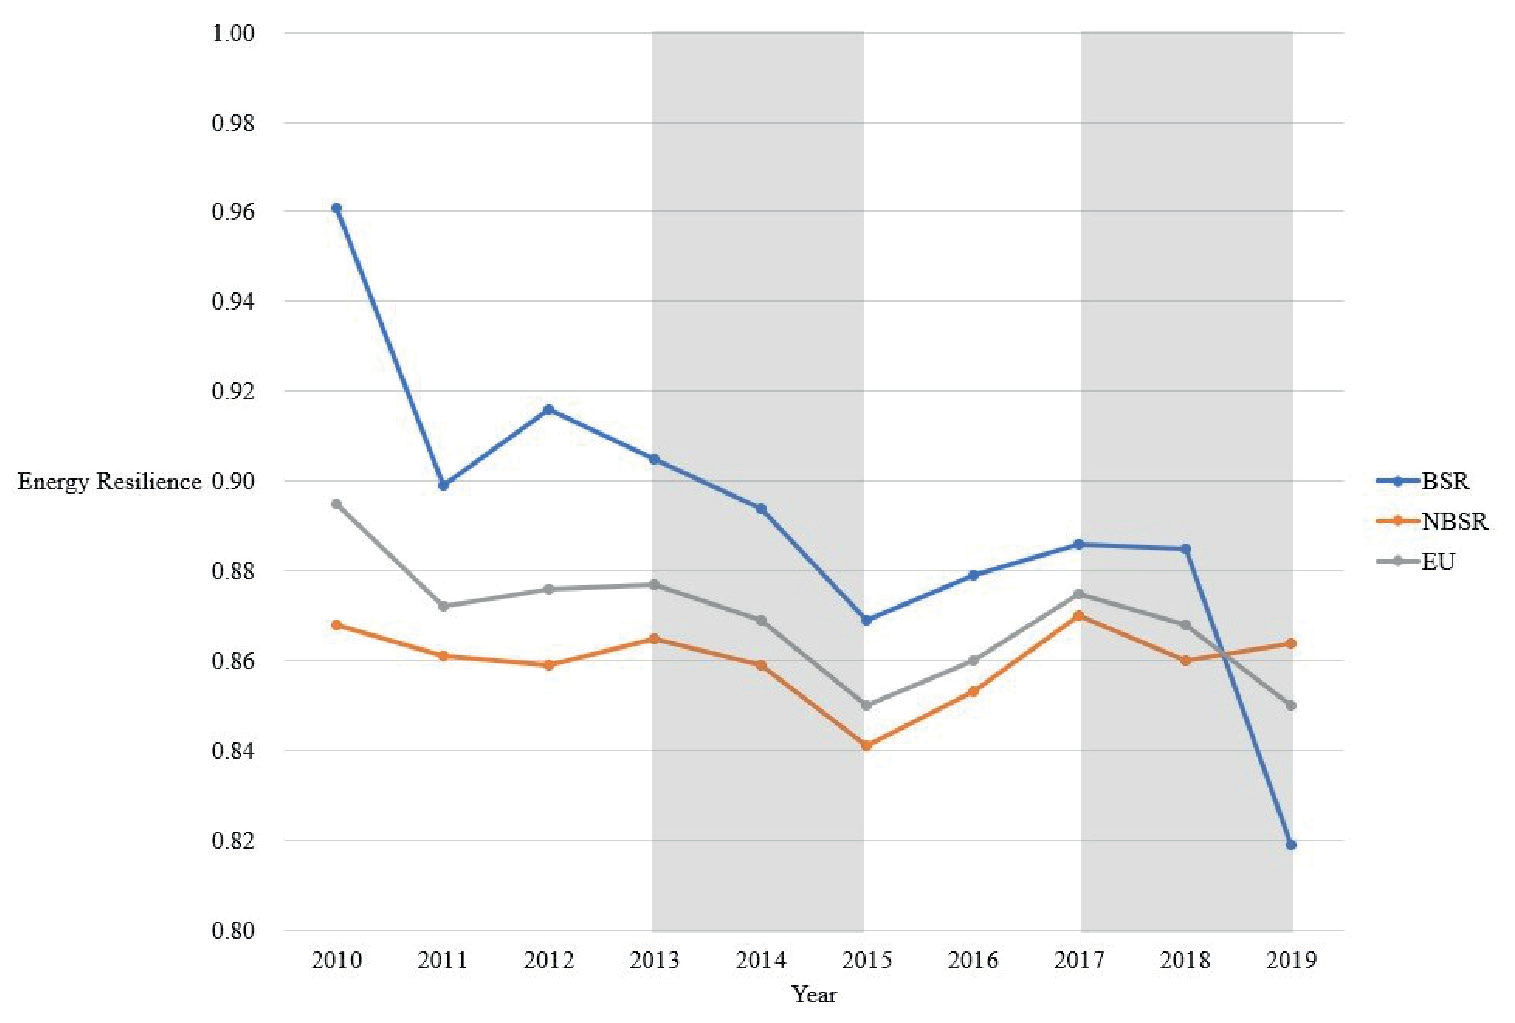
Fig. 3 shows the patterns of energy resilience scores for BSR, NBSR, and EU. The energy resilience pattern in BSR has larger volatility than that in NBSR. This result comes from the fact that there is larger energy consumption variance in BSR than that in NBSR. Over the 10-year data period, BSR’s energy resilience being higher than NBSR’s happens 9 times; in other words, NBSR’s energy resilience being higher than BSR’s occurs only 1 time. BSR is better than NBSR in energy resilience performance, but the volatility of energy resilience in BSR is greater than that in NBSR. After the Paris Agreement was signed in December 2015, BSR and NBSR exhibit rising energy resilience scores in 2016 and 2017. Continuously deteriorating energy resilience is a warning of a national energy security risk when one country is seeking economic prosperity. Fig. 3 shows that BSR twice suffered energy vulnerability during 2014 and 2015 and during 2018 and 2019, while NBSR suffered energy vulnerability once during 2014 and 2015. For the EU, it twice encountered energy vulnerability in 2014 and 2015 and in 2018 and 2019.
Comparing the volatilities of energy resilience score between BSR and NBSR, we find that the range of BSR is between 0.80 and 0.96, but NBSR is stable at between 0.84 and 0.87. The trend of energy resilience in BSR is going down, but this trend in NBSR is smooth. Because of an obvious downward trend in BSR, the trend of energy resilience in the EU also is downward. We conclude that BSR’s energy resilience is weakening during the data period, and weakened energy resilience causes the EU’s energy resilience to go down. There is a weakening energy resilience trend from 2010 to 2019 with energy vulnerability occurring in 2014 and 2015 and in 2018 and 2019 for BSR, when energy security risk soared as it sought economic growth.
Energy Resilience and Energy Intensity
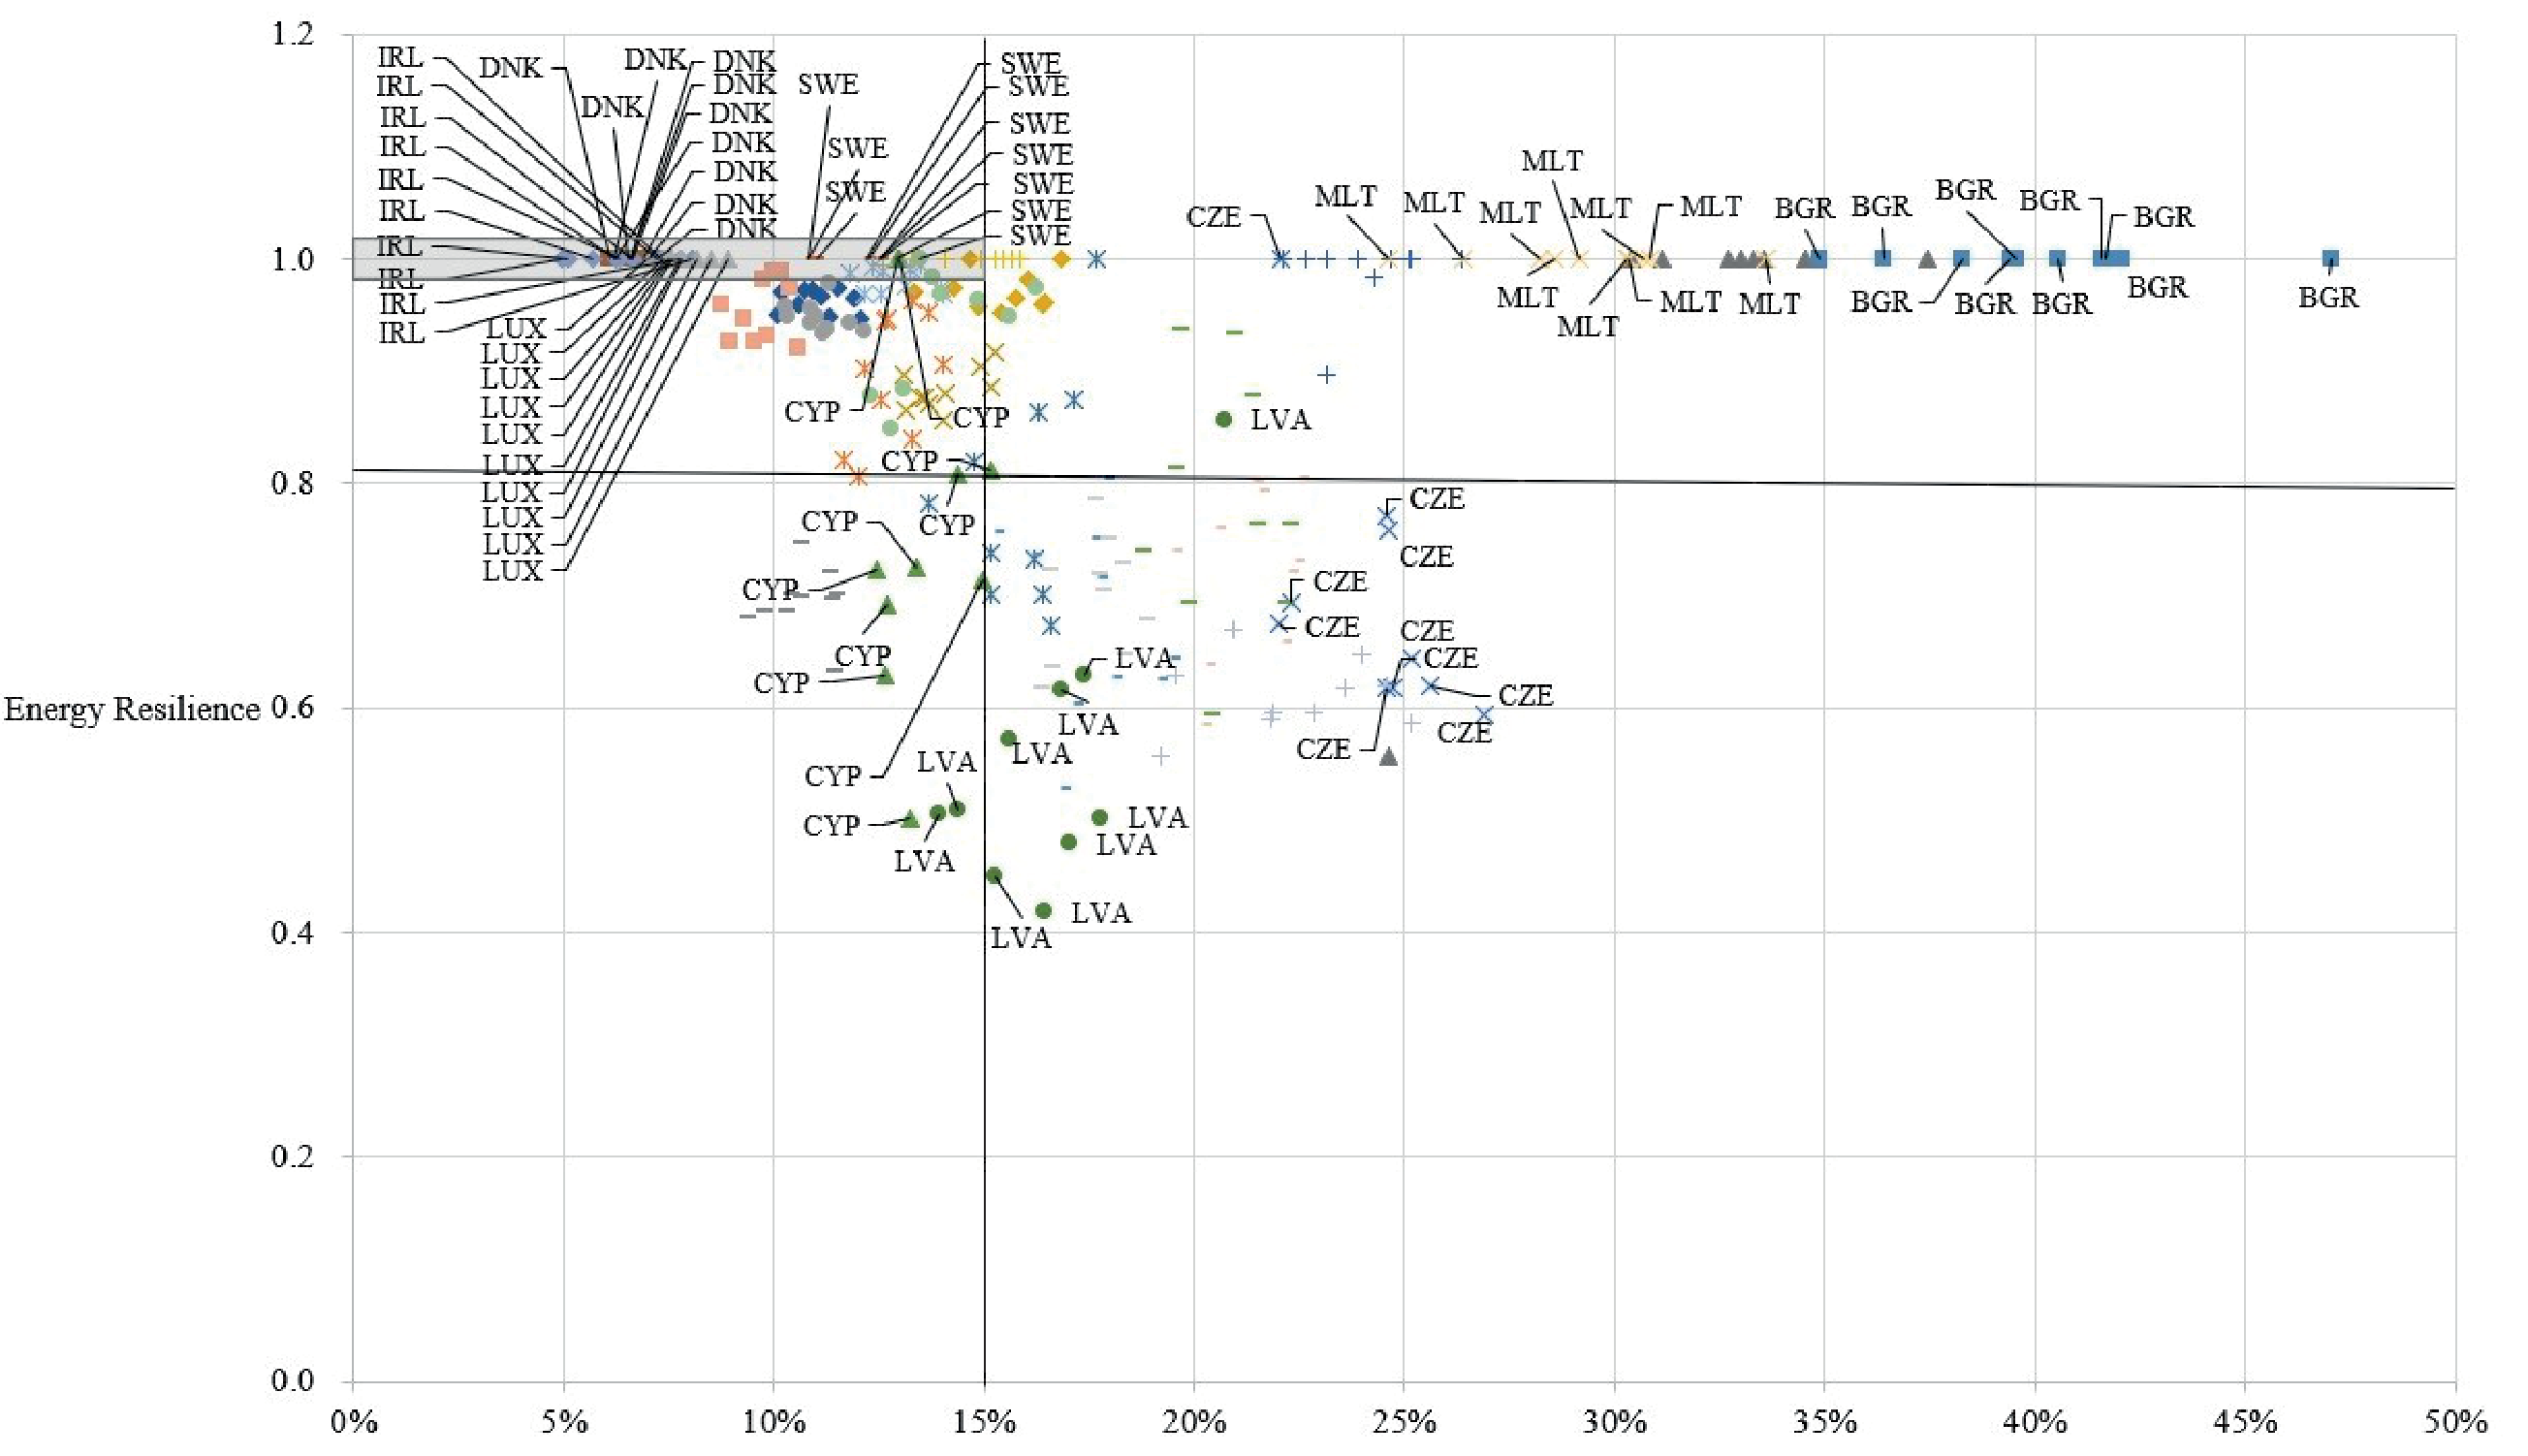
High energy resilience and low energy intensity are national development targets. The former is relative to national energy security, and the latter helps mitigate climate change. Fig. 4 exhibits the relationship between energy resilience and energy intensity. We find that energy resilience and energy intensity have a low correlation in which a country with high (low) energy resilience is not guaranteed to have low (high) energy intensity. Taking six countries as observations, Denmark, Sweden, Bulgaria, Ireland, Luxembourg, and Malta, with the strongest energy resilience during the data period, we find Denmark and Sweden in BSR and Ireland and Luxembourg in NBSR exhibit high energy resilience and low energy intensity, which is a perfect situation for energy use. This situation is marked by gray color in Fig. 4, which is also an ideal target of energy use for all countries. Based on this target, we find that Bulgaria and Malta have strong energy resilience, but high energy intensity. This implies that Bulgaria and Malta can further raise their output level to reduce energy intensity. If they do so, they will move forward to the target area of gray color in Fig. 4.
When we divide the plane into four areas by taking the energy resilience of 0.8 and energy intensity of 15% as standards, we find that Cyprus has weak energy resilience, but does well in energy intensity. This result implies that Cyprus has a large output gap and a small energy gap. If Cyprus effectively uses energy input to increase its output level and prompt output efficiency, then it can improve energy resilience. In Fig. 4, Latvia in BSR and Czech Republic in NBSR have low energy resilience and high energy intensity, implying that they have great energy gaps and do not effectively use energy to create output. The path to the best energy use situation for them is to fill up the energy gap and effectively use energy to prompt output efficiency by strengthening energy resilience and lowering energy intensity. Through a simultaneous application of energy resilience and energy intensity, we find that Denmark and Sweden in BSR and Ireland and Luxembourg in NBSR are four countries in the EU with high energy resilience and low energy intensity.
Slacks of Energy and Output
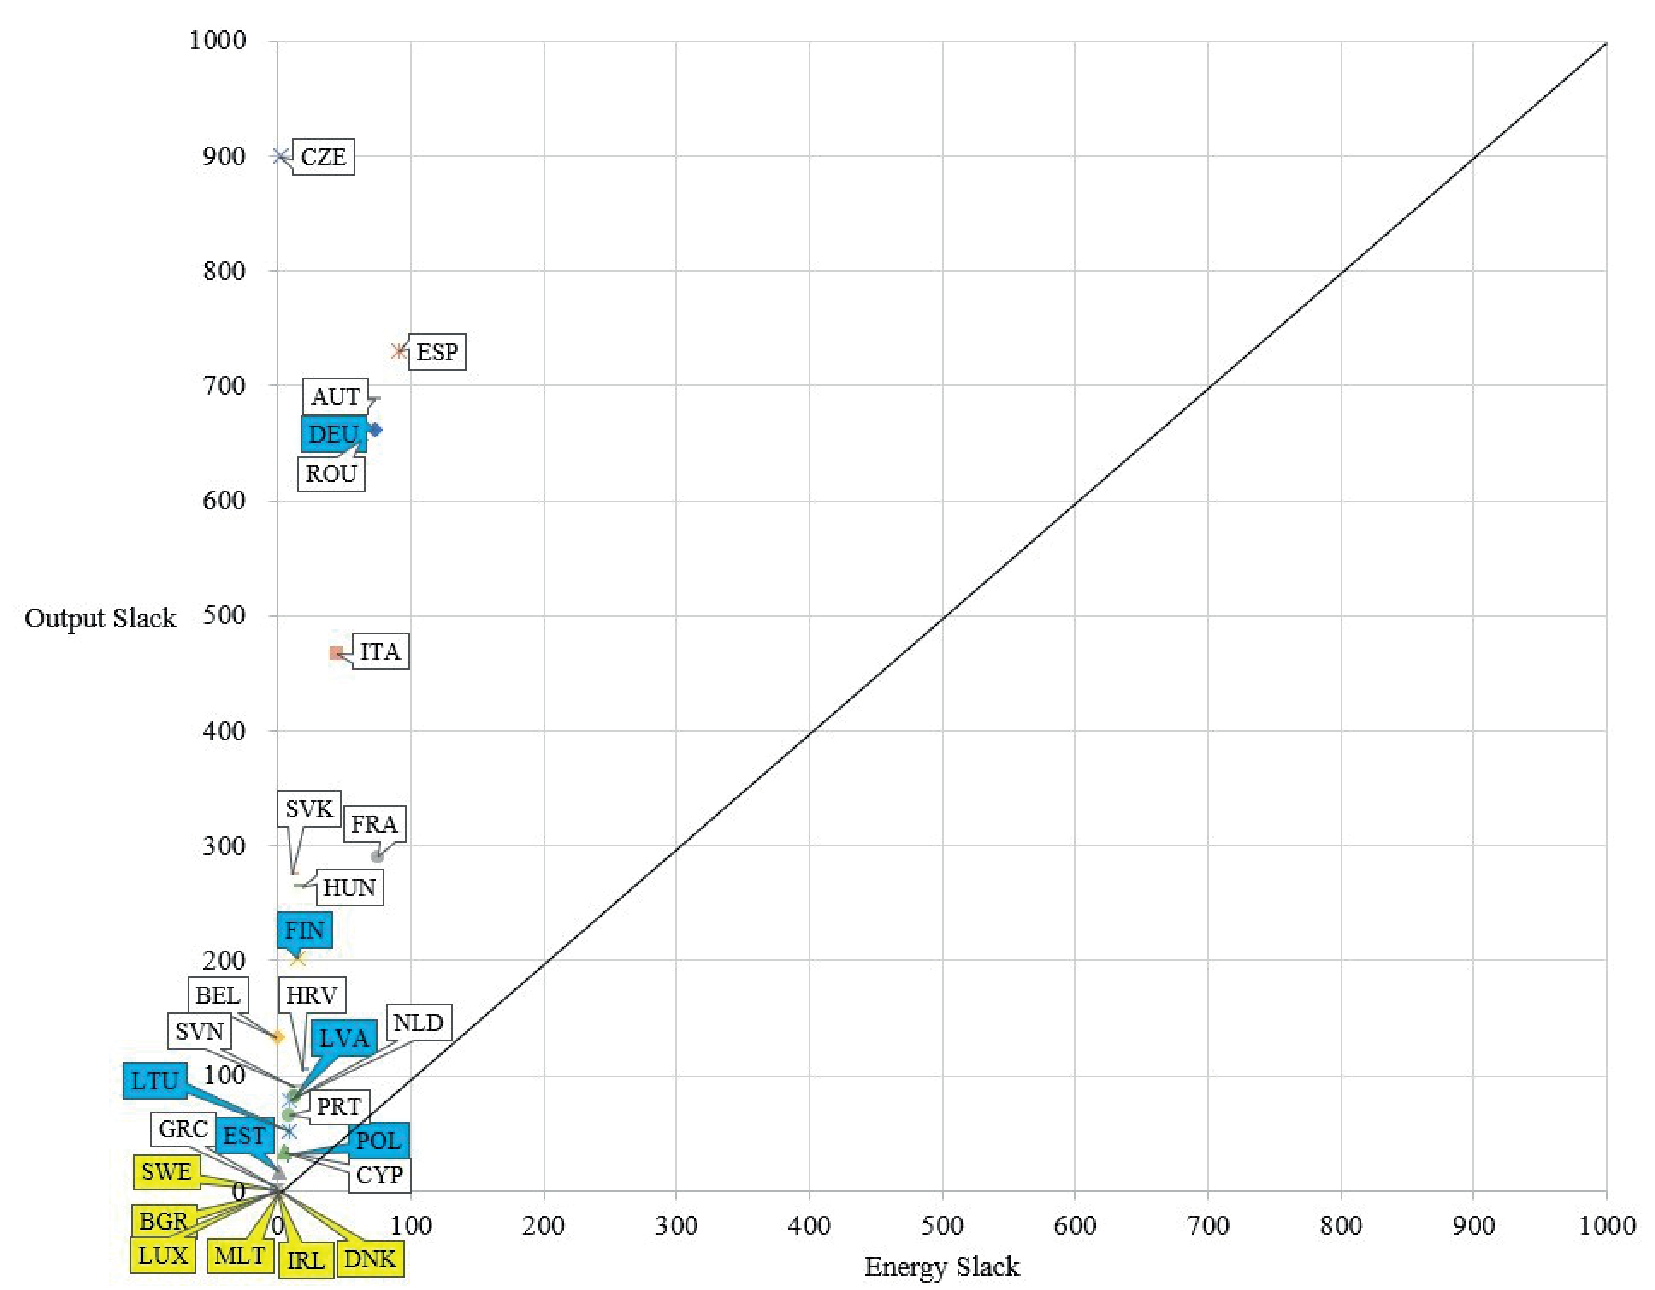
For achieving the best energy resilience, the DMU has to fill up the output gap and energy gap. The best energy resilience is to realize a zero energy gap and zero output gap, as presented in Fig. 5 with its position being at the origin. In Fig. 5, Denmark and Sweden in BSR and Bulgaria, Ireland, Luxembourg, and Malta in NBSR have zero slacks on energy use and output level, and so they present the best energy resilience. We use a 45-degree line to divide the plane with the X-axis being energy slack and Y-axis being output slack. There are two triangles in which the lower triangle presents that the energy slack is larger than the output slack, and the upper triangle presents that the output slack is larger than the energy slack. Fig. 5 shows that the marginal product of energy for the EU 27 countries has to be larger than unity in order to achieve the best energy resilience. In other words, the marginal product of energy must be larger than unity for realizing the best energy resilience.
Taking Czech Republic as an example, if it wants to realize the best energy resilience, then it only needs to increase a little energy use, but it should also use a little increased energy to create a very large and extra output level. We take Spain as another example, where it needs to increase the most energy demand among the EU 27 countries to create the second-highest extra output level for achieving the best energy resilience. Some countries in Fig. 5, such as Poland in BSR and Greece and Netherlands in NBSR, own small slacks of energy and output, meaning that they are not only close to zero energy slack and zero output slack, but also have high energy resilience. In addition, we find that BSR countries concentrate more around the origin point than do NBSR countries, which implies that BSR exhibits better energy resilience than NBSR. On the contrary, when the country’s location in Fig. 5 is far from origin point such as Czech Republic, then it will exhibit weak energy resilience.
Energy Resilience, Output Efficiency, and Energy Dependency
Based on the objective function in model (5), we know that the energy resilience score depends on the sizes of output slack and energy slack. The output slack can help estimate output efficiency by using the formula with y0/y0*, which can be seen in Eq. (2), and the energy slack can estimate the energy dependency growth rate by using the formula with Δe0/e0, which can also be seen in Eq. (2). Tables 4 and 5 present the computation results of output efficiency and energy dependency growth rate taking the best energy resilience as the target, respectively.
Table 4 shows that the average output efficiency in the EU is 0.919, in BSR it is 0.941, and in NBSR it is 0.909, which imply that output efficiency in BSR is higher than that in NBSR. Table 5 presents that the energy dependency growth rates for achieving the best energy resilience in the EU, BSR, and NBSR are all 6%, meaning that there is an energy risk in increasing energy use in the EU, BSR, and NBSR before they achieve the best energy resilience. Specifically, they face a 6% energy gap, and the energy gap weakens their energy resilience. As we consider output efficiency and energy dependency growth rate at the same time, BSR is better than NBSR since the former presents higher output efficiency versus the latter, and they have the same energy gap. However, Table 5 shows that BSR exhibits large volatility in energy dependency growth rate with the lowest point being 2% and the highest point being 9%. Comparing BSR to NBSR with the lowest energy dependency growth rate being 5% and the highest energy dependency growth rate being 7%, the volatility of NBSR’s energy dependency growth rate is flatter versus that in BSR.
From a micro-level observation, we find that Latvia in BSR has the lowest output efficiency. The countries with the bottom three output efficiencies in NBSR are Czech Republic, Romania, and Slovakia Republic. The country with the largest energy gap (i.e., highest energy dependency) in BSR is Latvia. The top four countries with the largest energy gap in NBSR are Croatia, Austria, Romania, and Slovenia. The latter two countries have the same energy dependency growth rates of 16%. We summarize that Latvia is a country with low output efficiency and the highest energy dependency growth rate, giving it the lowest energy resilience in BSR, even in the EU. This result also tells us the reasons for low energy resilience are low output efficiency and high energy dependency growth rate. In other words, the conditions for a country with strong energy resilience are high output efficiency and low energy dependency growth rate. Hence, one can refer to a country’s energy resilience to observe its output efficiency and energy dependency growth rate.
Table 4.
Output efficiency in the EU 27 states.
Table 5.
Energy dependency growth rate in the EU 27 states.
Table 6.
Correlation coefficients.
Table 6 presents the investigation of correlation coefficients among energy resilience, output efficiency, and energy dependency growth rate in which we divide the observations into two regions of BSR and NBSR. No matter for BSR or NBSR, Table 6 always shows that energy resilience has a positive relation to output efficiency and a negative relation to energy dependency growth rate, and there is a negative relation between output efficiency and energy dependency growth rate. BSR has a positive and stronger relationship between energy resilience and output efficiency than does NBSR. In addition, BSR has negative and stronger relationships than NBSR between energy resilience and energy dependency growth rate and between output efficiency and energy dependency growth rate. The results imply that improving output efficiency and reducing the energy dependency growth rate effectively strengthen energy resilience, and this effect is stronger in BSR than in NBSR. In addition, targeting output efficiency will reduce energy dependency, and this effect is more obvious in BSR than in NBSR. We conclude that high energy resilience needs high output efficiency and low energy dependency growth rate to support it, and high output efficiency reduces the energy dependency growth rate. Strengthening energy resilience by improving output efficiency and reducing the energy dependency growth rate is more effective to BSR than to NBSR.
Discussion
This study concludes that strong energy resilience should be conditional on high output efficiency and low energy dependency. Energy intensity is formally denoted as energy consumption to output. If we take import energy intensity as import energy consumption to output, and a country has low (high) dependence on energy import, then it exhibits low (high) import energy intensity. We thus connect the relationship between import energy intensity and energy resilience as low (high) import energy intensity causing high (low) energy resilience. In this paper, relative energy resilience, energy dependency, output efficiency, and energy intensity are divided into import energy intensity and self-owned energy intensity in Fig. 6 in which import energy intensity has an inverse relationship to energy resilience.
The empirical study section concludes that Denmark and Sweden in BSR and Bulgaria, Ireland, Luxembourg, and Malta in NBSR have the best energy resilience. Gökgöz and yalҫin [38] find that Denmark and Sweden are superior countries in the EU for energy security performance. Martínez-García et al. [39] indicate some countries with the least energy dependency to Russian gas are Sweden in BSR and Ireland and Malta in NBSR. This result implies that energy resilience has a closer negative relationship to energy dependency. De Rosa et al. [40] provide accurate data on the relationship between energy dependency and energy security, whereby import dependency has reduced energy security by approximately 30% in the EU since the high proportion of energy import concentrates on a limited number of countries.
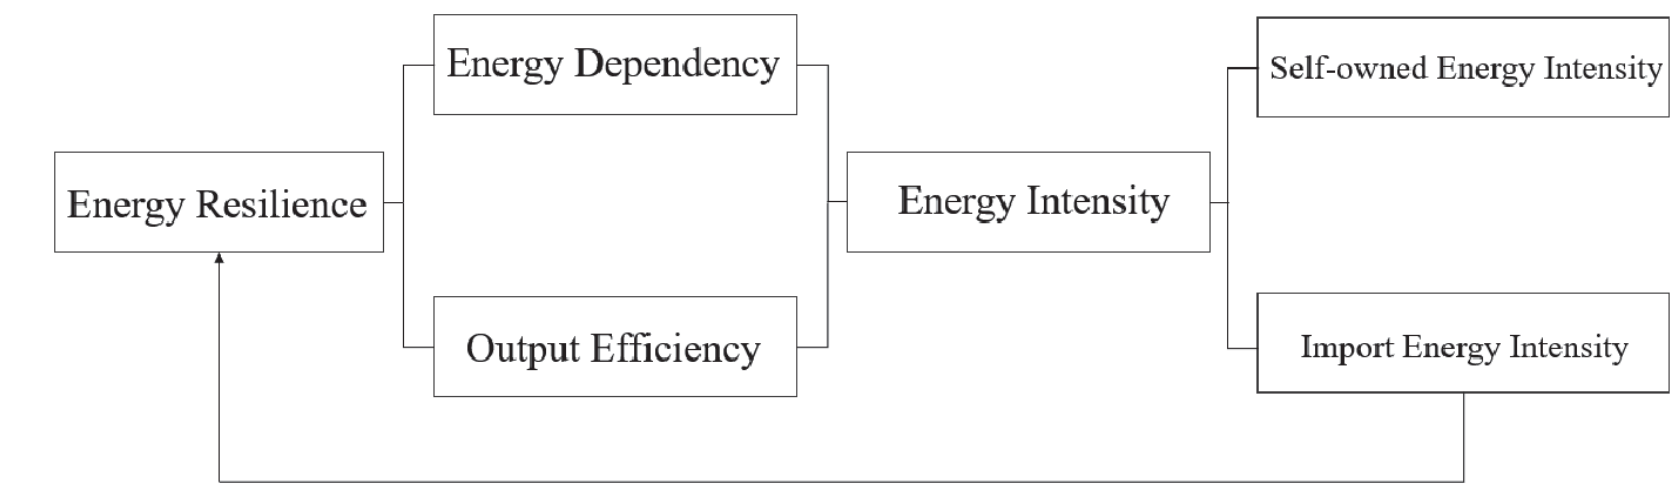
When we further consider energy intensity with energy resilience together, the empirical study in this paper indicates that Denmark and Sweden in BSR and Ireland and Luxembourg in NBSR present high energy resilience and low energy intensity. Furthermore, high energy resilience should be conditional on high output efficiency and low energy dependency. According to Fig. 6, high output efficiency and low import energy dependency directly correlate to high energy resilience. Brodny and tutak [41] report that Sweden has used the most renewable energy sources in its industrial sector, which may cause low import energy dependency.
Based on a regional comparison between BSR and NBSR, this paper offers that BSR has better energy resilience than NBSR. This result may be caused by BSR being the first macro-region of the EU, and the EU has implemented many energy policy priorities in order to improve sustainable energy development in this region [42]. Grigoryve and Medzhidova [43] demonstrate that the EU’s Green Deal will strengthen energy resilience in BSR by developing hydrogen technologies and seeking financial investment to defend the monopoly power of gas supplies in BSR. Kamyk et al. [44] take Poland as one country in BSR as the research example and recommend the way to strengthen energy resilience is via the means of diversification of crude oil imports.
BSR has better energy resilience than NBSR, but the volatility of energy dependency in BSR is larger than that in NBSR. This result may be caused by Latvia as one of the countries in BSR that has the lowest energy resilience in BSR. However, augutis et al. [45] study the Baltic States, including Estonia, Latvia, and Lithuania, and conclude that Estonia and Latvia have sufficient self-owned energy resources, while Lithuania heavily depends on energy import. Hence, we speculate that the low energy resilience in Latvia may be caused by its low output efficiency instead of its high energy dependency. Mišík [46] presents the growing alarm of energy security in the EU, such as soaring energy prices in 2021 and natural gas supply shortages in the winter of 2022. Our research result finds the other way to strengthen energy resilience is through output efficiency improvement and lower energy dependency.
Conclusions
Energy resilience is a vital matter not only to energy security, but also to national security. The literature always emphasizes reducing energy consumption, but we actually find many countries still import a lot of energy and energy dependency continues to maintain a high level. Hence, this study allows a country to increase energy use and then we estimate its energy resilience. The empirical sample objectives are 27 EU member countries, and the data period is from 2010 to 2019. To conduct regional analysis and comparisons, we divide the EU into BSR and NBSR.
We present the following findings of this study. During the data period, the energy resilience in BSR is higher than that in NBSR, but energy vulnerability in BSR appears twice, while it appears once for NBSR. If the correlation coefficient of energy resilience for a country to the region that it is located is high and negative, then this country exhibits strong energy resilience. Besides energy resilience, we also care about energy intensity. Based on these two indicators, a strongly performing country will have robust energy resilience and low energy intensity. Our empirical analysis finds that Denmark and Sweden in BSR and Ireland and Luxembourg in NBSR are model countries with strong energy resilience and low energy intensity.
Slack analysis shows that the condition to achieve the best energy resilience is when the marginal product of energy is larger than unity. The analysis of equation decomposition also shows that strong energy resilience relies on high output efficiency and low energy dependency growth rate. All EU countries are suggested to have a higher marginal product of energy than unity, and the higher the better. Our empirical results find that the marginal products of energy in BSR and NBSR are larger than unity, and energy resilience in BSR is better than that in NBSR, which is caused by the former presenting higher output efficiency than the latter and both of them having the same energy dependency growth rate. Even so, the volatility of energy dependency growth rate in BSR is bigger than that in NBSR. Hence, we summarize three conditions for achieving energy resilience: the marginal product of energy being larger than unity, high output efficiency, and low energy dependency growth rate. This may be one available way to find a country with strong energy resilience by observing its marginal product of energy, output efficiency, and energy dependency growth rate.
Based on the findings above, we suggest that proper energy and production management can help with the marginal product of energy and output efficiency. Increasing energy consumption through energy imports may make energy dependency soar. One way to reduce the energy dependency growth rate and to fill the energy gap is via home-made renewable energy. Hence, research and development (R&D) on renewable energy should be critical to national development. We summarize that the marginal products of energy, output efficiency, and energy dependency are three factors relative to energy resilience. Effective energy, strong production management, and renewable energy R&D are three paths to strengthen energy resilience.
This research applies the innovative ET-DEA model created within this paper to obtain the findings above. We list its main contributions as follows. First, we extend the frontier curve range in the DEA model to allow for energy trading and then estimate energy resilience. Second, the ET-DEA model set up herein directly obtains the energy resilience score from its objective function. Third, energy resilience in this paper is a notion of total-factor energy resilience, because all input and output factors are considered in the ET-DEA model. Lastly, we find that energy resilience improvement is necessarily relative to the marginal product of energy, energy dependency, output efficiency, and import energy intensity. In the future, the notion of resilience from the ET-DEA model can be extended to various fields including environment, climate, social science, and so on to discuss environmental resilience, climate resilience, and society resilience. In addition, the CO2 constraint in the current model can be relaxed to find various results when adjusting for CO2 output.

